Key takeaways:

Between 2018 and 2021, adult literacy rates across African nations exhibited significant disparities. Seychelles and South Africa led with literacy rates of 96% and 95%, respectively, indicating a high proportion of literate adults. Conversely, Chad had the lowest literacy rate during this period.
These statistics underscore the uneven progress in educational attainment across Africa, highlighting the need for targeted interventions to improve literacy in lower-performing nations.
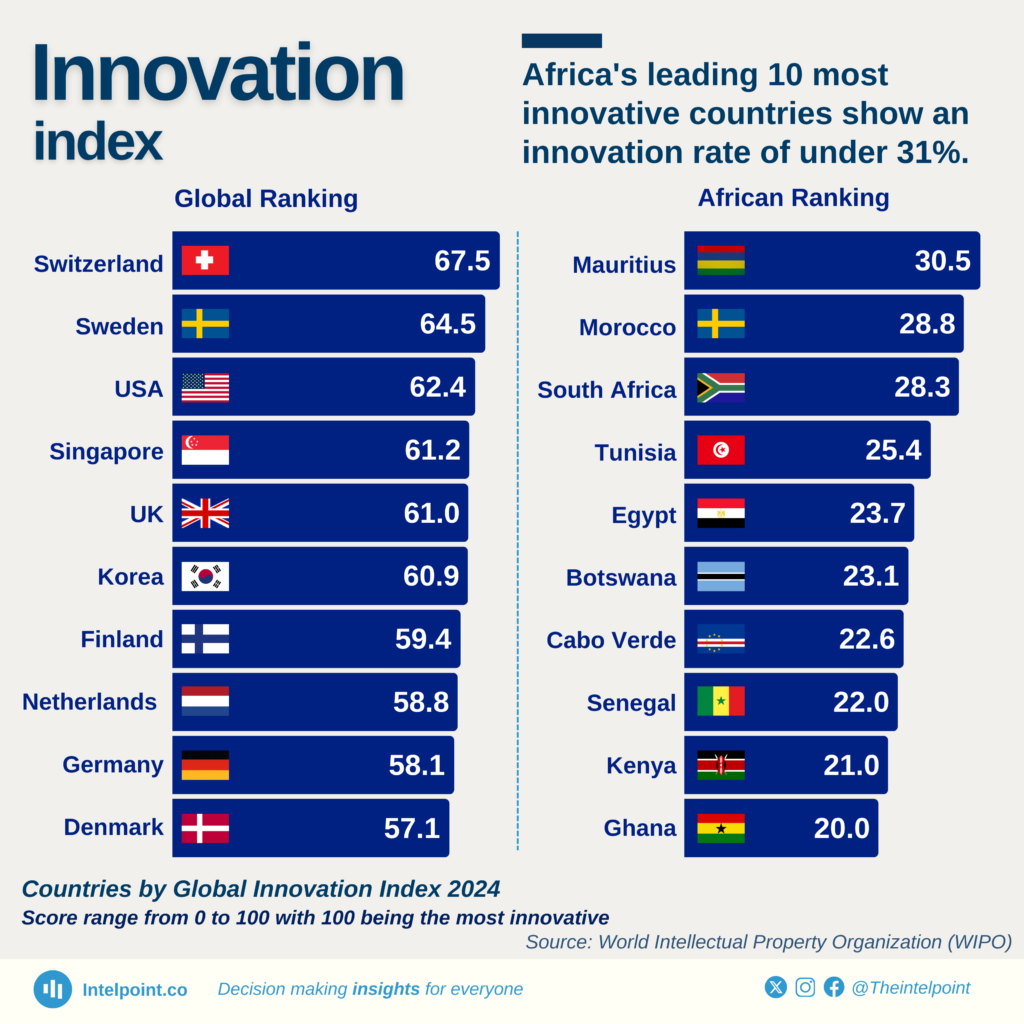
The Global Innovation Index 2024 reveals a striking contrast in innovation performance between countries globally and across Africa. Switzerland leads the global rankings with an impressive score of 67.5, followed by Sweden (64.5) and the USA (62.4), highlighting their sustained investments in research, development, and technological advancement.
In Africa, Mauritius takes the top spot with a score of 30.5, followed closely by Morocco (28.8) and South Africa (28.3). However, even Africa's most innovative nations achieve less than half the score of global leaders, indicating a significant innovation gap.
Nigeria ranks 15th in the African ranking and 113th globally, out of 133 countries, with a score of 17.1.
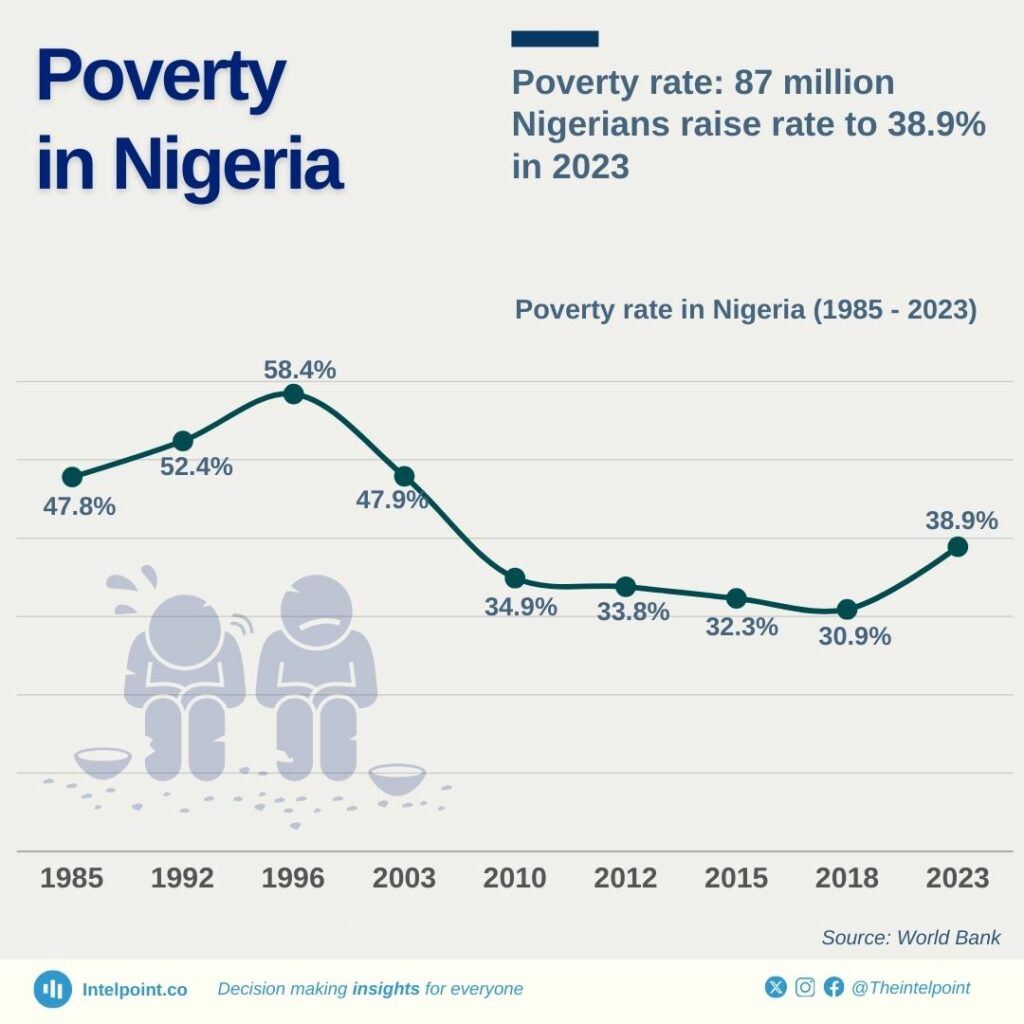
Despite various cash assistance programmes, including the Conditional Cash Transfer (CCT) Program, and extensive macroeconomic reforms such as the unification of the exchange rate and the removal of fuel subsidies, poverty in Nigeria rose to 38.9% in 2023, leaving 87 million Nigerians in poverty.

The 2024 Global Peace Index reveals a decline in peacefulness in 97 countries, the highest since the index began.
Nigeria is among the nations affected by regional conflicts and rising violence. With a peace index score of 2.91, Nigeria is facing increasing challenges.
A deteriorating peace score impacts foreign investment and economic stability. Global economic losses due to violence reached $19.1 trillion in 2023.
Key takeaways:
Key takeaways:
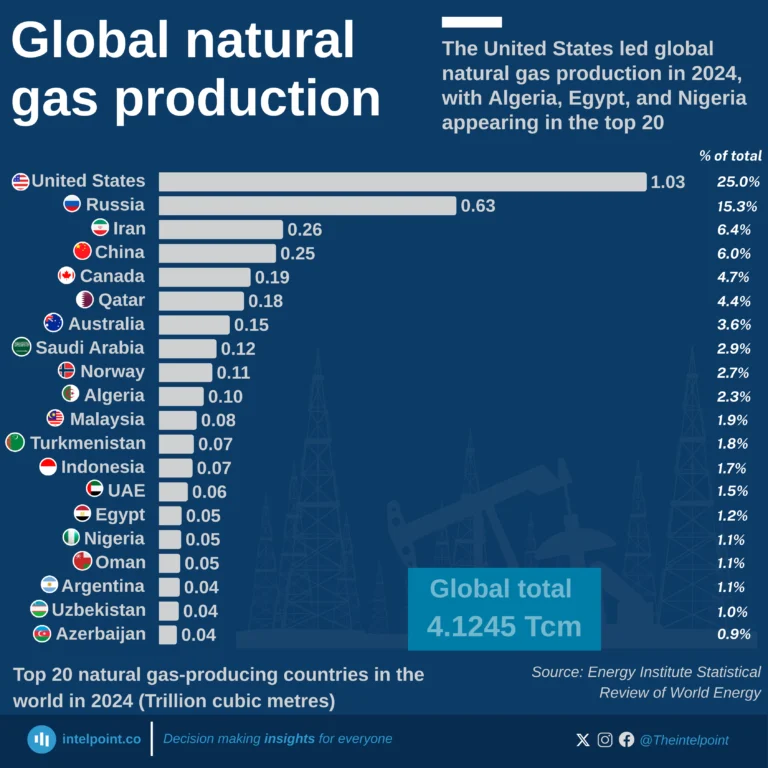
The United States dominates global natural gas production in 2024, contributing 1.03 trillion cubic metres (Tcm), nearly one-quarter of the world’s total.
Russia (0.63Tcm) and Iran (0.26Tcm) follow as the second and third largest producers.
China (0.25Tcm) and Canada (0.19Tcm) also feature strongly, rounding out the top five producers.
Collectively, these top five countries account for more than 50% of global production.
Emerging producers like Nigeria, Egypt, and Azerbaijan contribute significantly to the supply but remain far behind the leading nations.
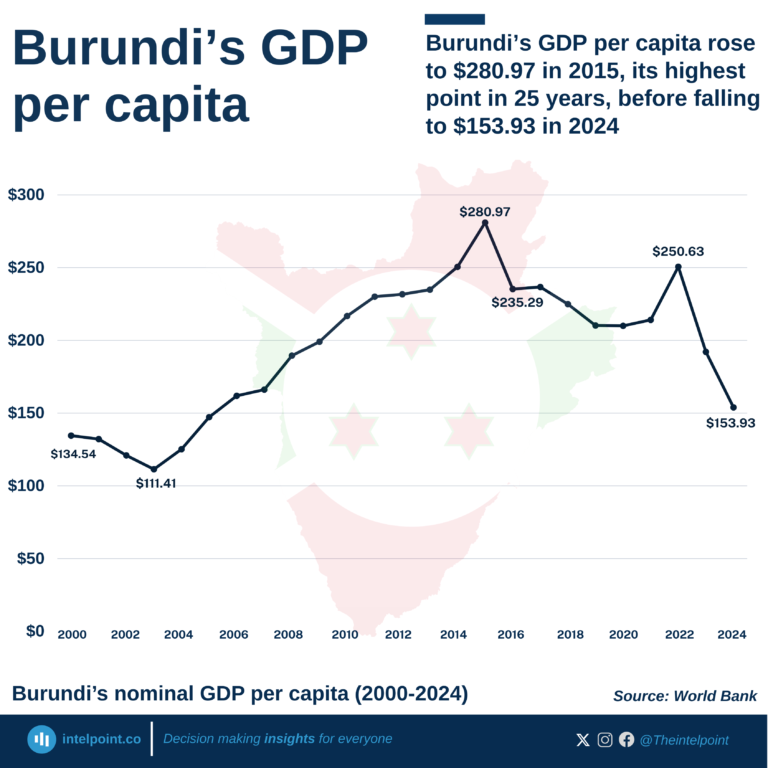
Burundi recorded its highest GDP per capita in 2015 ($280.97).
By 2024, GDP per capita dropped to $153.93, a decline of nearly 45% from its peak.
Burundi’s population exceeds 13 million (2024), which dilutes income per person even when overall GDP grows.
Structural challenges like limited industrialization, reliance on subsistence farming, and political instability contribute to stagnation.
Since 2015, Burundi has held the lowest GDP per capita in Africa—and at $153.9 in 2024, it is the poorest country in the world by GDP per capita.