Zamfara, the lowest contributor, received over 5× its input, while Kano, the highest contributor, had the lowest relative gain

Key Takeaways

  • The North-West region received ₦66.55 billion, more than double its remittance (₦28.31B), showing a heavy reliance on federal VAT sharing.
  • Zamfara, the lowest contributor (₦1.45B), received the highest percentage gain (+433%), getting ₦7.72B, while Kano, the highest contributor (₦9.59B), had the smallest relative gain (+41.5%).
  • Kaduna and Katsina, despite remitting ₦3.50B and ₦3.86B, received ₦10.18B and ₦10.01B, respectively, nearly tripling their remittance.
  • Kano remitted 34% of the zone’s VAT but received only 20.4% of the total allocation, reinforcing that VAT is distributed based on equality and not economic strength.

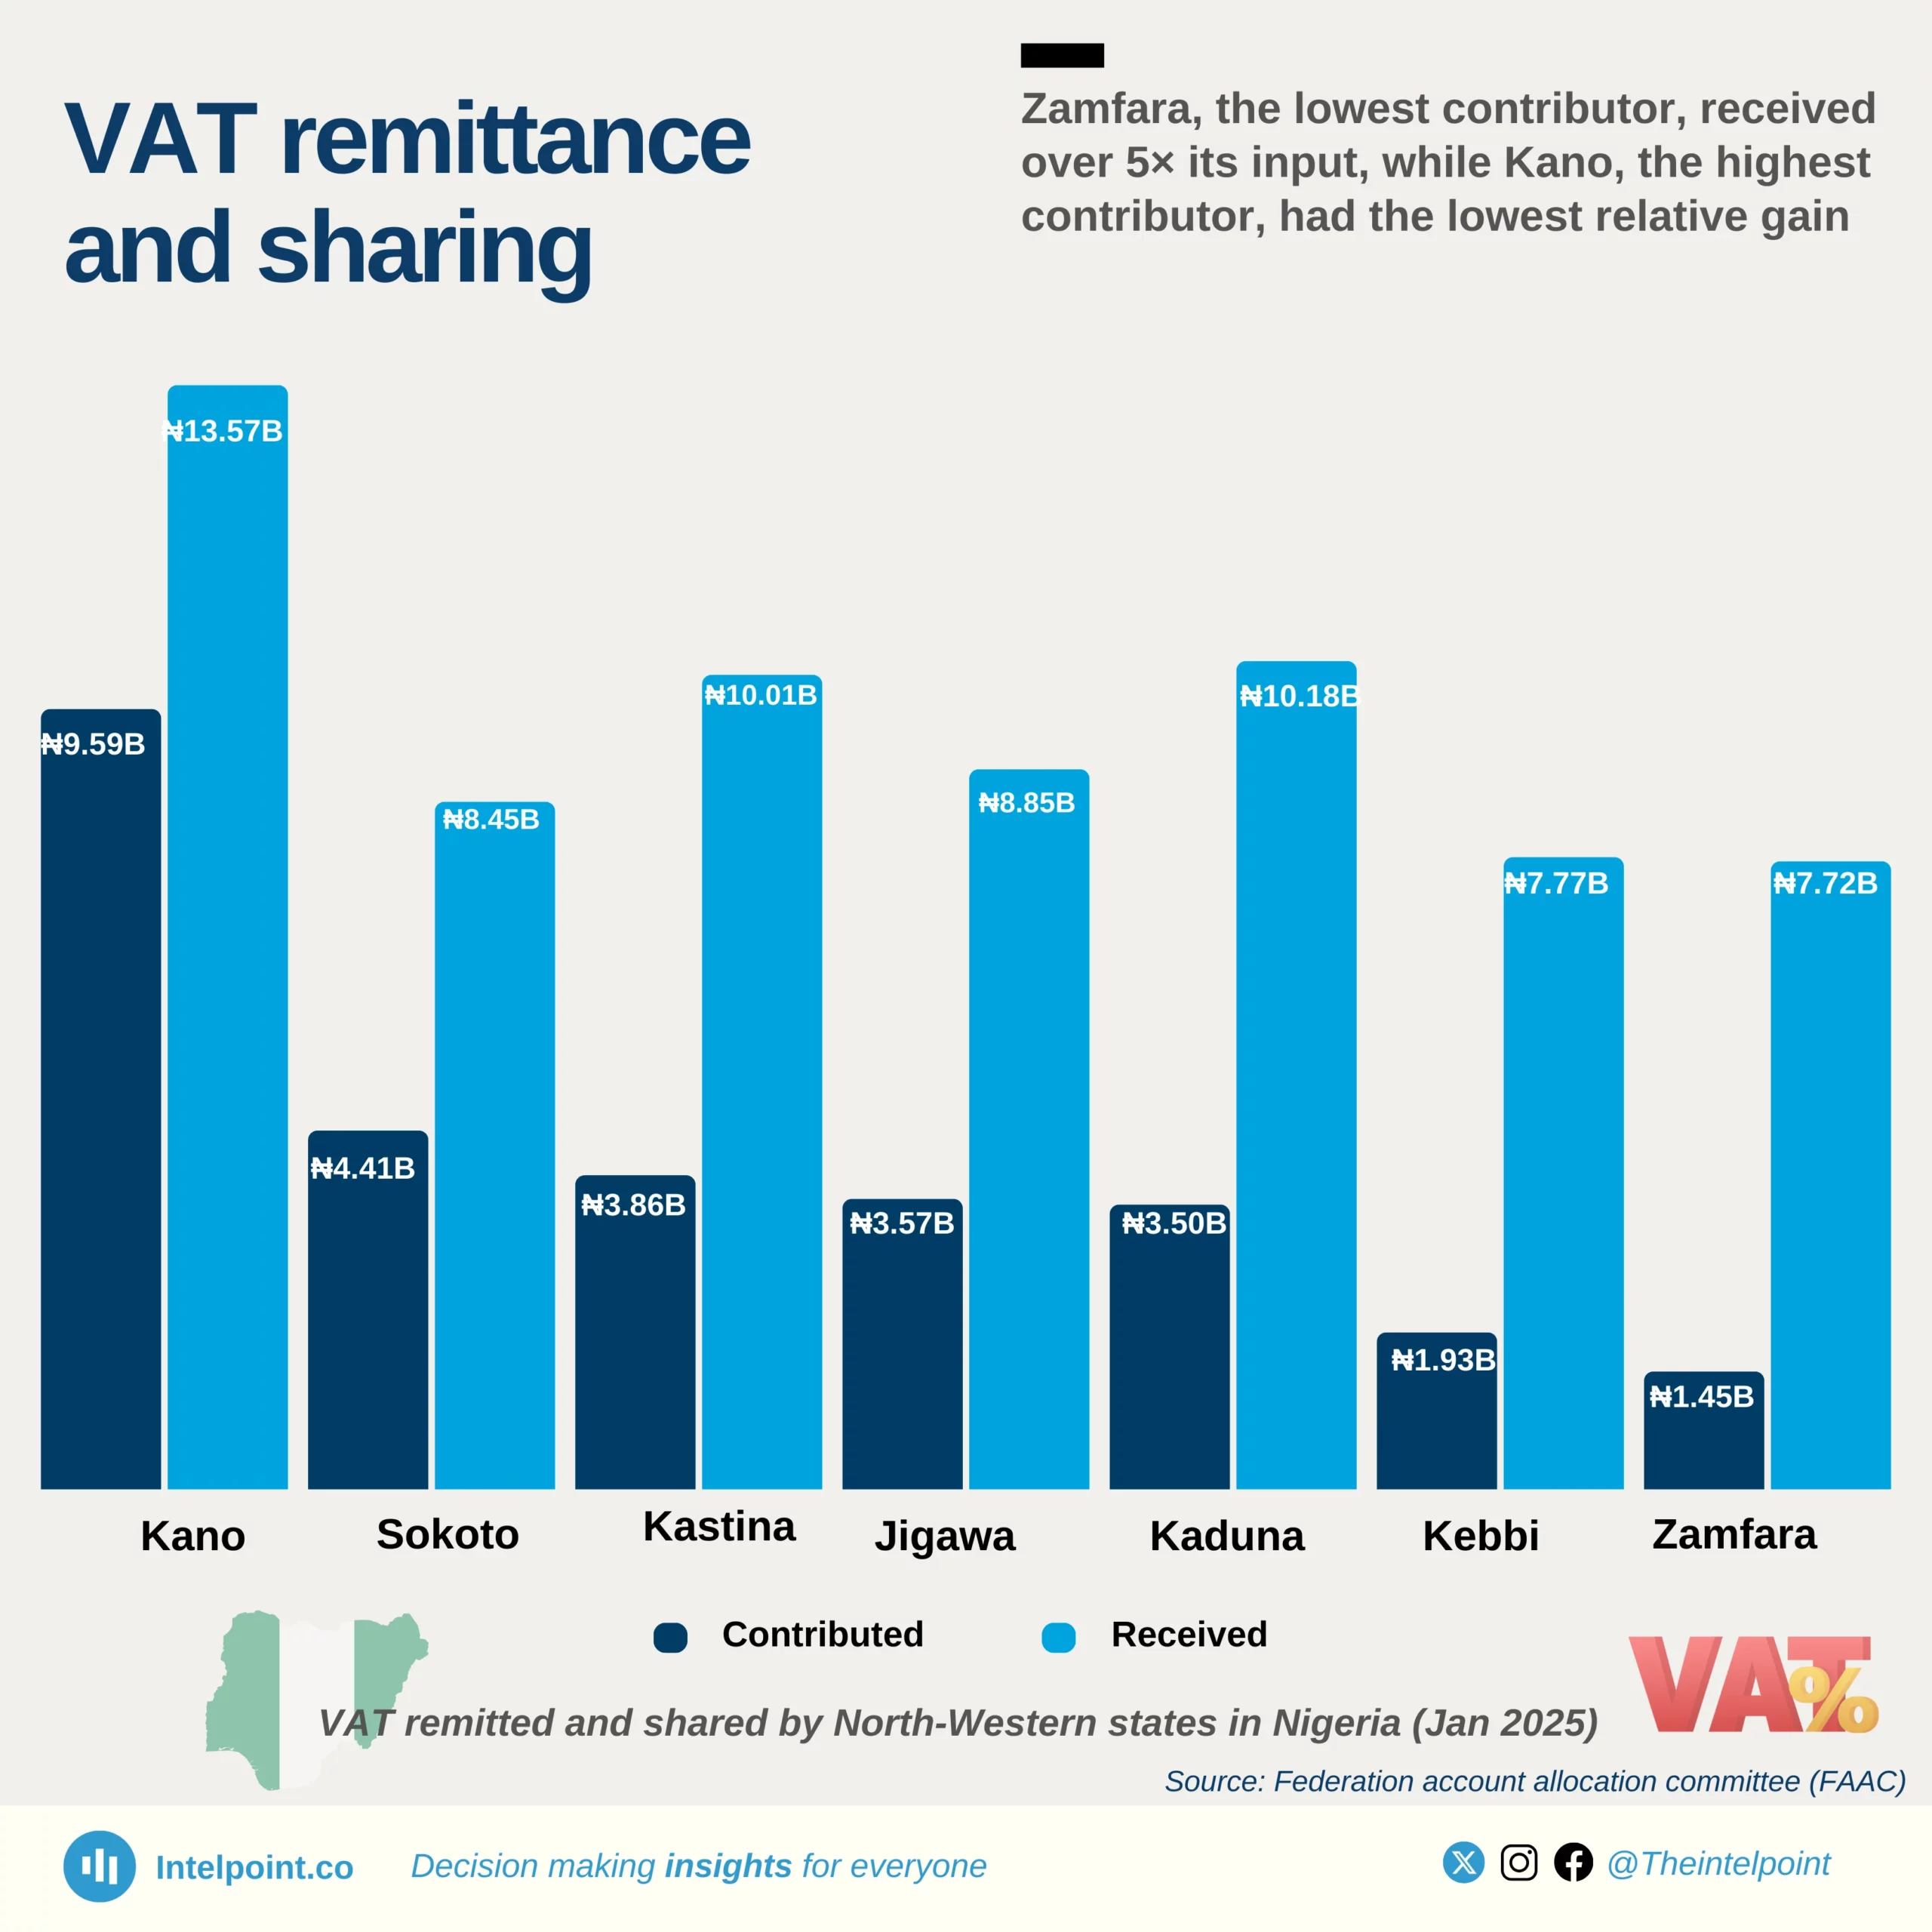
The VAT distribution in the North-West geopolitical zone of Nigeria highlights a major fiscal imbalance, where states receive far more than they remitted. The region generated ₦28.31 billion in VAT but received ₦66.55 billion, a 135% increase, showing a system where VAT is redistributed to ensure financial balance across states.

Kano, the economic powerhouse of the region, remitted ₦9.59 billion, accounting for 34% of the zone’s total VAT. Yet, it received only ₦13.57 billion, a 41.5% increase. This is the lowest percentage gain in the region, despite Kano being the highest revenue-generating state. In contrast, Zamfara, the lowest contributor at ₦1.45 billion, received ₦7.72 billion, an astonishing 5.3× its remittance (+433%), the highest relative gain in the zone.

Similarly, Kaduna (₦3.50B → ₦10.18B) and Katsina (₦3.86B → ₦10.01B) nearly tripled their VAT remittance in allocation, further emphasising the redistribution formula. The entire region received ₦2.35 for every ₦1 it contributed, confirming that VAT sharing favours equalisation over economic output.

Source:

Federal account allocation committee (FAAC)

Period:

January 2025
HTML code to embed chart
Want a bespoke report?
Reach out
Tags
Related Insights

Road accidents in Nigeria (Q3 2020-Q3 2024)
  • Road accidents declined by 53% between Q3 2020 and Q3 2024.
  • Q4 2022 recorded the highest number of accidents, with 4,835 reported cases.
  • Q3 2024 had the lowest number, with just 1,945 accidents.
  • Speed violation remains the leading cause of road accidents in Nigeria.
  • Ogun, FCT, Kaduna, and Nasarawa consistently rank among the top four states with the highest accident occurrences.
  • Bayelsa, Borno, Imo, Rivers, and Akwa Ibom regularly report the lowest number of accidents each quarter.
  • Commercial vehicles are the most frequently involved vehicle category in accidents.
  • Cars account for the highest number of individual vehicle accidents.

Top 10 Nigerian states with the highest number of road accidents (Cumulative, Q3 2020-Q3 2024)
  • The Federal Capital territory (FCT) recorded the highest number of road accidents between Q3 2020 and Q3 2024, with a total of 8,133 accidents, accounting for 12.42% of total accidents.
  • FCT, Ogun, Nasarawa, and Kaduna consistently ranked among the top four states with the highest accident occurrences.
  • Bayelsa, Borno, Akwa Ibom, Rivers, and Imo were among the states with the lowest number of recorded accidents each quarter.

After its peak ($8.9b) in 2011, Nigeria's FDI declined almost every year to its lowest ($780m) in 2018, a 91% decline
  • FDI inflows peaked in 2011 at $8.91 billion, the highest in the 35-year period.
  • Between 2005 and 2012, Nigeria saw a sustained boom in FDI, with seven consecutive years above $4 billion.
  • In 2018, Nigeria recorded its lowest FDI inflow in decades at just $0.78 billion.
  • By 2024, FDI stood at $1.08 billion, down 88% from its 2011 peak, reflecting declining investor interest or changing investment climates.

The South West got ₦1 back for every ₦3.60 in VAT, while the North West received ₦2.60 for every ₦1 contributed
  • The South West generated ₦929.86B, over half of Nigeria’s total VAT, but received only ₦258.19B, amounting to ₦1 back for every ₦3.60 contributed.
  • The North West contributed just ₦68.05B but received ₦176.73B, meaning it got back ₦2.60 for every ₦1 generated.
  • The South South, the second-highest contributor at ₦364.99B, got back ₦171.18B, just ₦1 for every ₦2.13 generated.
  • The three southern zones together contributed ₦1.32 trillion in VAT, nearly 90% of the national total, but received less than half of it back.
  • Zones with the lowest generation (North East and South East) received 3 to 4 times their contributions.

Lagos generated ₦819.6 billion in VAT in Q1 2025, nearly triple Rivers and more than 10 times any other state
  • Lagos led the nation with ₦819.62B VAT, over 45% of the total generated by all 36 states combined.
  • Rivers followed distantly with ₦278.23B, around 34% of Lagos’s VAT haul.
  • Only five states (Lagos, Rivers, Oyo, Bayelsa, Kano) generated over ₦21B in Q1 2025.
  • 22 states generated below ₦10B, with 13 of them earning less than ₦6B in VAT.
  • Northern states like Katsina (₦5.96B), Yobe (₦5.81B), and Kebbi (₦5.13B) trail significantly in VAT contributions.
  • Abia, Cross River, Imo, and Taraba sit at the bottom, each with under ₦3B in VAT returns.

2025 sees unprecedented surge as 17,000 candidates score above 300 in JAMB; highest in 13 years
  • No candidate scored above 300 until 2015, with just 40 high scorers that year out of over 1.46 million candidates.
  • 2025 marked the highest ever with 17,025 candidates scoring above 300, nearly double the count in 2024 and more than triple 2023.
  • From 2022 to 2025, above-300 scorers consistently remained over 5,000 each year, showing a steady rise in top scores.
  • Despite the growth in numbers of JAMB candidates, high scorers still make up less than 1% annually.

POPULAR TOPICS
SIGN UP TO OUR NEWSLETTER
Get periodic updates about the African startup space, access to our reports, among others.
Subscribe Here
Subscription Form

A product of Techpoint Africa. All rights reserved