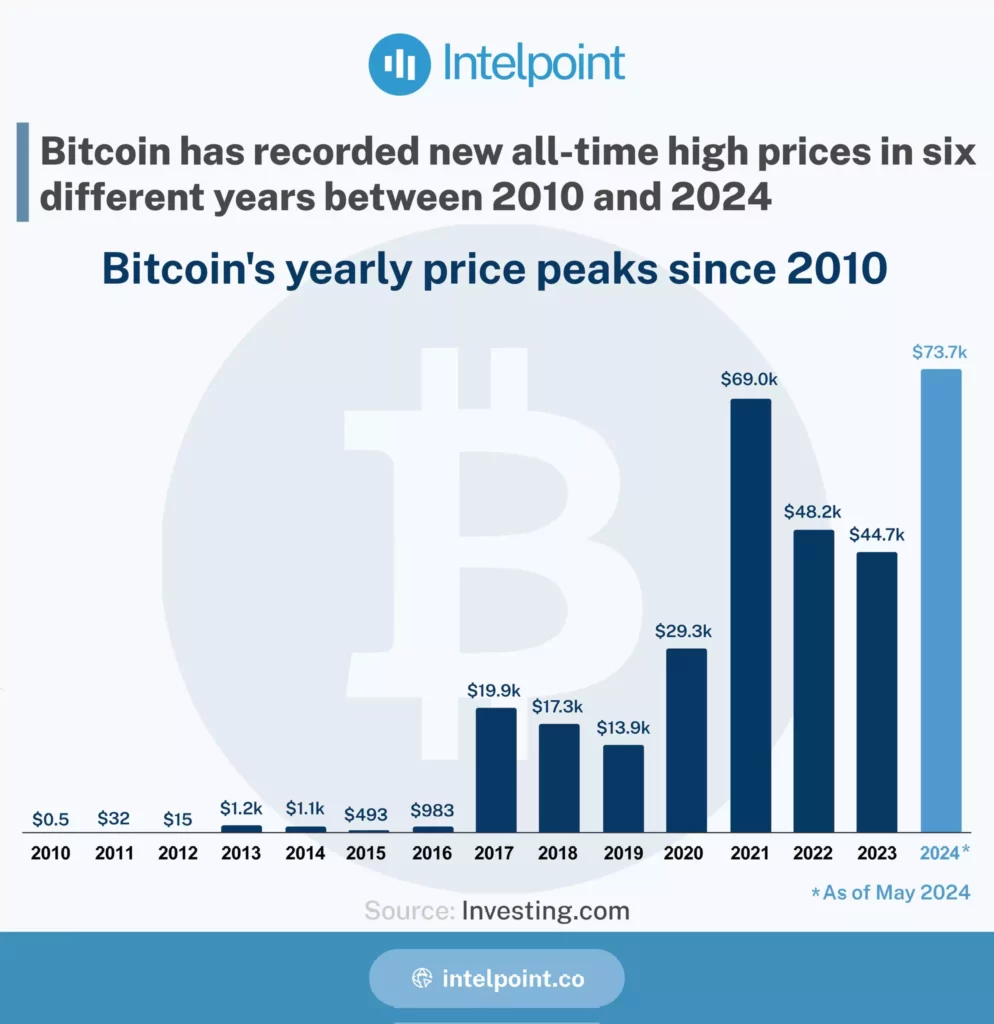
Bitcoin has seen remarkable growth since 2010. Starting from a high of just $0.5 in 2010, it reached an all-time high of $73.7k in March 2024.
It recorded new peaks in 2011, 2013, 2017, 2020, 2021, and recently in 2024.


The 2024 Global Peace Index reveals a decline in peacefulness in 97 countries, the highest since the index began.
Nigeria is among the nations affected by regional conflicts and rising violence. With a peace index score of 2.91, Nigeria is facing increasing challenges.
A deteriorating peace score impacts foreign investment and economic stability. Global economic losses due to violence reached $19.1 trillion in 2023.

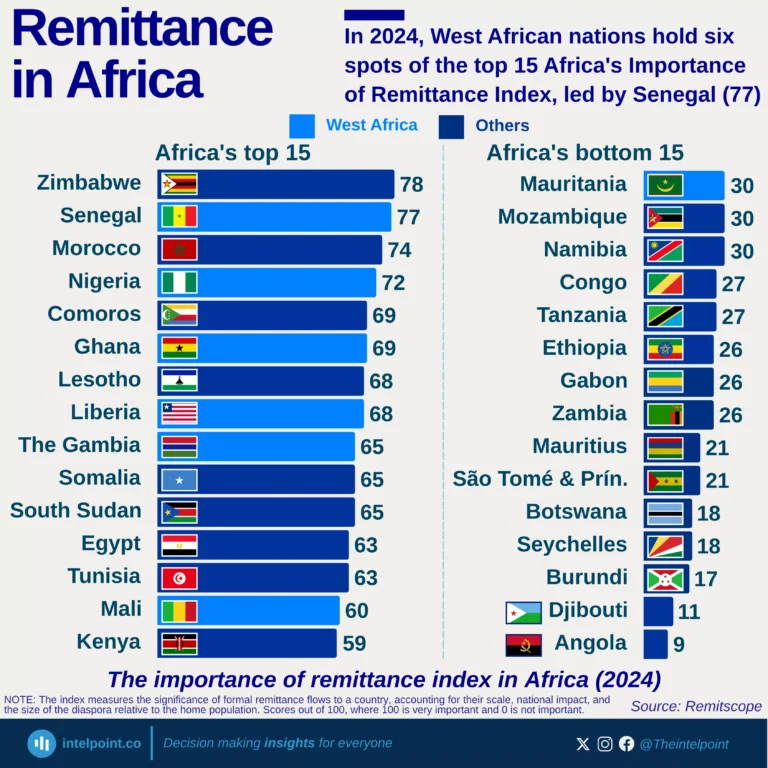
Between 2018 and 2021, adult literacy rates across African nations exhibited significant disparities. Seychelles and South Africa led with literacy rates of 96% and 95%, respectively, indicating a high proportion of literate adults. Conversely, Chad had the lowest literacy rate during this period.
These statistics underscore the uneven progress in educational attainment across Africa, highlighting the need for targeted interventions to improve literacy in lower-performing nations.

Nigeria was the seventh most populous nation in the world in 2020, with 206.1 million people. Projected to reach a population of 401.3 million by 2050, Nigeria will rank third after India (1st) and China (2nd). According to Institut national d'études démographiques' projections, Nigeria, Ethiopia, DR Congo, Egypt, Tanzania, and Kenya will be among the world’s top 20 most populous countries by 2050.
The 2024 Global Peace Index reveals a decline in peacefulness in 97 countries, the highest since the index began.
Nigeria is among the nations affected by regional conflicts and rising violence. With a peace index score of 2.91, Nigeria is facing increasing challenges.
A deteriorating peace score impacts foreign investment and economic stability. Global economic losses due to violence reached $19.1 trillion in 2023.
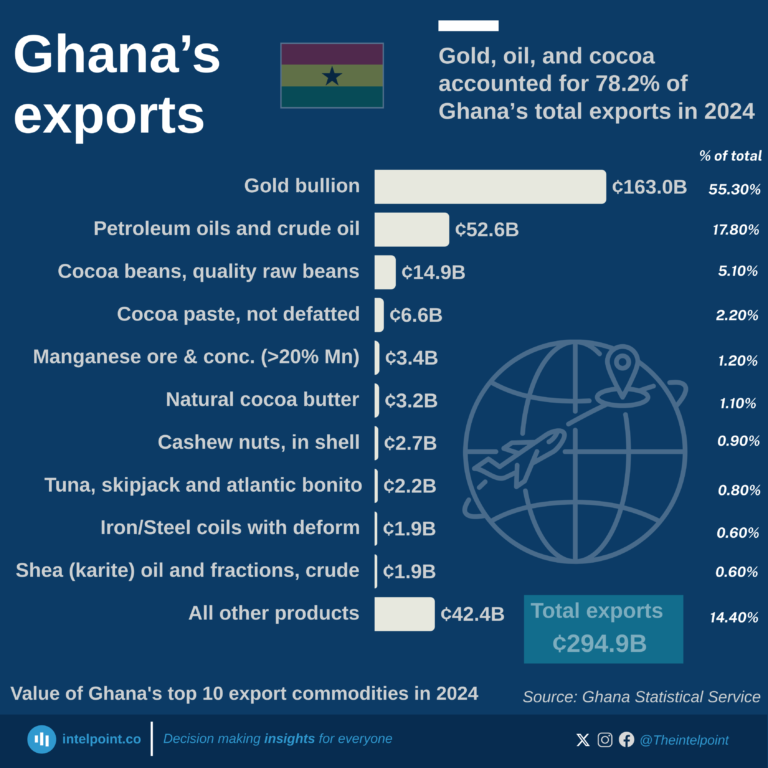
Gold bullion dominates exports, contributing ¢163.0B (55.3%) of total exports.
Petroleum oils follow distantly at ¢52.6B (17.8%).
Cocoa (beans, paste, butter) remains a vital sector, collectively worth ¢24.7B (8.4%).
Manganese, cashew, tuna, iron/steel, and shea oil are niche contributors, each under 2% of exports.
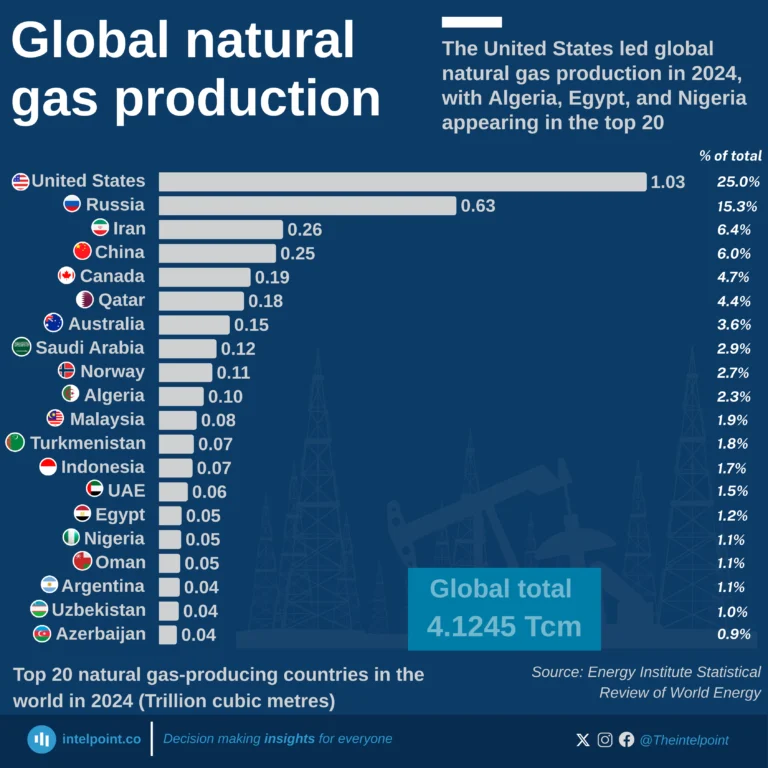
The United States dominates global natural gas production in 2024, contributing 1.03 trillion cubic metres (Tcm), nearly one-quarter of the world’s total.
Russia (0.63Tcm) and Iran (0.26Tcm) follow as the second and third largest producers.
China (0.25Tcm) and Canada (0.19Tcm) also feature strongly, rounding out the top five producers.
Collectively, these top five countries account for more than 50% of global production.
Emerging producers like Nigeria, Egypt, and Azerbaijan contribute significantly to the supply but remain far behind the leading nations.
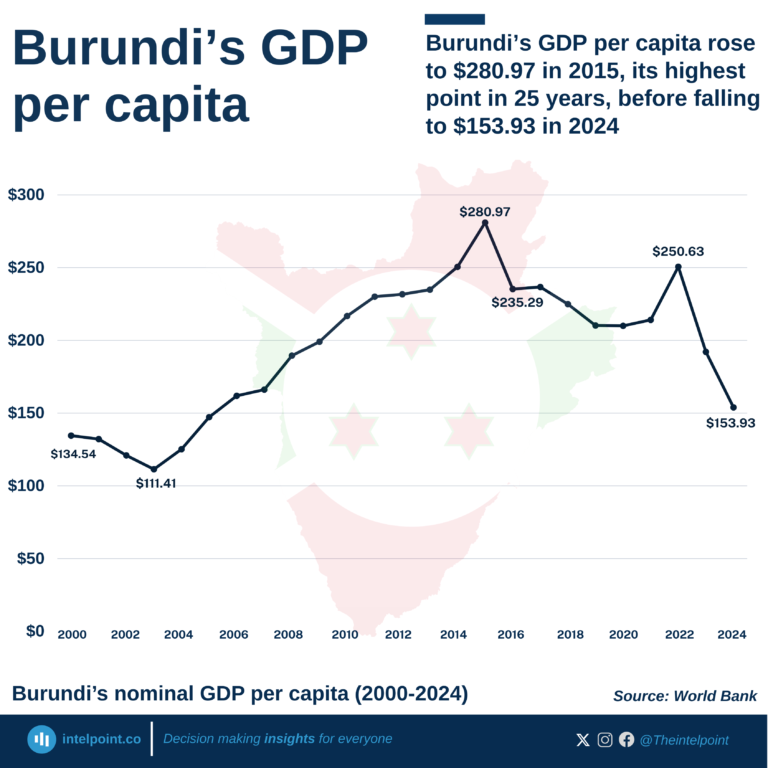
Burundi recorded its highest GDP per capita in 2015 ($280.97).
By 2024, GDP per capita dropped to $153.93, a decline of nearly 45% from its peak.
Burundi’s population exceeds 13 million (2024), which dilutes income per person even when overall GDP grows.
Structural challenges like limited industrialization, reliance on subsistence farming, and political instability contribute to stagnation.
Since 2015, Burundi has held the lowest GDP per capita in Africa—and at $153.9 in 2024, it is the poorest country in the world by GDP per capita.