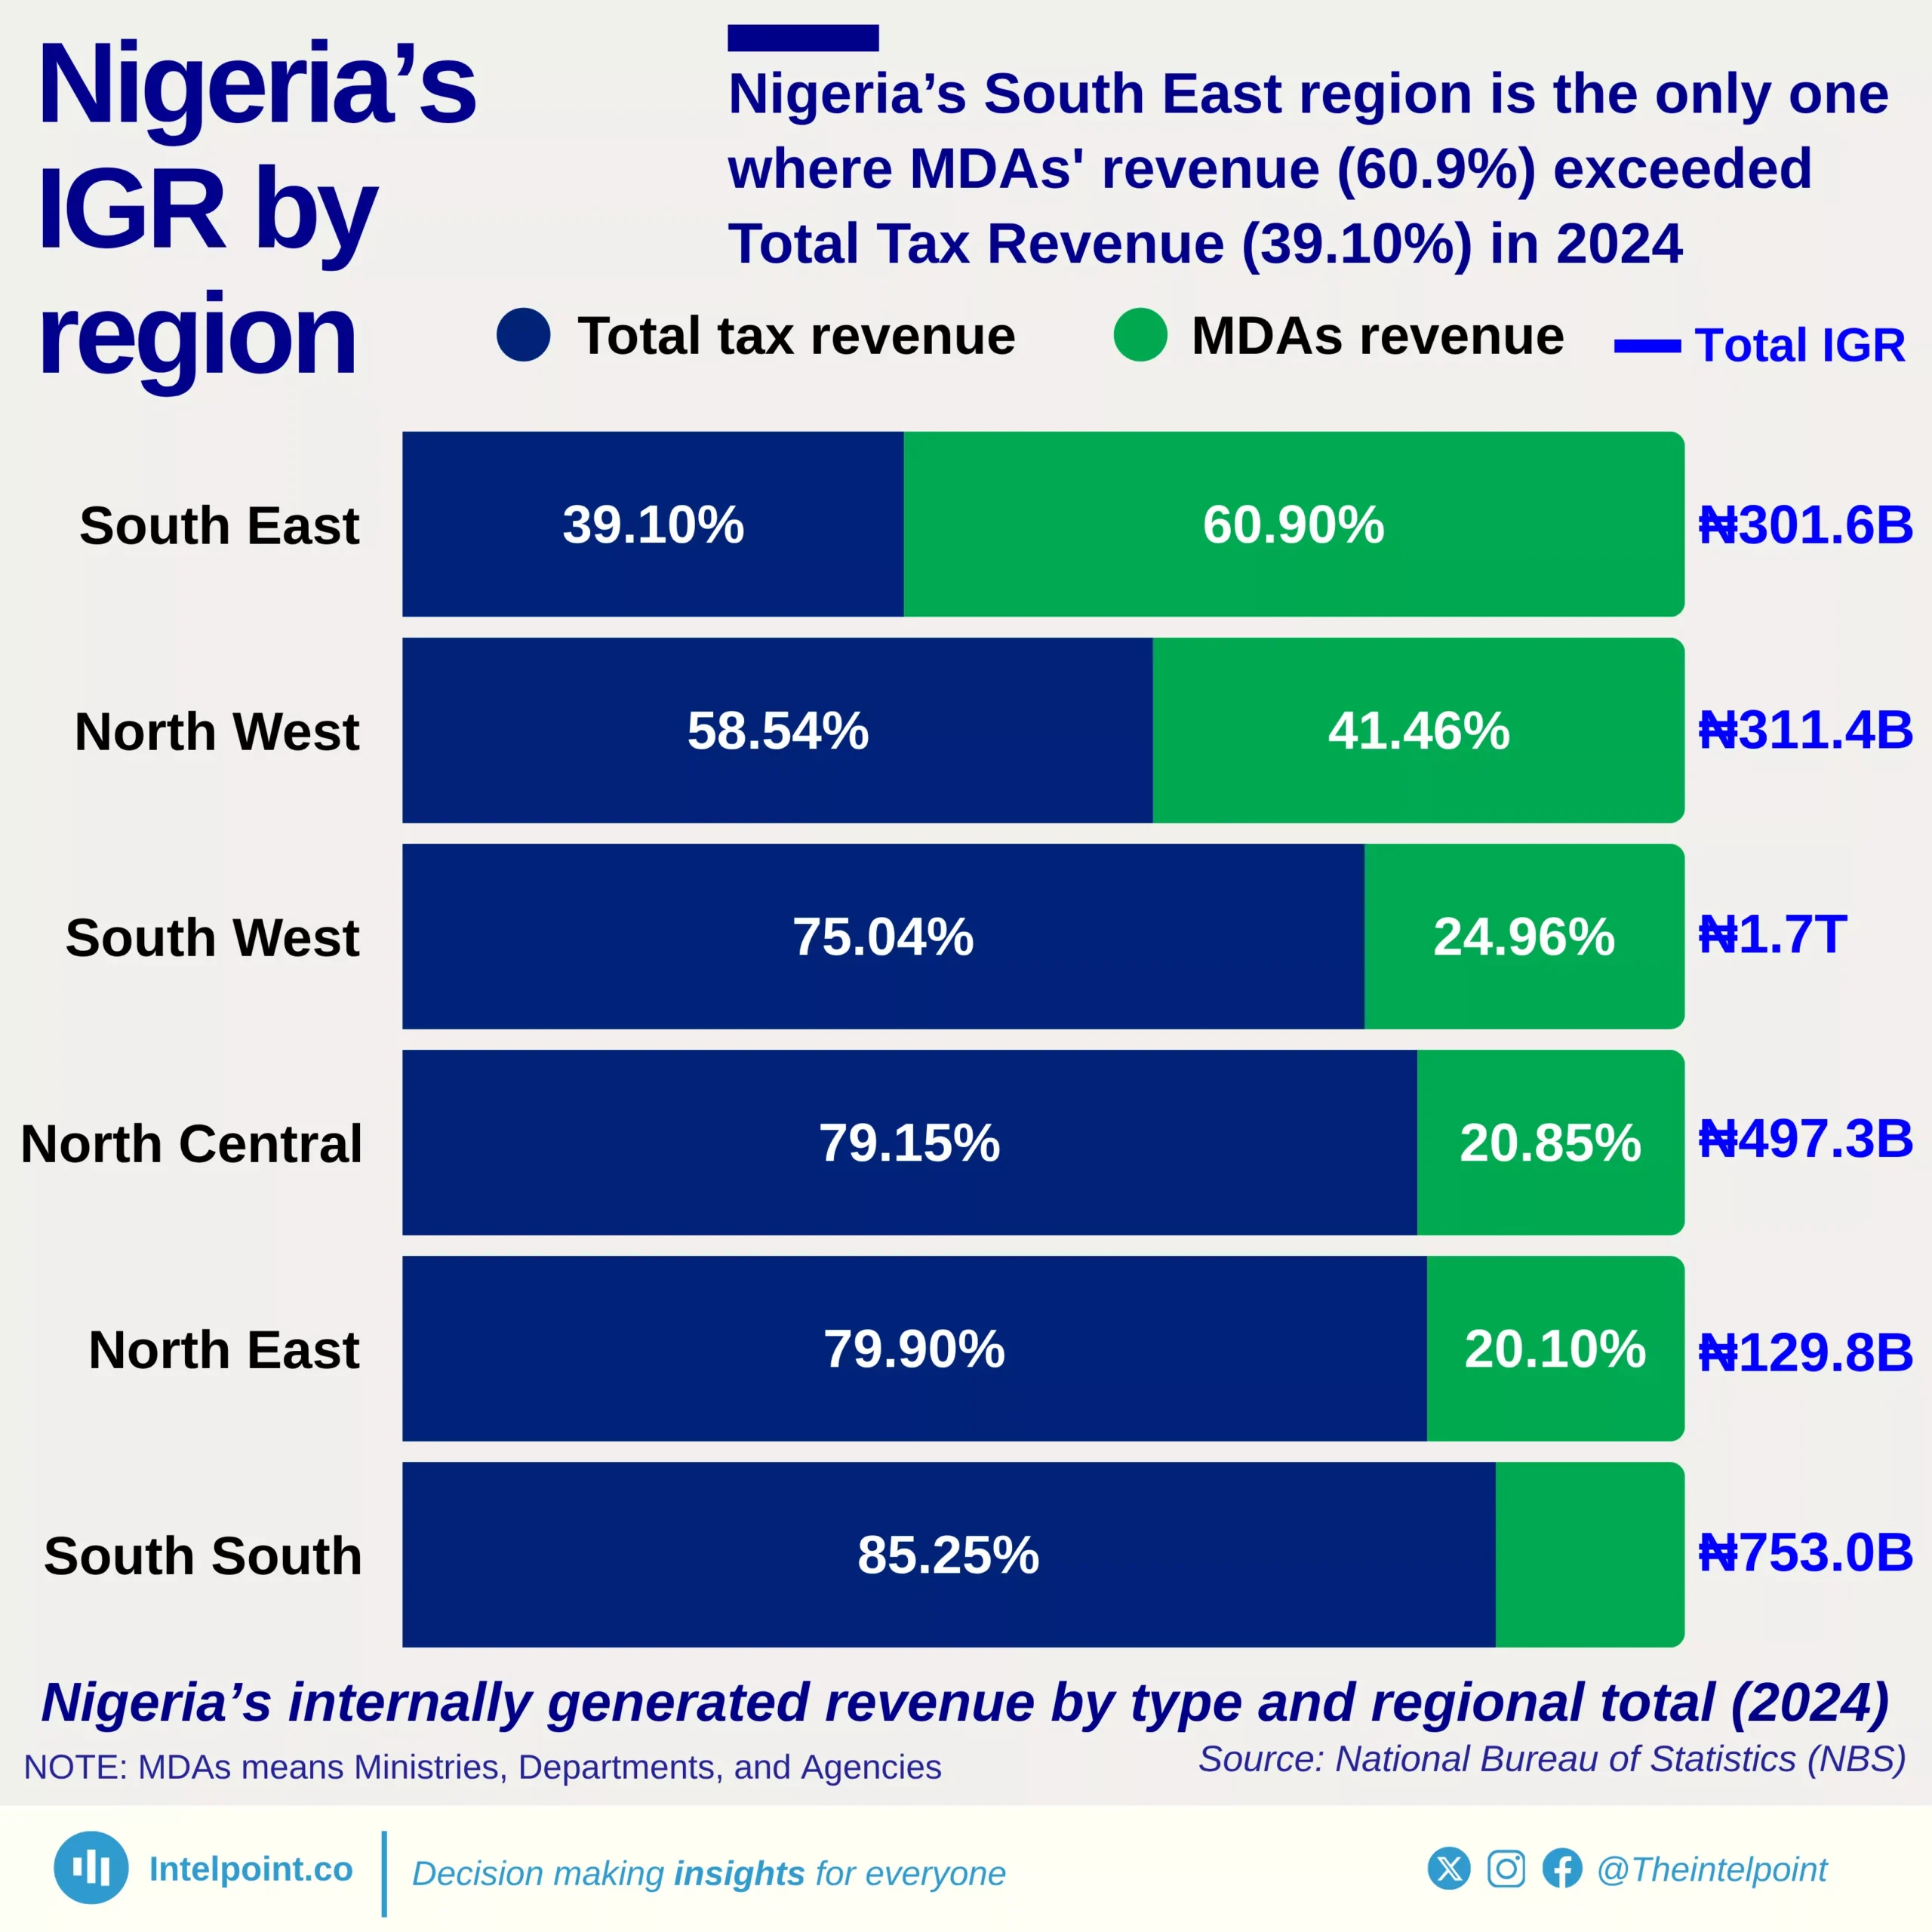
Nigeria’s South East region is the only one where MDAs' revenue (60.9%) exceeded Total Tax Revenue (39.10%) in 2024

  • The South East is the only region where the revenue of MDAs (60.9%) exceeded tax revenue (39.1%).
  • Other regions relied more heavily on tax revenue, with the South South leading at 85.25%.
  • The North East and North Central followed closely, with tax contributions of 79.9% and 79.15%, respectively.
  • The South West generated 75.04% of its IGR from taxes, indicating a strong formal revenue structure.
  • The North West maintained a more balanced mix, with 58.54% tax and 41.46% MDAs’ revenue.

Nigeria’s South East region stood out in 2024 as the only region where Ministries, Departments, and Agencies (MDAs) generated more internally generated revenue (IGR) than total tax revenue. According to data from the National Bureau of Statistics, MDAs’ revenue accounted for 60.9% of the South East’s total IGR, compared to 39.1% from taxes. This unusual revenue structure highlights how administrative and institutional earnings—such as service charges, levies, and fees—play a larger role in the region’s fiscal composition than direct taxation.

Across the country, tax revenue remains the primary source of IGR. The South South recorded the highest reliance on tax revenue, with 85.25% of its IGR derived from taxes, reflecting its strong oil and corporate tax base. The North East (79.9%) and North Central (79.15%) regions also leaned heavily on tax receipts, while the South West followed with 75.04%.
Source:

National Bureau of Statistics

Period:

2024
HTML code to embed chart
Want a bespoke report?
Reach out
Tags
Related Insights

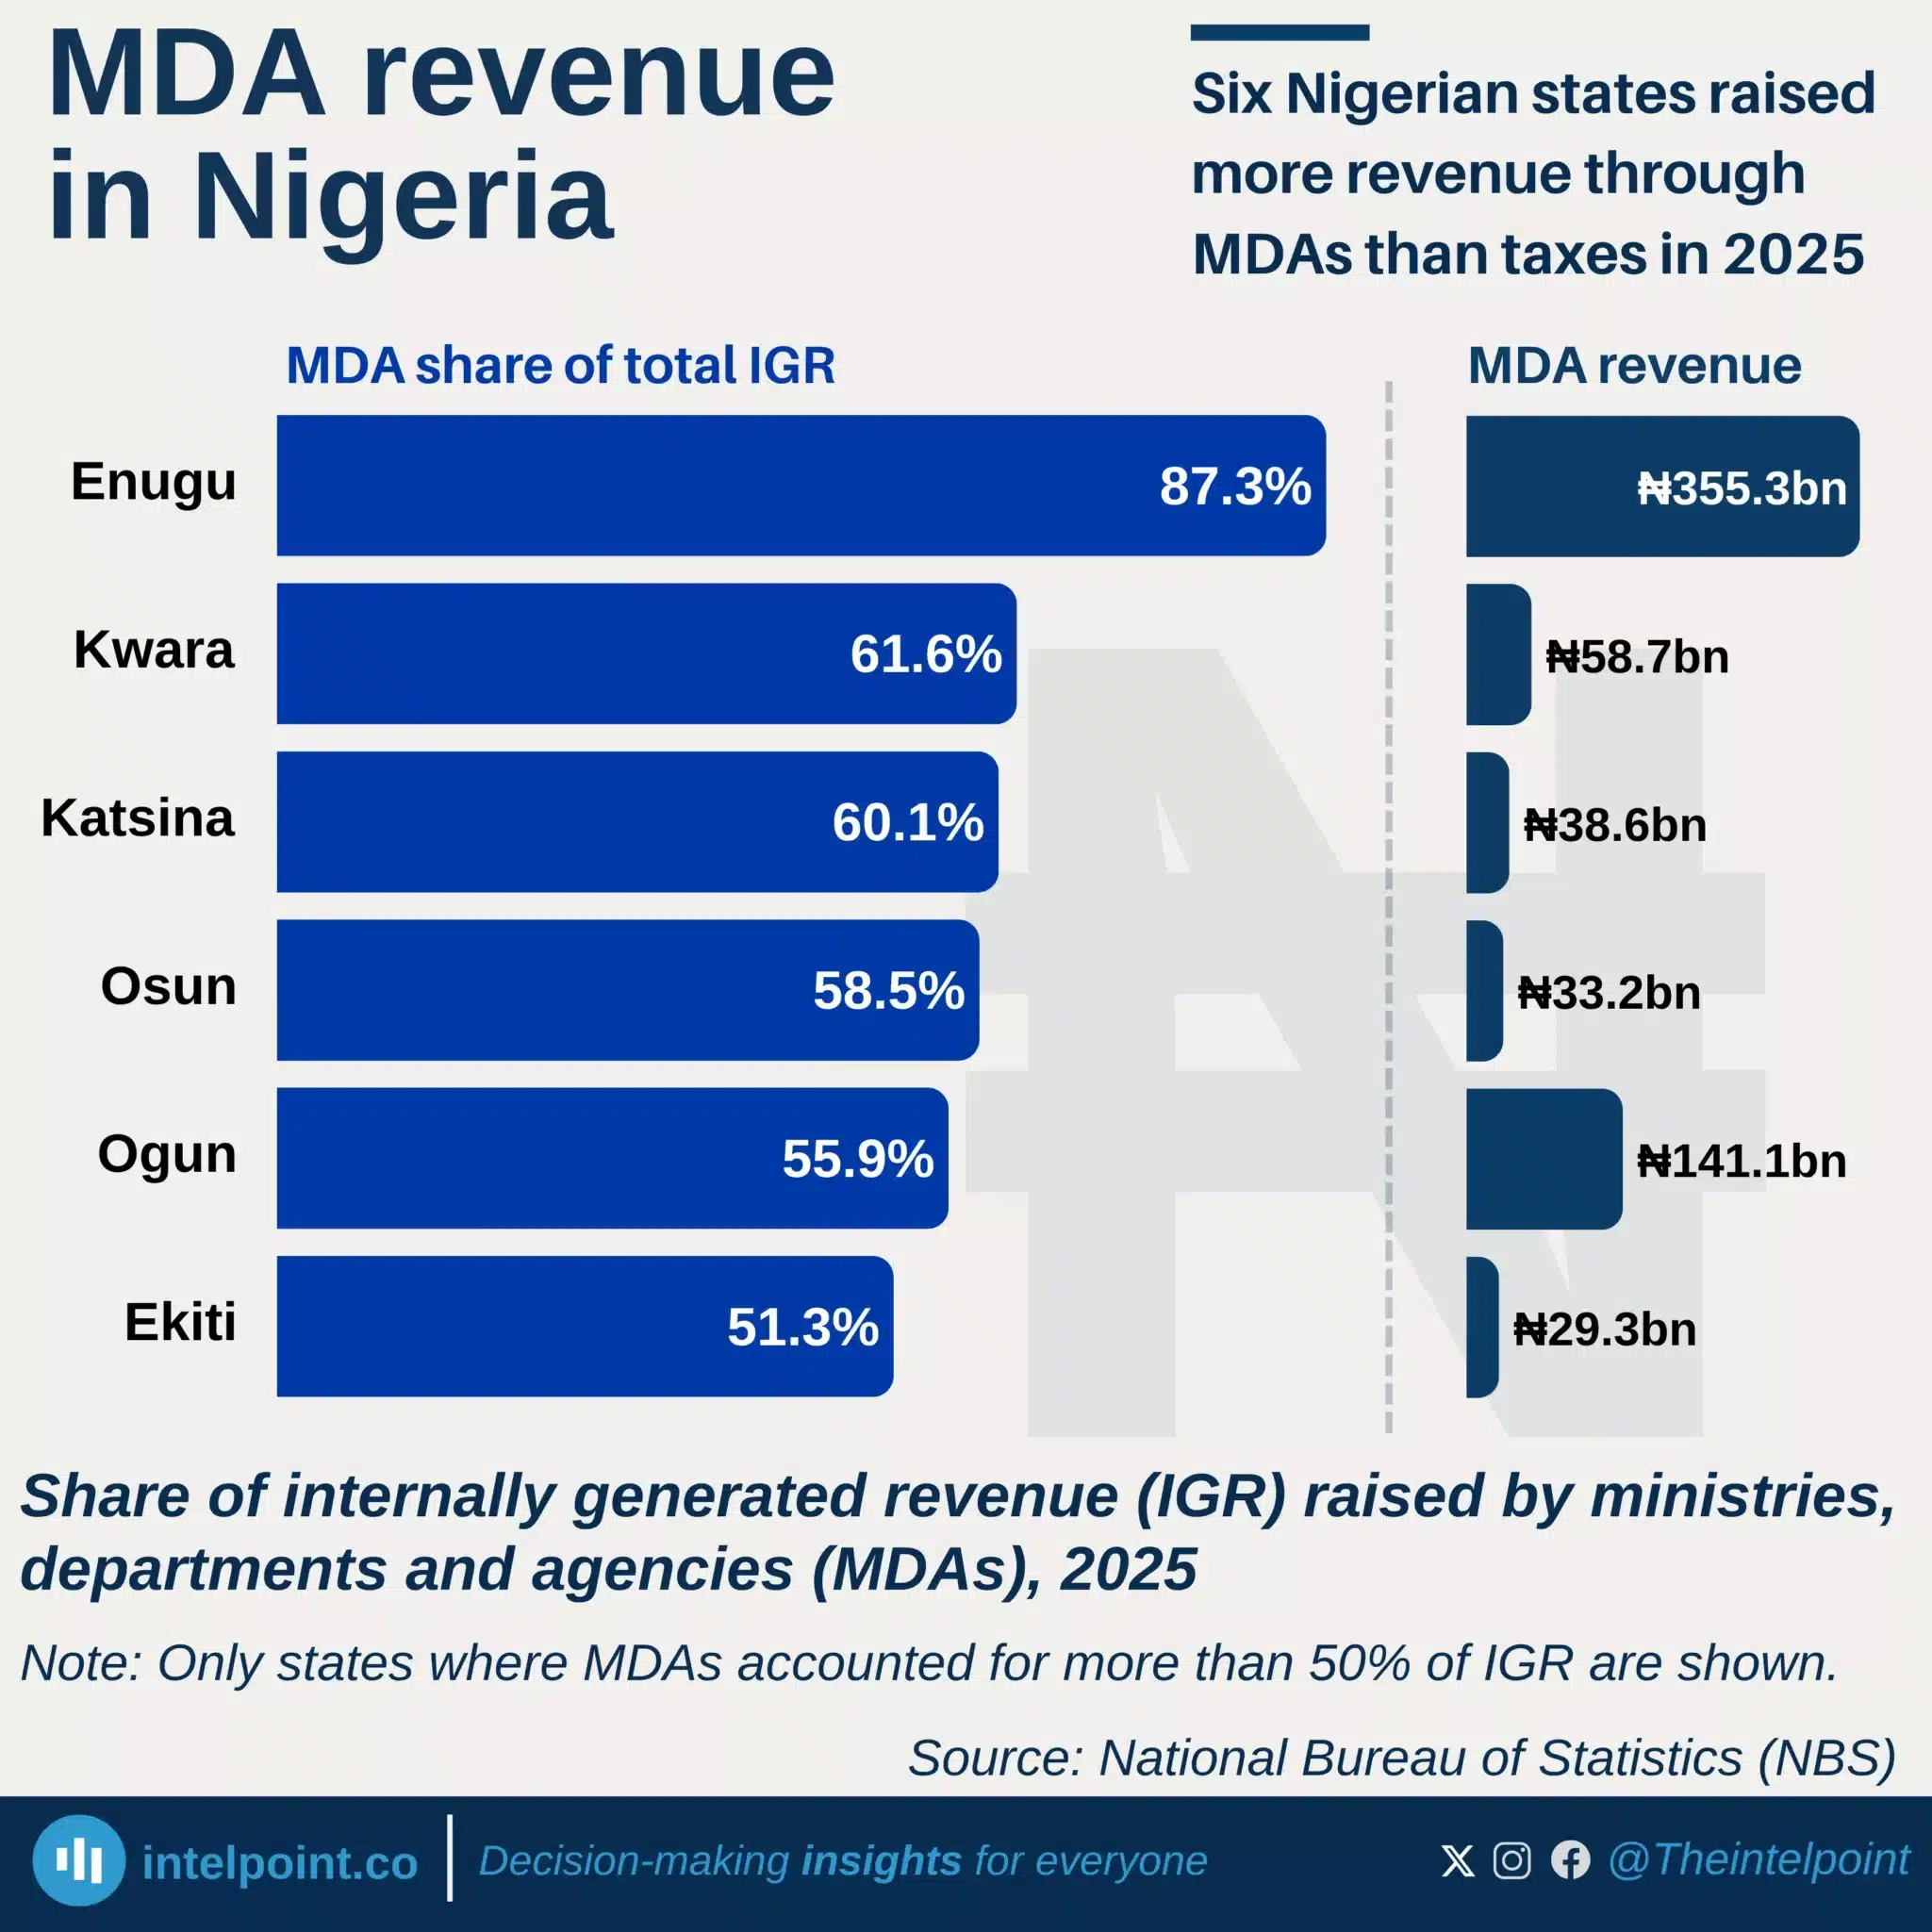
Six Nigerian states raised more revenue through MDAs than taxes in 2025
  • Six states generated about ₦656 billion through MDAs in 2025, nearly half of all MDA revenue.
  • The number of states where MDAs accounted for over half of IGR fell from seven in 2024 to six in 2025.
  • Enugu’s MDA share rose from 82.9% in 2024 to 87.3% in 2025, widening its lead.
  • Kwara, Katsina and Osun recorded MDA shares of 61.6%, 60.1% and 58.5%, respectively.

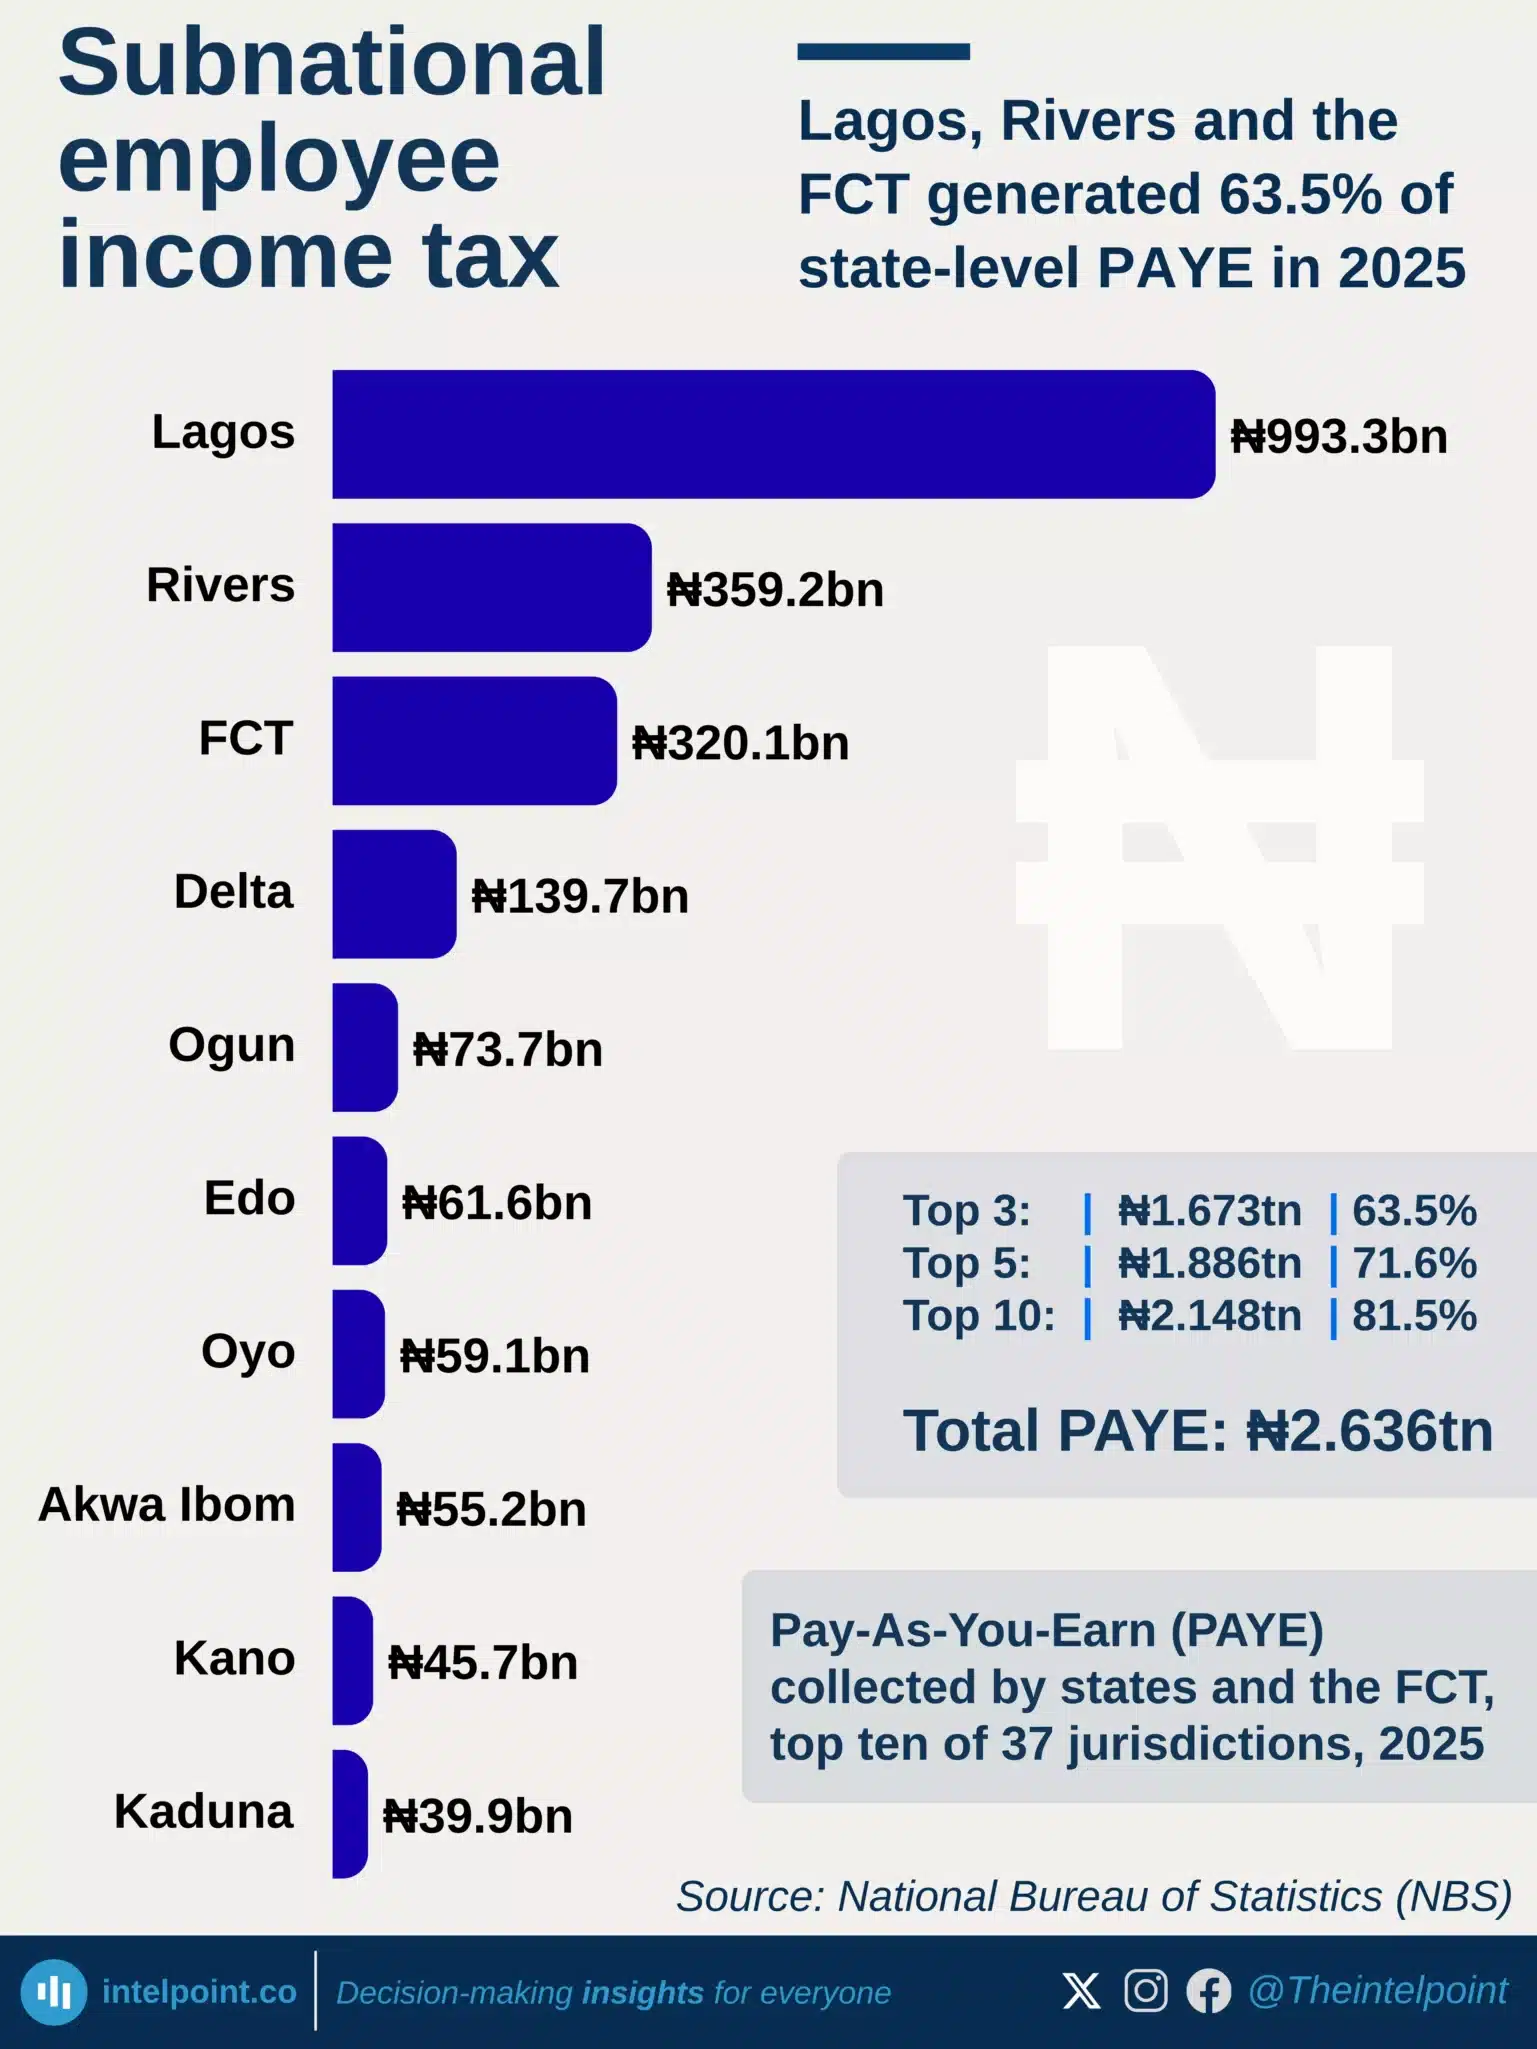
Lagos, Rivers and the FCT generated 63.5% of state-level PAYE in 2025
  • Lagos, Rivers and the FCT collected 63.5% of state-level PAYE in 2025.
  • Lagos collected ₦993.3 billion in PAYE, more than the next five jurisdictions combined.
  • The top 10 jurisdictions accounted for 81.5% of ₦2.636 trillion in total PAYE.
  • The bottom five jurisdictions collected ₦47.0 billion combined, less than 2% of the total.
  • Delta collected ₦139.7 billion, less than half of the FCT’s ₦320.1 billion.

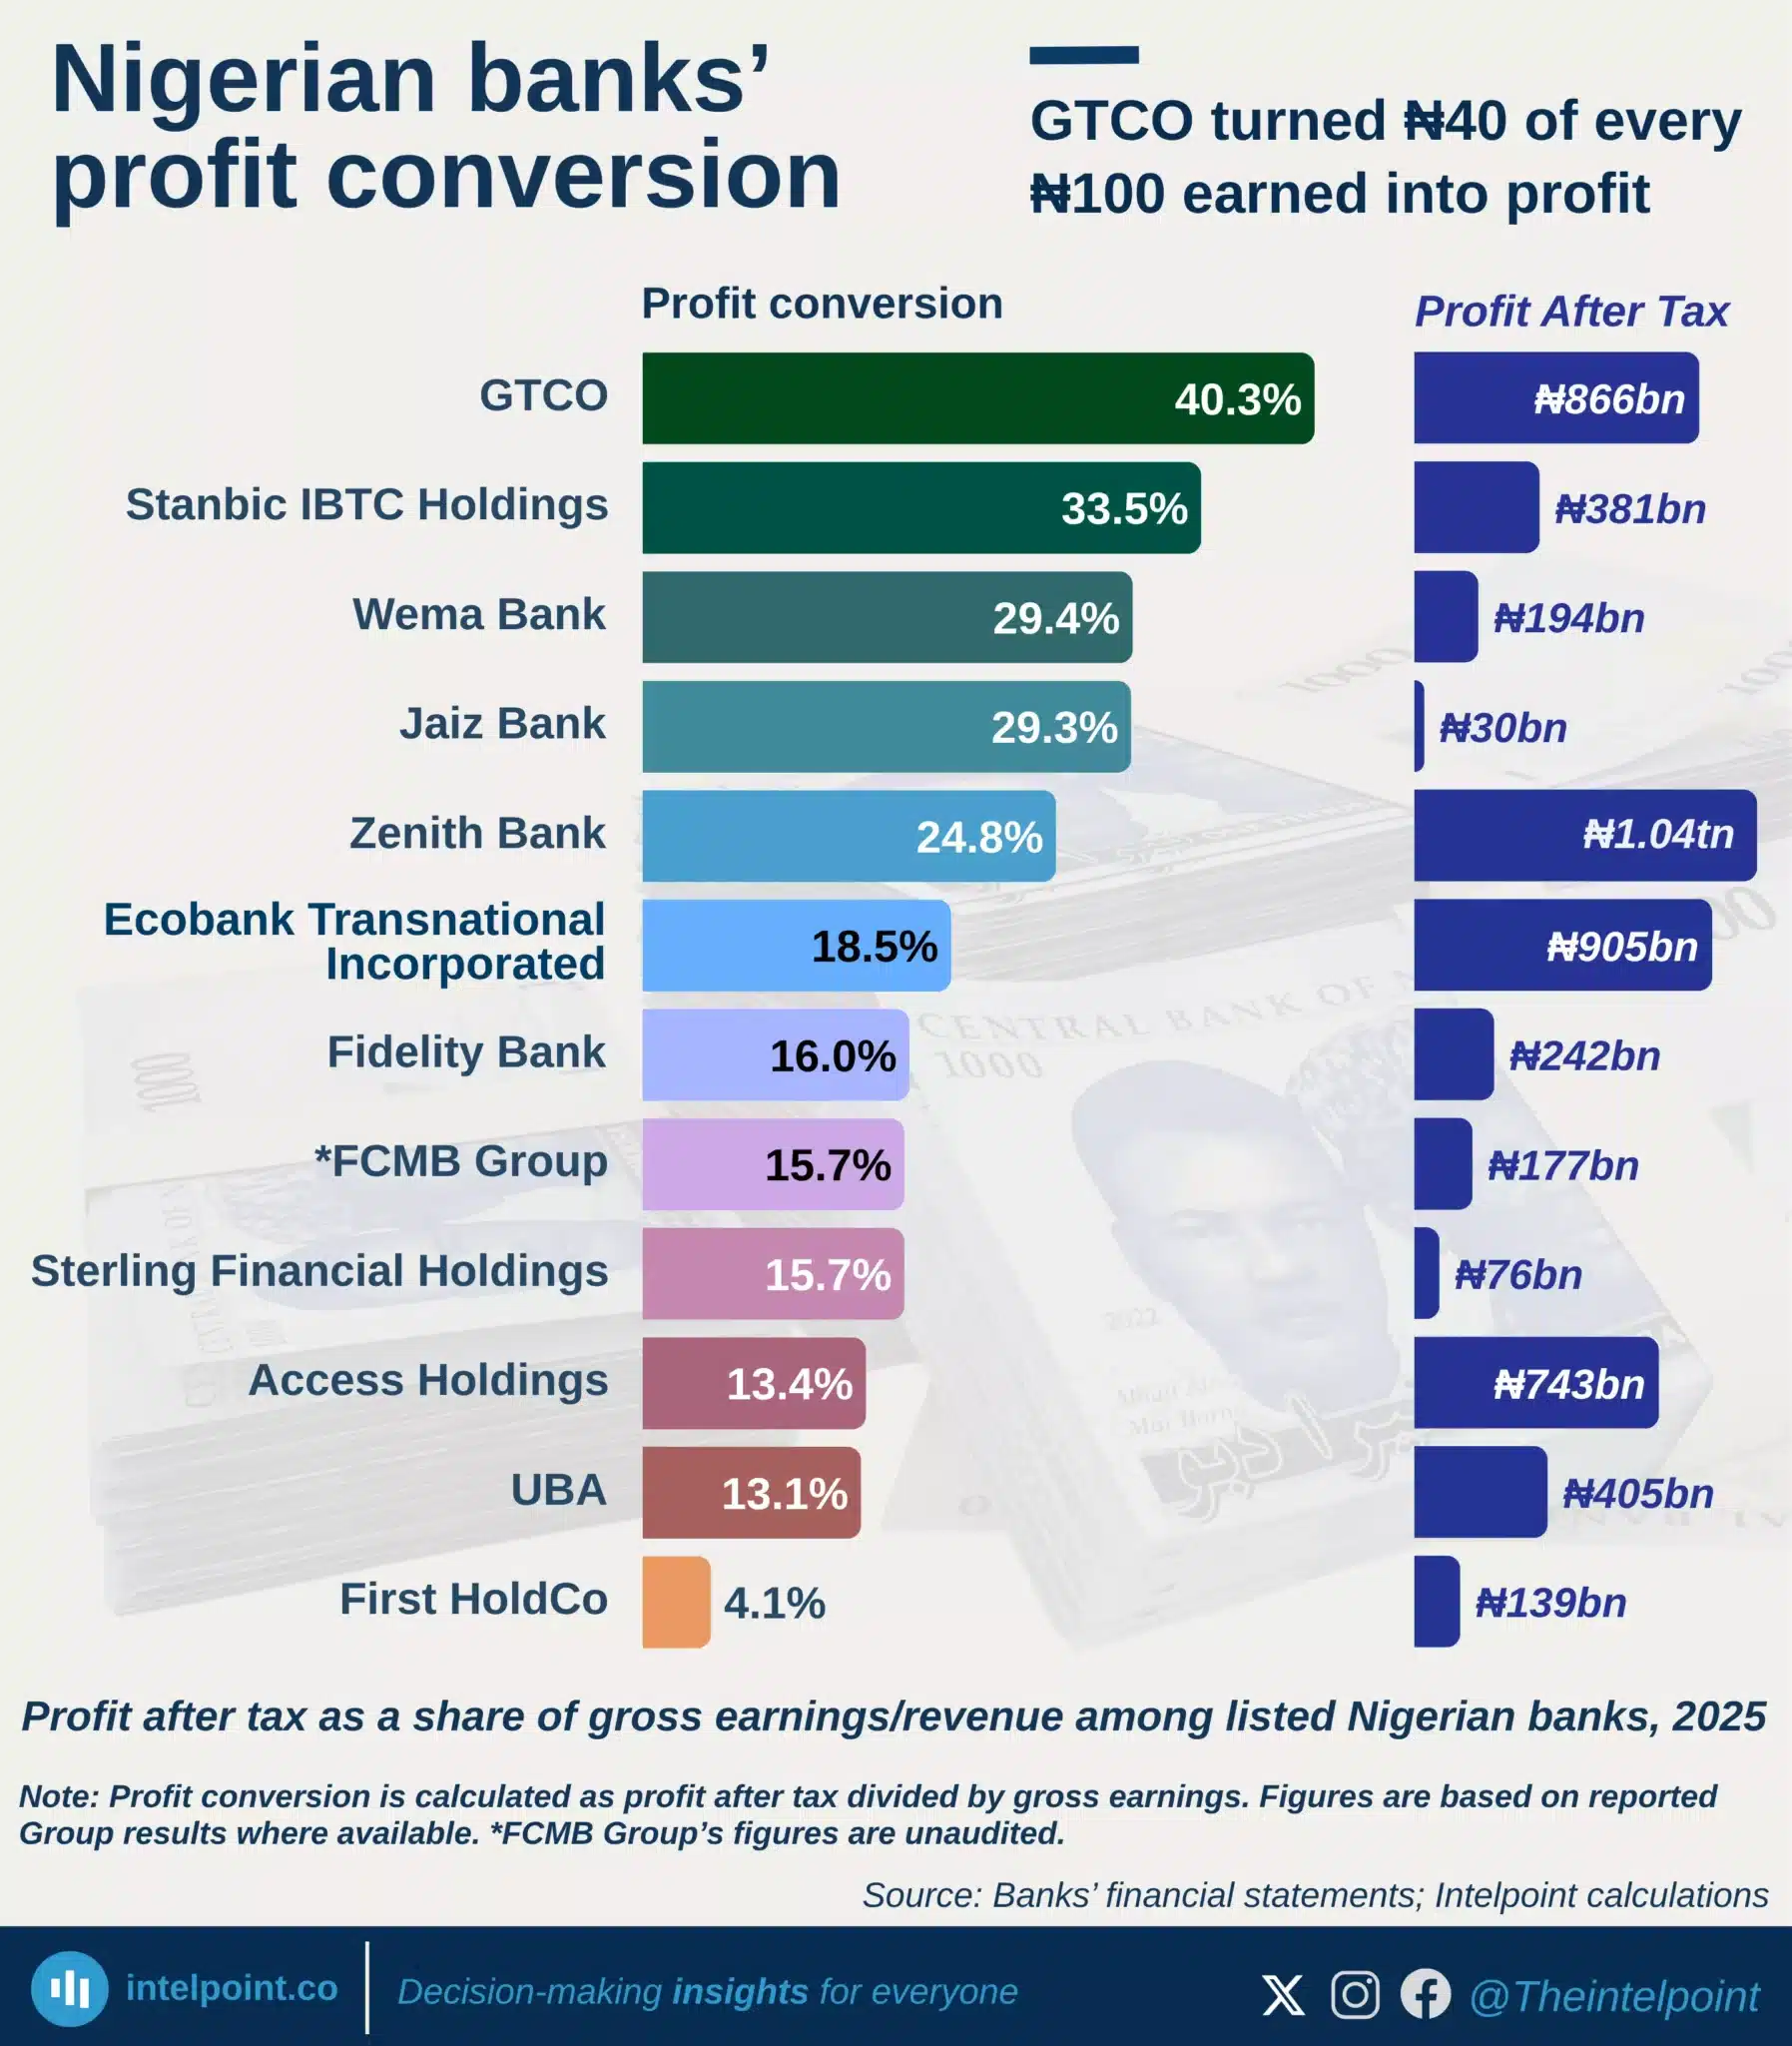
GTCO turned ₦40 of every ₦100 earned into profit
  • GTCO had the strongest profit conversion in 2025.
  • GTCO turned about ₦40 of every ₦100 earned into profit.
  • Stanbic IBTC followed with about ₦34 profit per ₦100 earned.
  • Zenith made the highest profit, but not the strongest conversion.
  • First HoldCo had the weakest profit conversion among the banks reviewed.
 

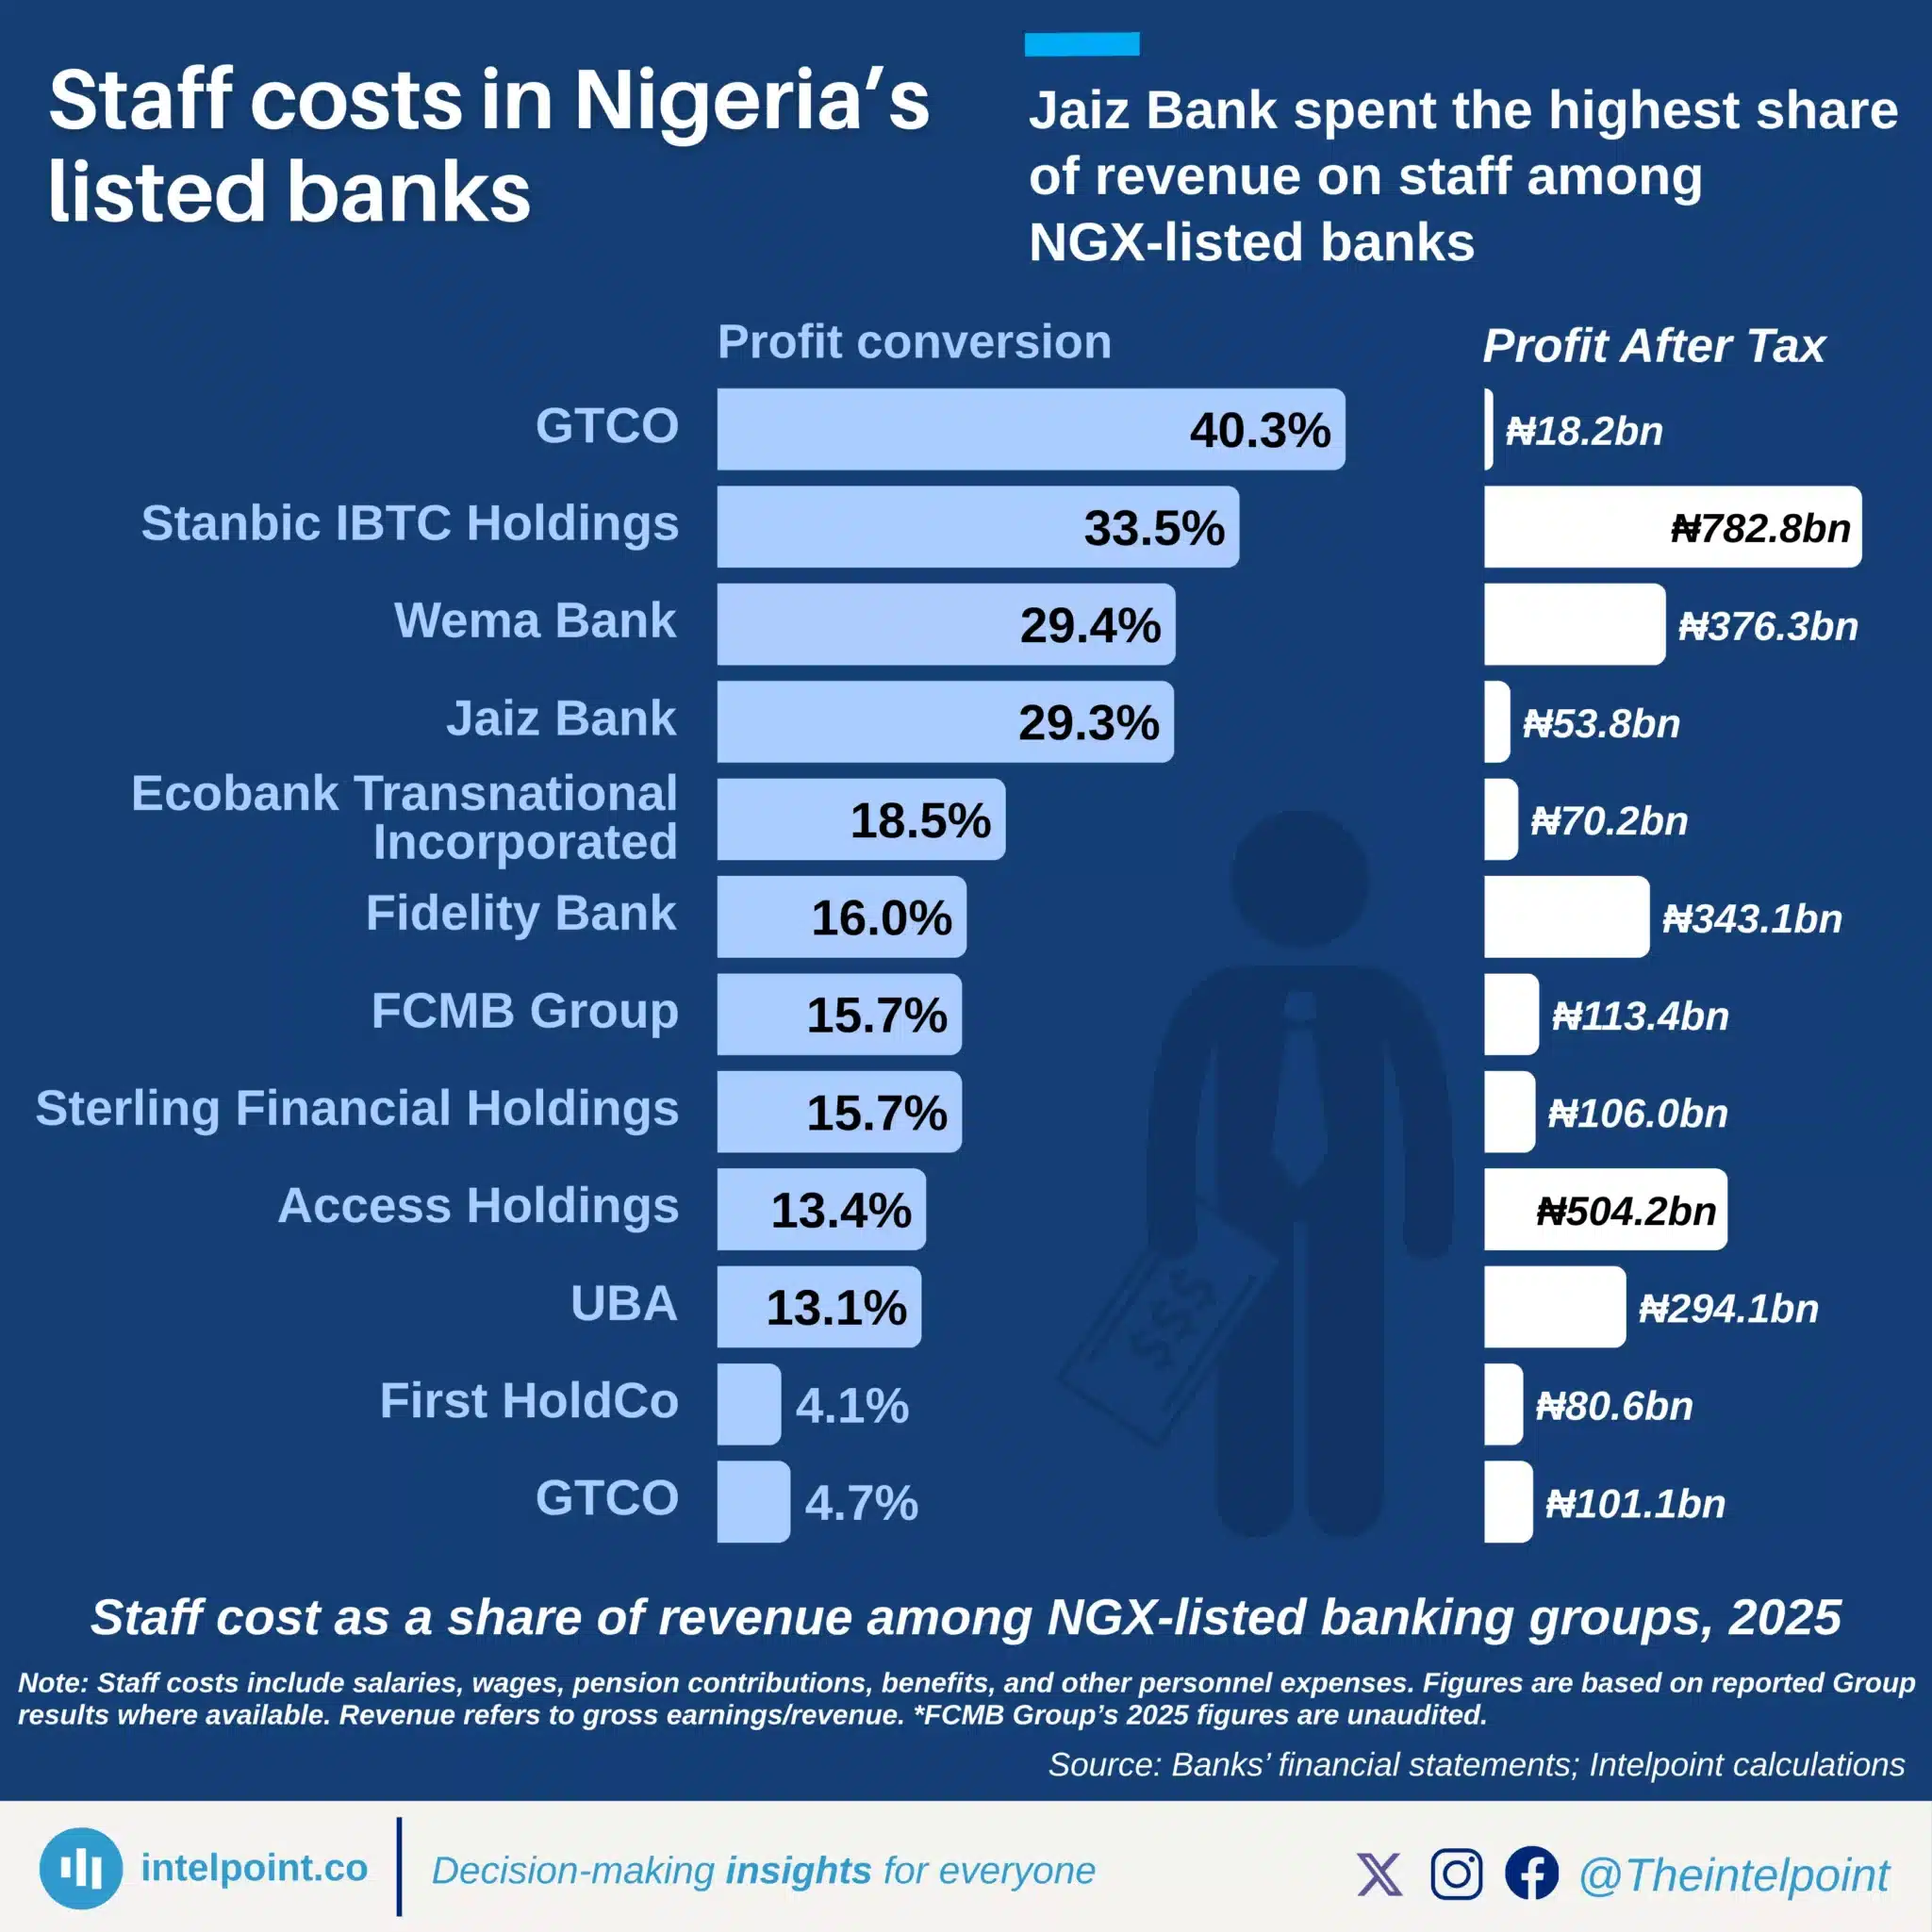
Jaiz Bank spent the highest share of revenue on staff among NGX-listed banks
Jaiz Bank spent the highest share of revenue on staff in 2025. Jaiz spent nearly ₦18 on staff for every ₦100 of revenue. ETI and UBA followed with the next highest staff-cost-to-revenue ratios. GTCO had the lowest staff-cost burden among the listed banks. ETI spent the most in absolute staff costs, at ₦782.8 billion.

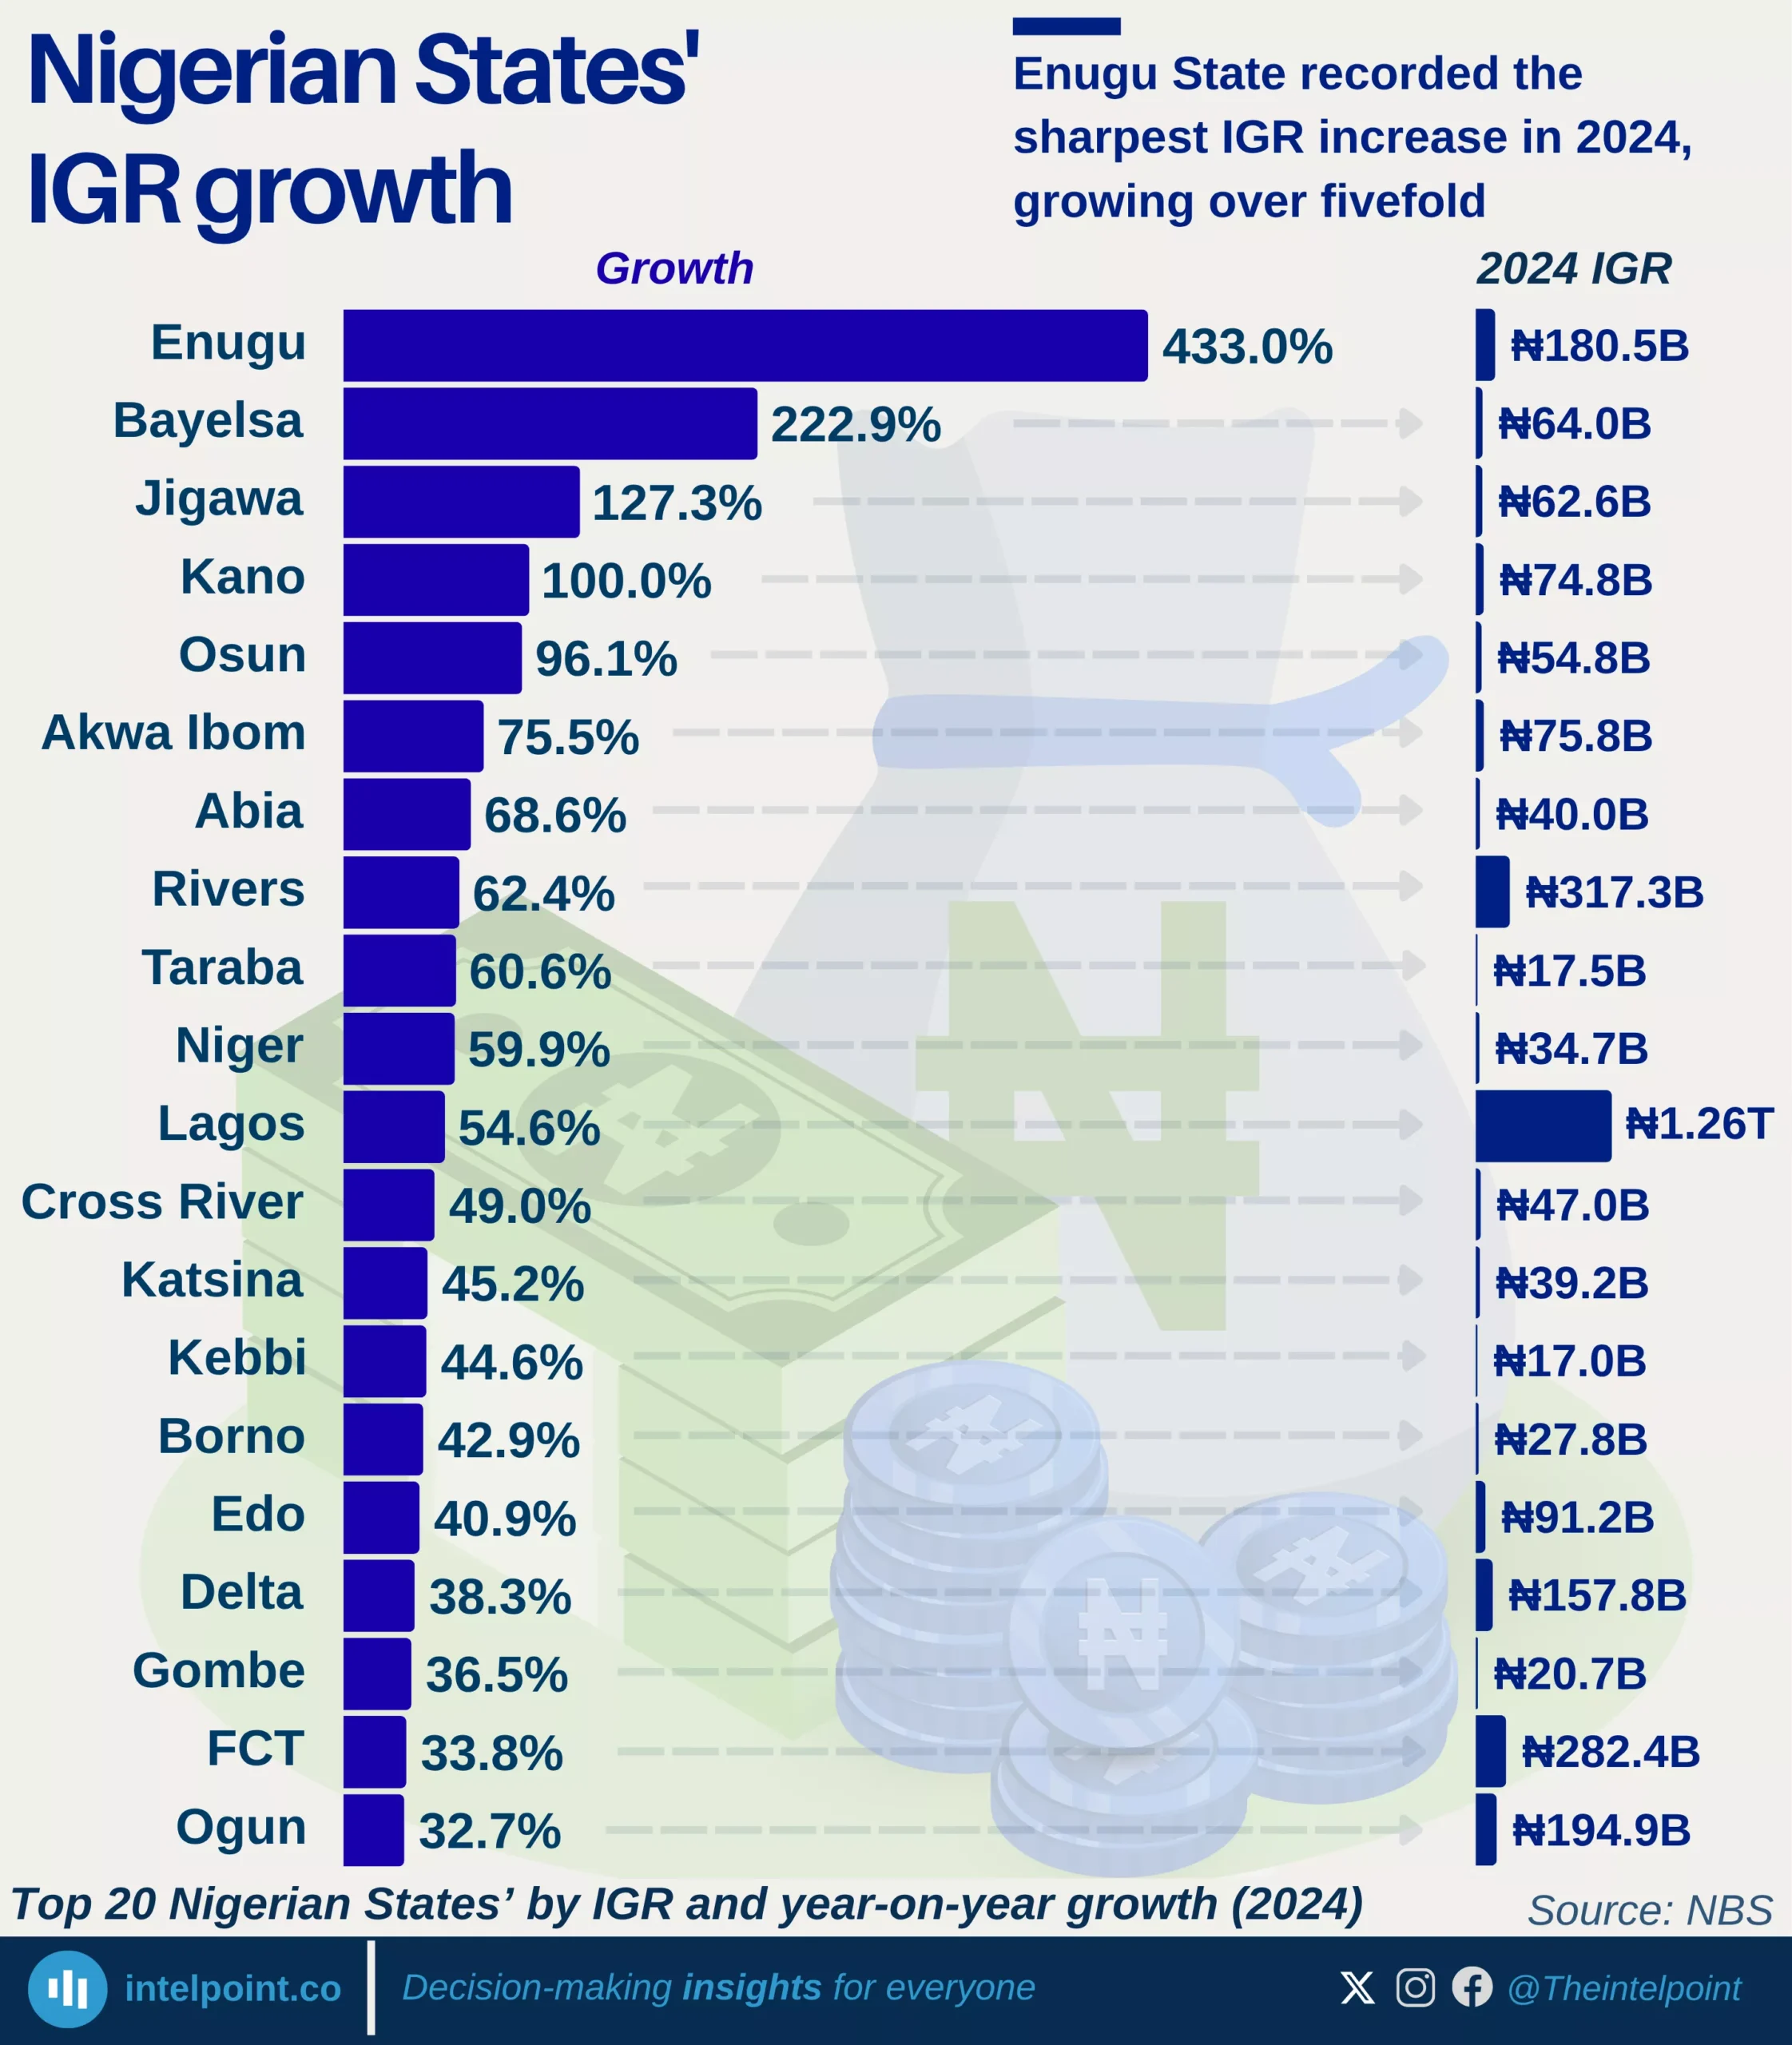
Enugu State recorded the sharpest IGR increase in 2024, growing over fivefold
  • Enugu led the country in IGR growth in 2024 with a 433% increase.
  • Bayelsa, Jigawa, Kano, and Osun also experienced large year-on-year increases, indicating widening fiscal activity across regions.
  • Lagos, Rivers, and the FCT recorded slower growth rates but still generated the largest total revenues.
  • The fastest growth often came from states focused on reforming tax systems or broadening local revenue sources, rather than from being traditionally big or wealthy states alone.

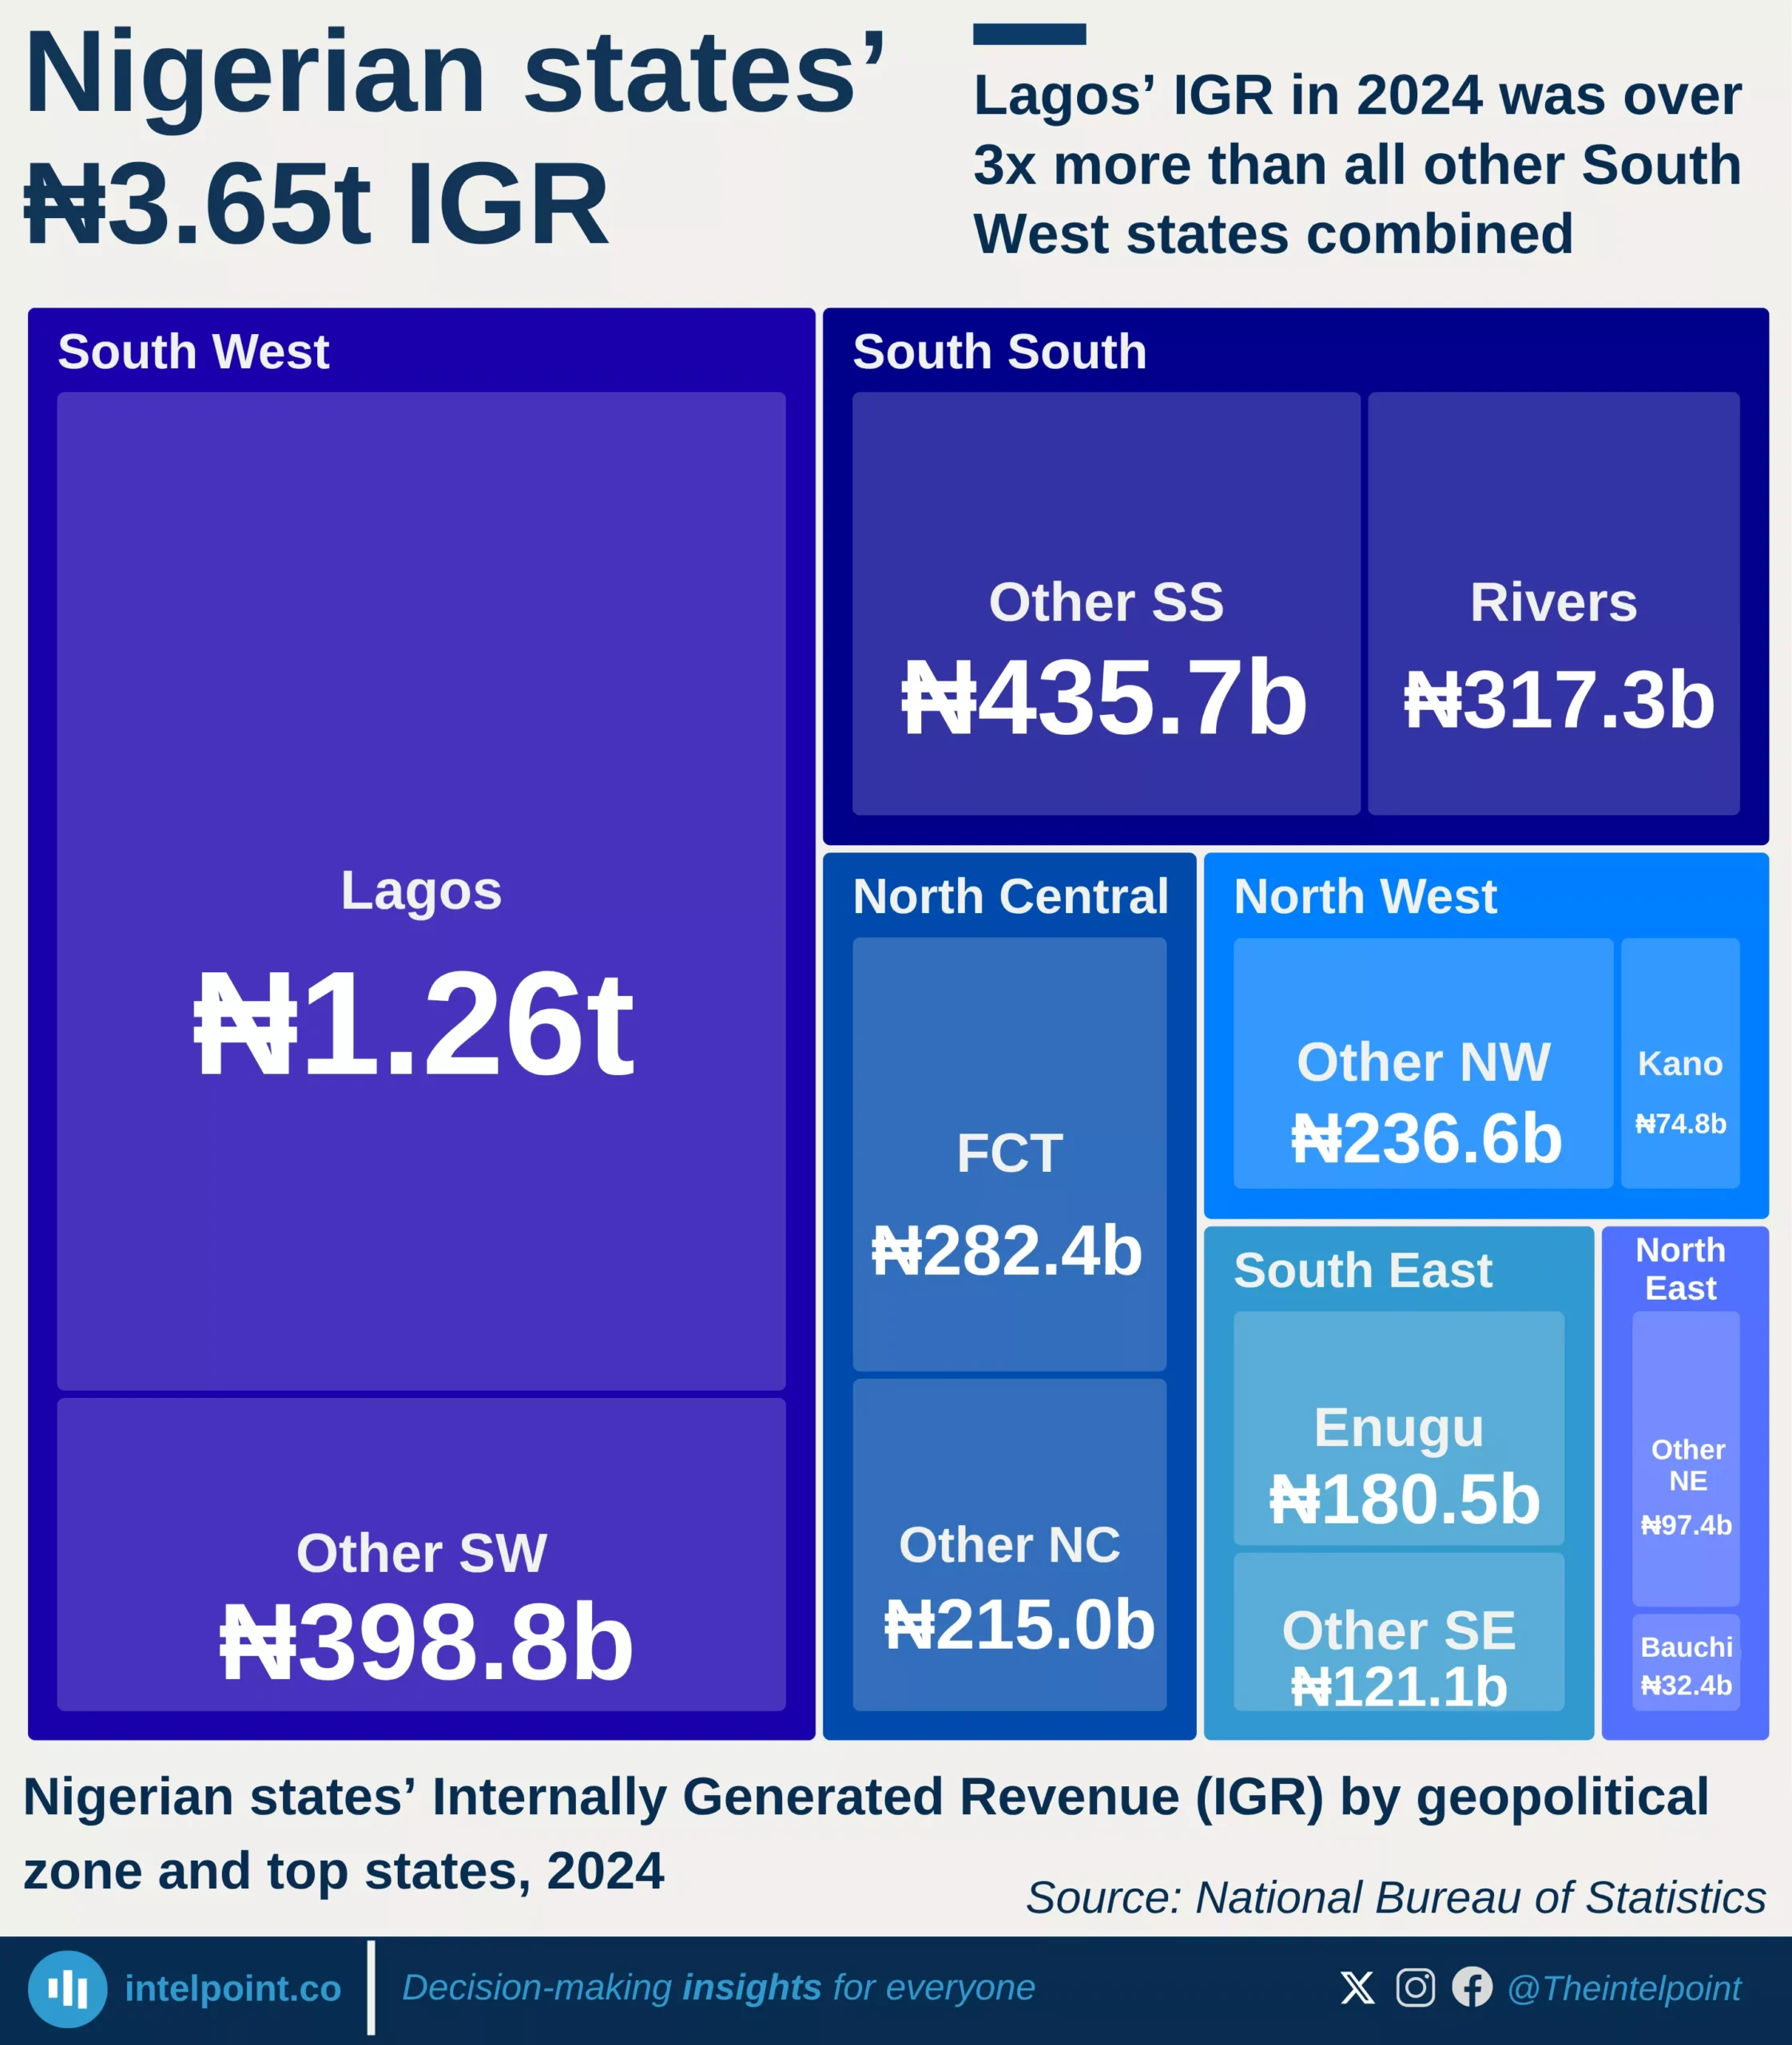
Lagos’ IGR in 2024 was over 3x more than all other South West states combined
  • Lagos drives most revenue in the South West, accounting for the clear majority of the region’s IGR.
  • Each geopolitical zone has one dominant state that shapes its revenue profile.
  • Fiscal capacity remains heavily skewed toward a few urban and resource-rich states.

POPULAR TOPICS
SIGN UP TO OUR NEWSLETTER
Get periodic updates about the African startup space, access to our reports, among others.
Subscribe Here
Subscription Form

A product of Techpoint Africa. All rights reserved