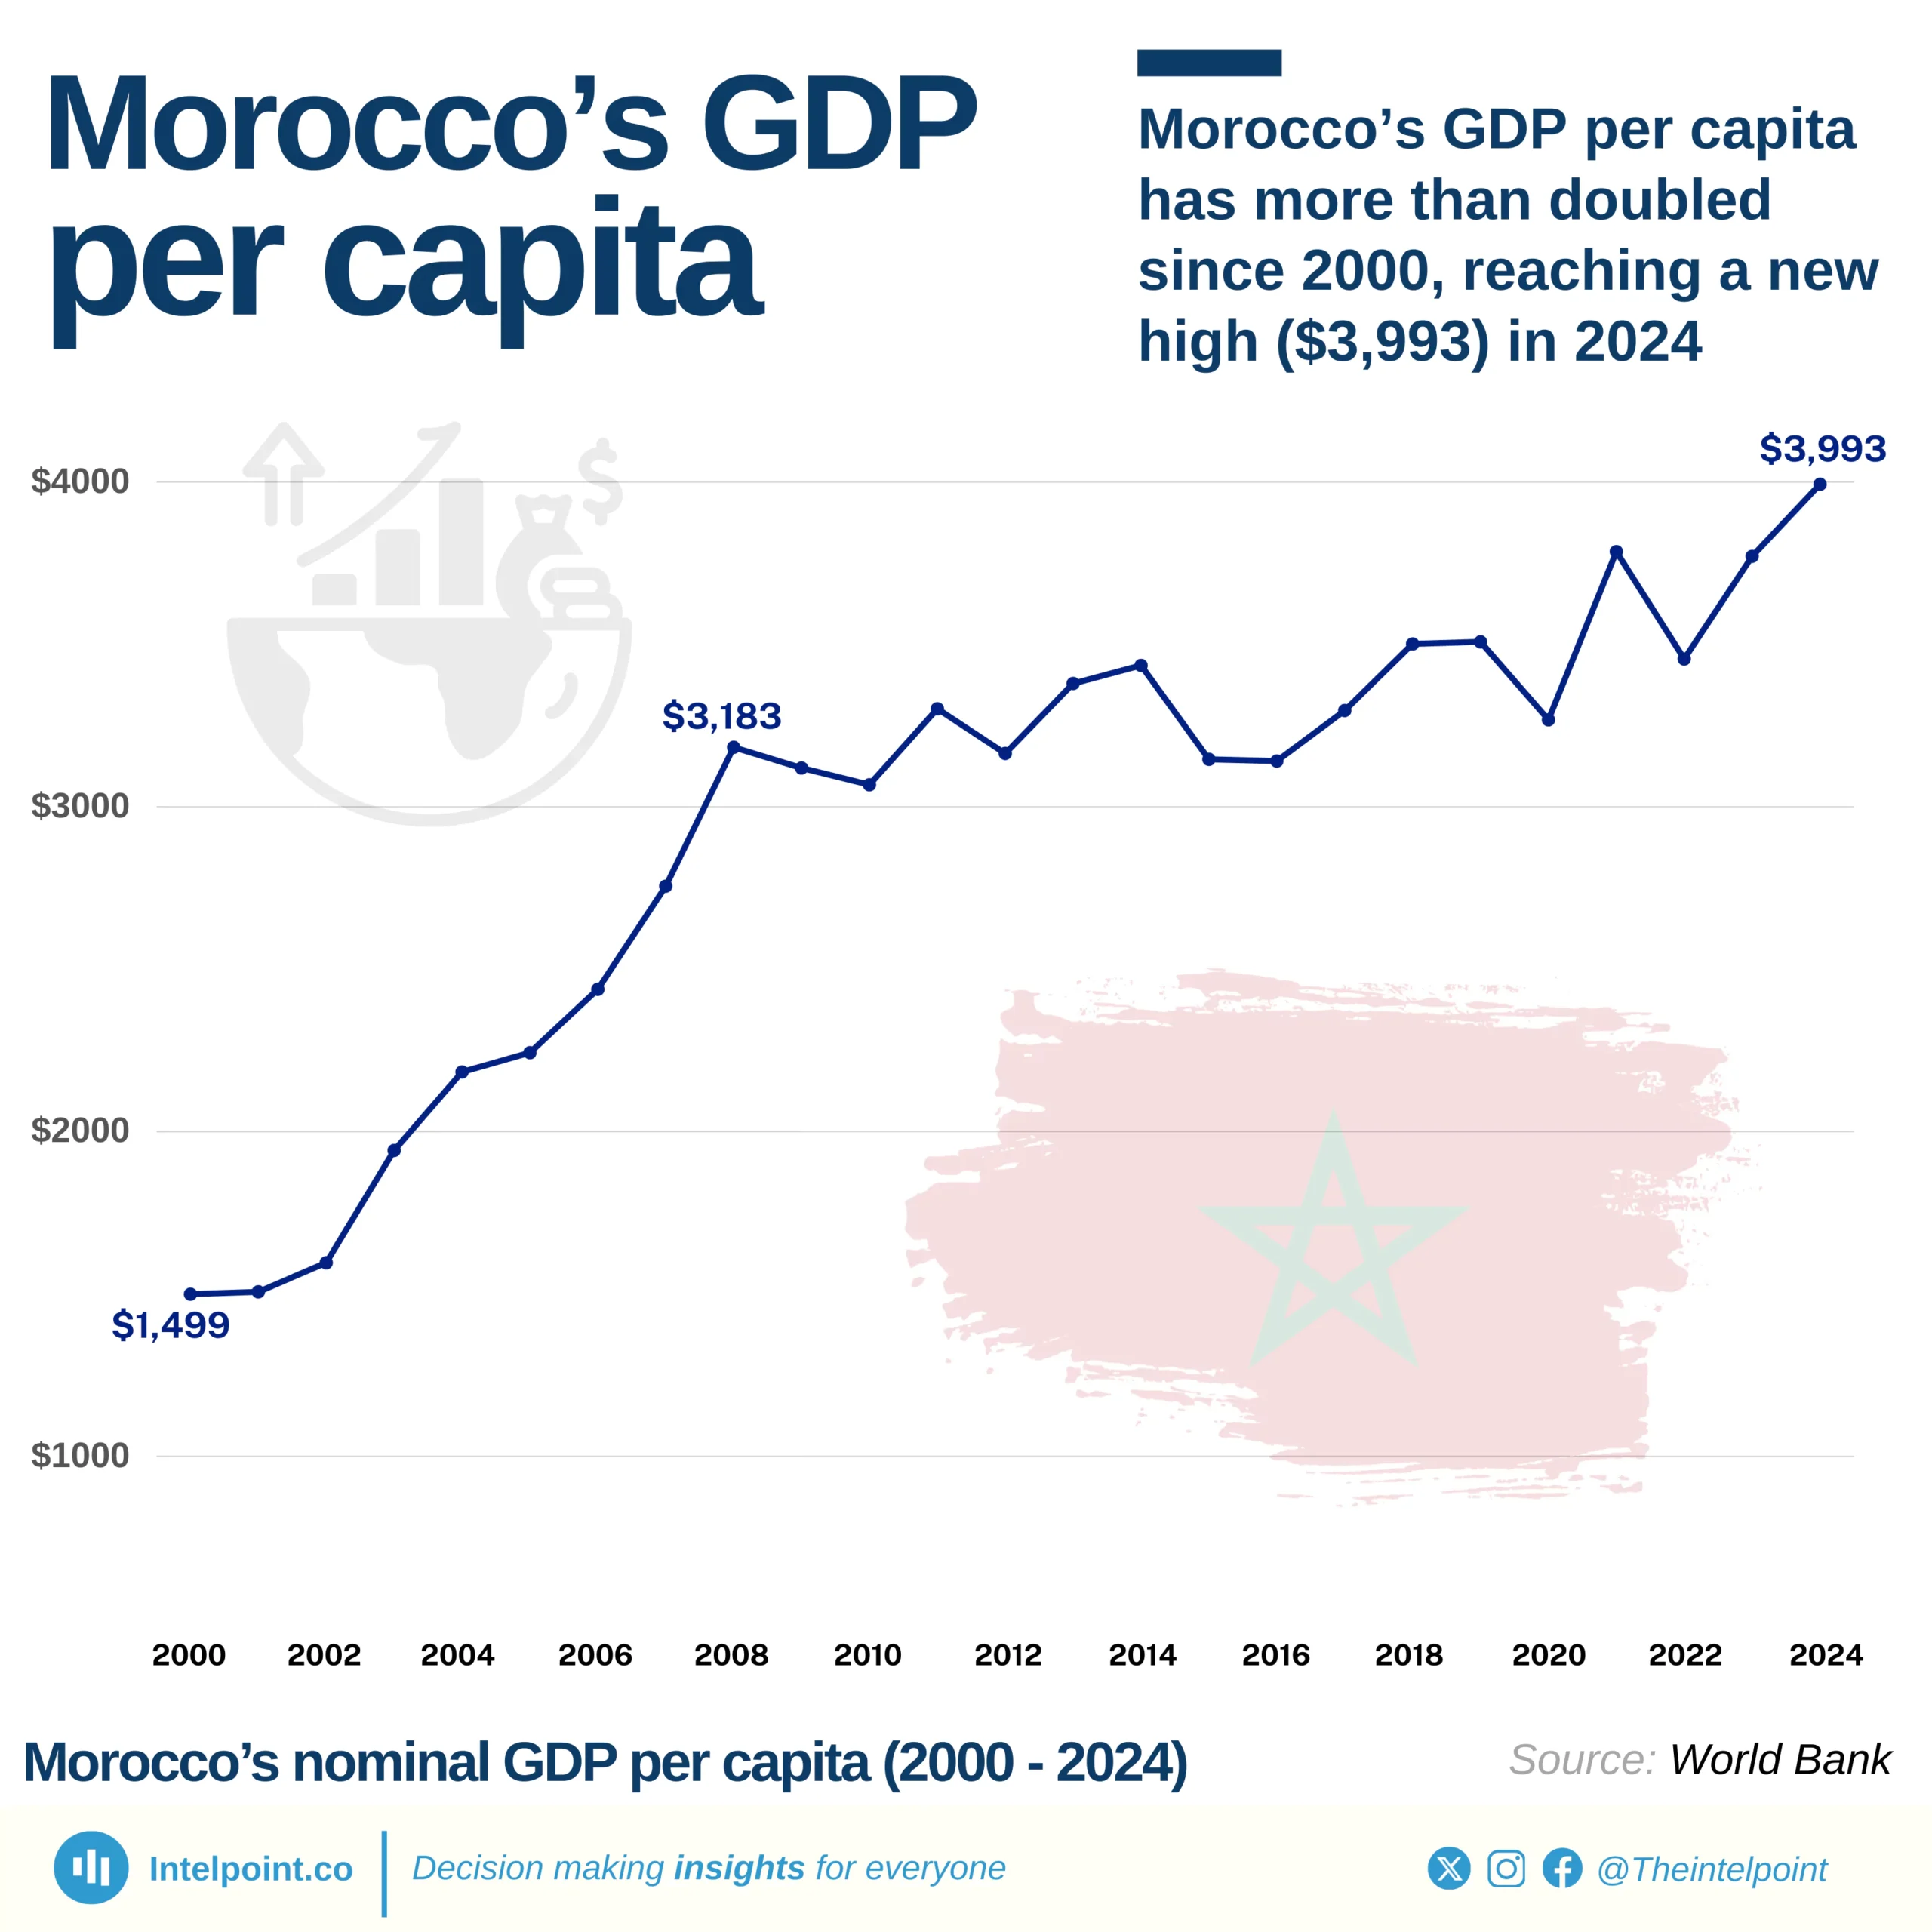
Morocco’s GDP per capita has more than doubled since 2000, reaching a new high ($3,993) in 2024

  • Morocco’s GDP per capita has shown a fluctuating pattern in the last 25 years, with periods of steady growth and also fall.
  • The years 2003–2008 stand out as a high-growth phase, with GDP per capita rising rapidly from $1,941.9 to $3,183.2.
  • In 2021, a dramatic 15.9% rebound took GDP per capita up to $3,785.9.
  • In 2024, nominal GDP per capita stood at $3,993.4.
  • The last 25 years depict a more than twofold increase in Morocco’s GDP per capita, moving from $1,499.1 to $3,993.4.

In 2000, Morocco’s GDP per capita was $1,499, reflecting modest economic footing. By 2001, it inched upward to $1,506. From then, the country experienced a consistent growth, reaching its peak in 2008 ($3,183.2.) The years 2003–2008 stand out as a high-growth phase, with GDP per capita rising rapidly from $1,942 to $3,183. The following year, 2009, saw a modest decline, with the figure slightly lowering to $3,120. A further drop to $3,068 occurred in 2010.

In 2011, the economy rebounded with a 7.6% uptick to around $3,302, while 2012 brought a 4.2% downturn, reducing GDP per capita to about $3,164. The figure rose in 2013, reaching $3,380. A modest growth in 2014 took GDP per capita to $3,435.

However, in 2015, the economy contracted, lowering GDP per capita to $3,146. The figure further declined in 2016 to $3,141. Recovery resumed with 5.0% growth in 2017, pushing the figure to $3,297.

The COVID-19 shock hit in 2020, causing a 6.8% decline to around $3,268. In 2021, a dramatic 15.6% rebound took GDP per capita to $3,786. The recovery faltered in 2022 and dropped to $3,455.

Overall, the period from 2000 to 2024 depicts a more than twofold increase in Morocco’s GDP per capita, moving from $1,499 to $3,993.
Source:

World Bank

Period:

2000-2024
HTML code to embed chart
Want a bespoke report?
Reach out
Tags
Related Insights

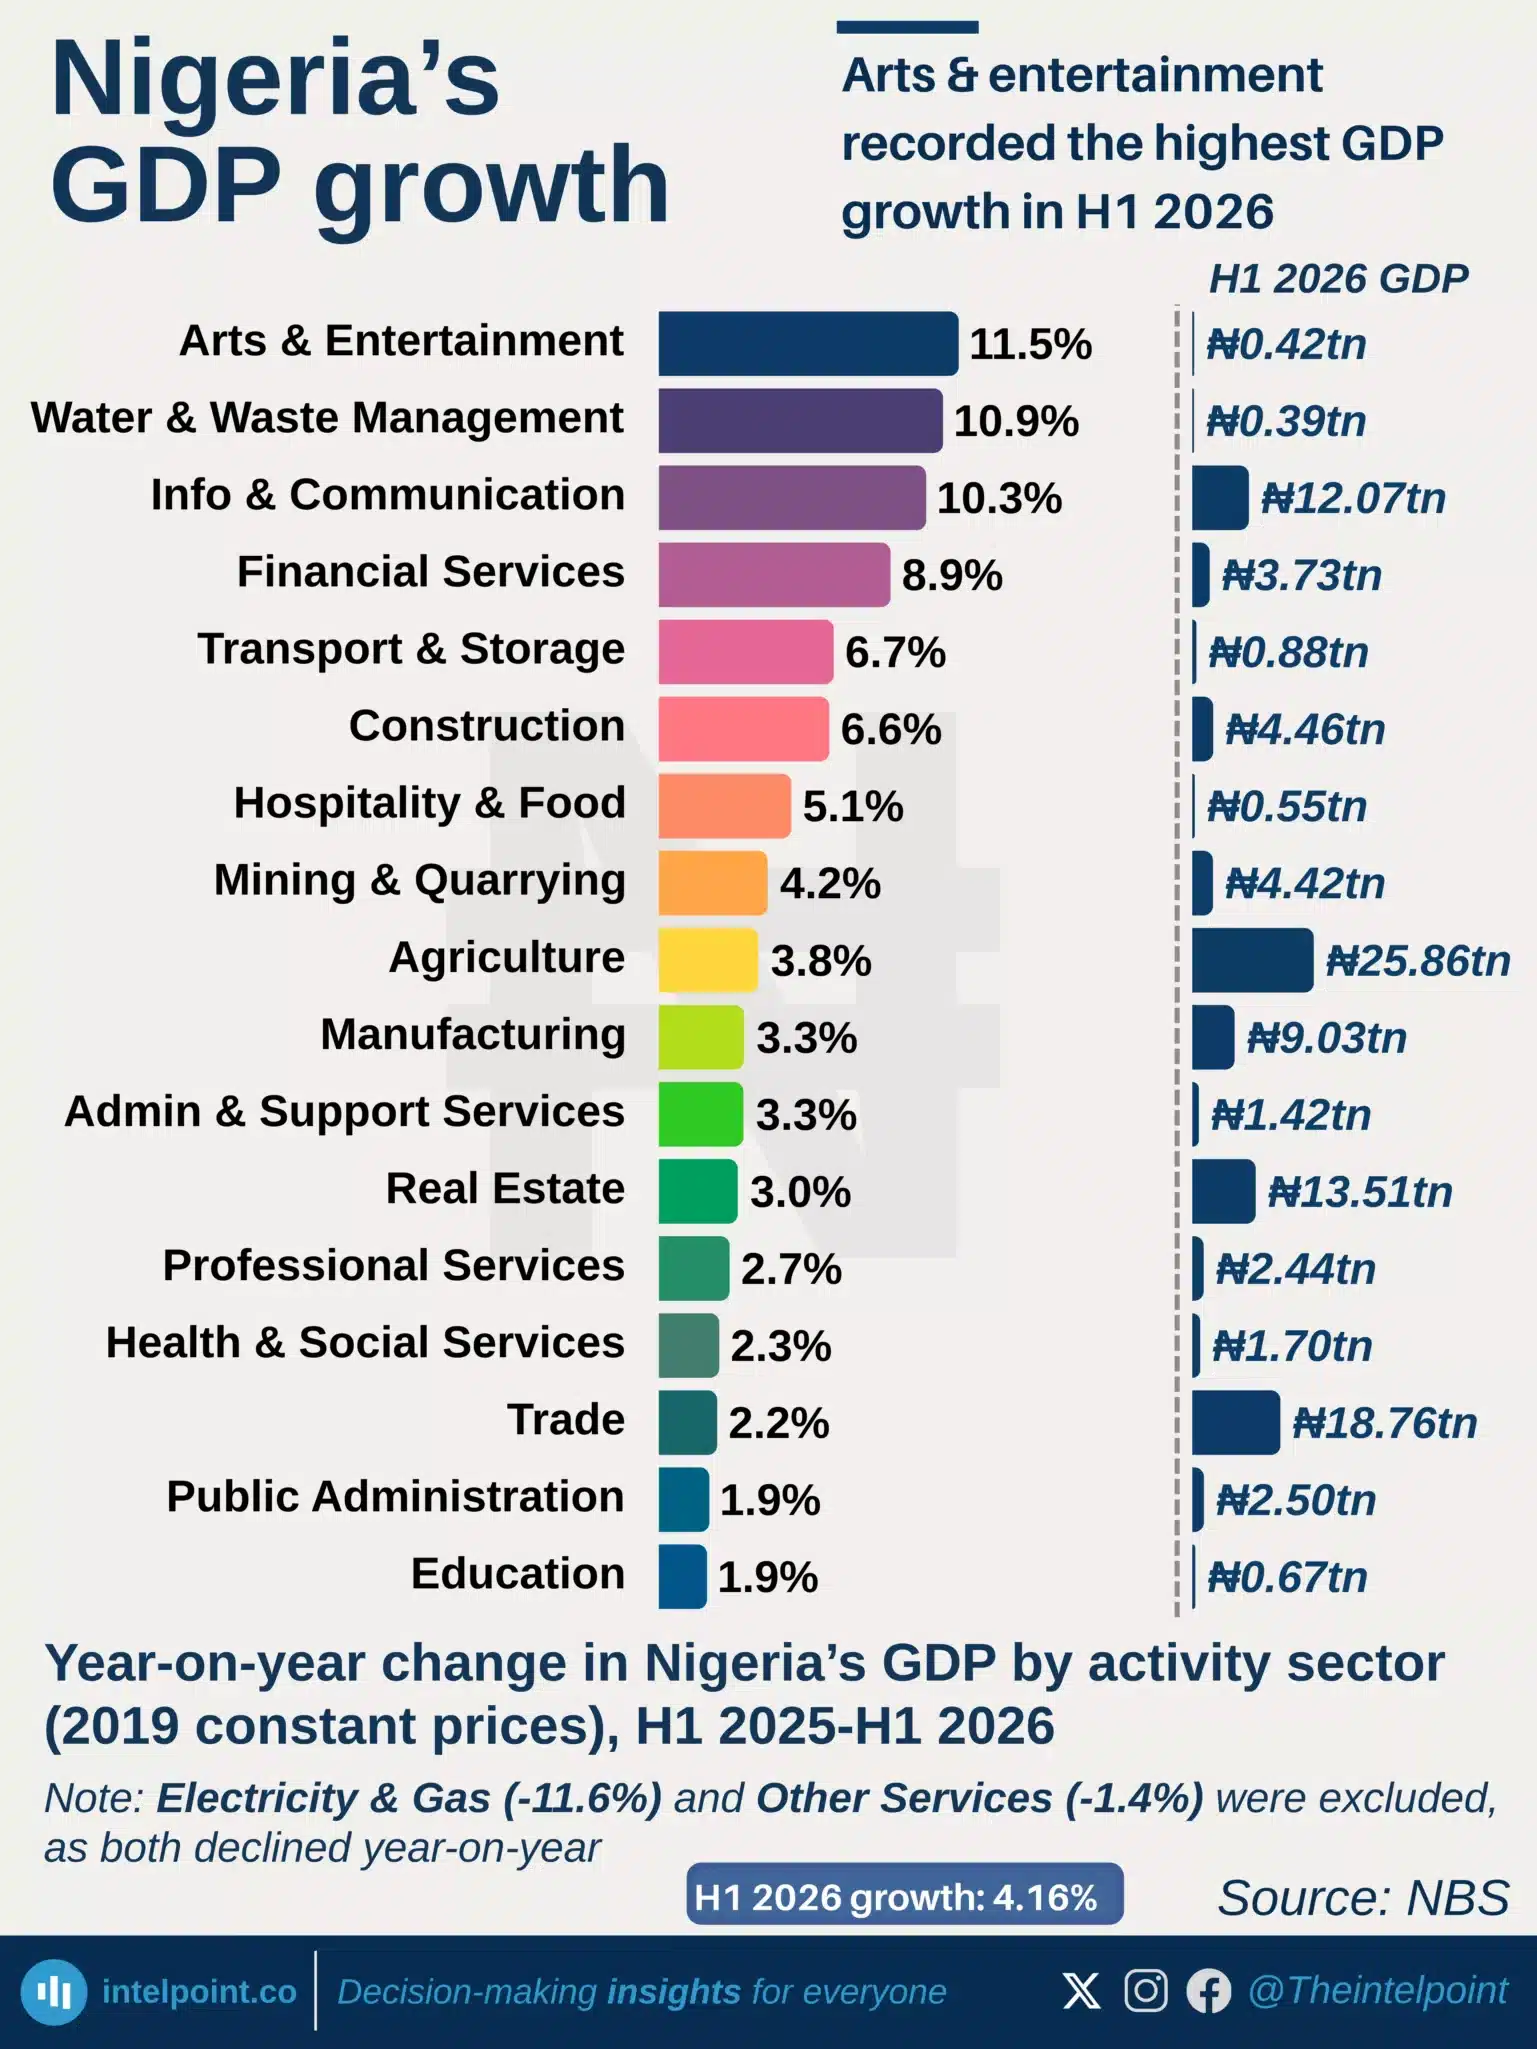
Arts & entertainment recorded the highest GDP growth in H1 2026
  • Nigeria’s economy grew 4.16% in H1 2026, but growth was uneven across sectors.
  • Arts and entertainment grew fastest at 11.5%, followed by water and waste management (10.9%) and information and communication (10.3%).
  • Agriculture, which accounts for about a quarter of GDP, grew 3.8%, below the headline rate.
  • Trade and real estate also lagged, growing 2.2% and 3.0%, respectively.
  • Electricity and gas was the biggest drag, contracting 11.6%, while Other Services fell 1.4%.

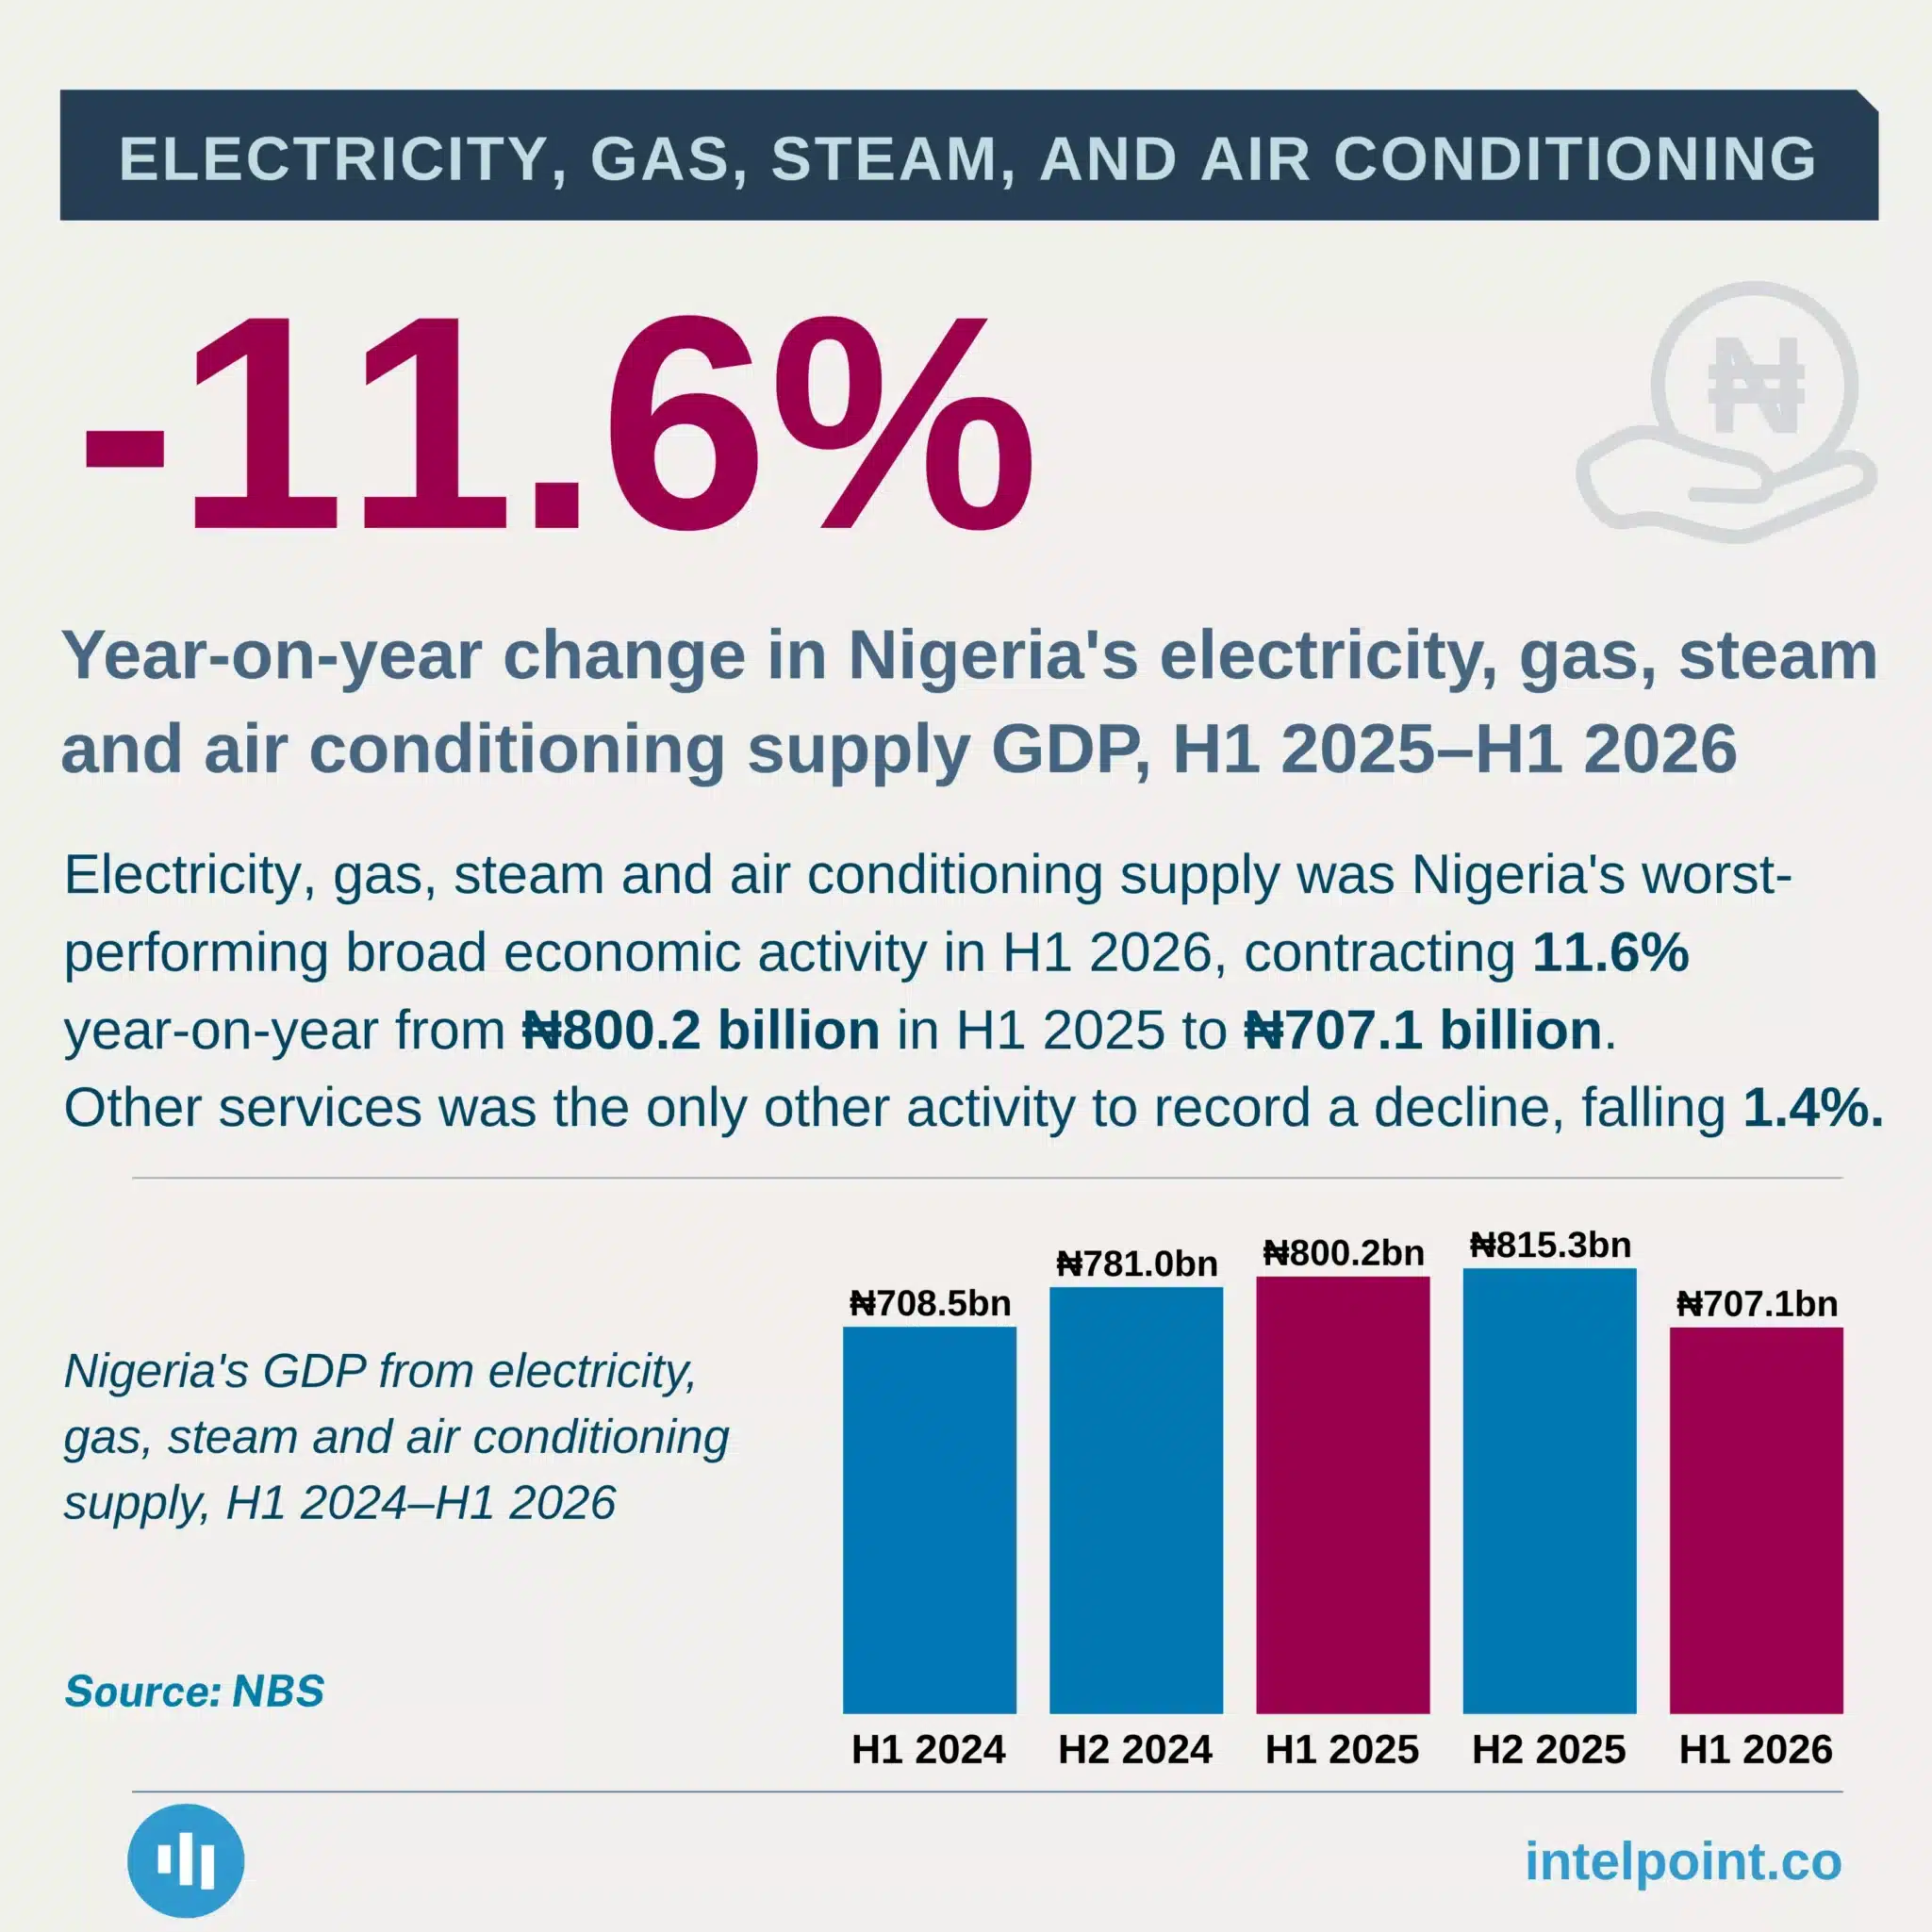
Year-on-year change in Nigeria's electricity, gas, steam and air conditioning supply GDP
  • Electricity, gas and related supply was Nigeria’s worst-performing broad economic activity in H1 2026.
  • Sector GDP fell 11.6% year-on-year, from ₦800.2bn to ₦707.1bn.
  • Output fell below H1 2024 levels, when the sector recorded ₦708.5bn.
  • Only one other broad activity contracted: Other Services, which fell 1.4%.
  • The sector contributed just 0.7% of Nigeria’s real GDP on average over the period shown.

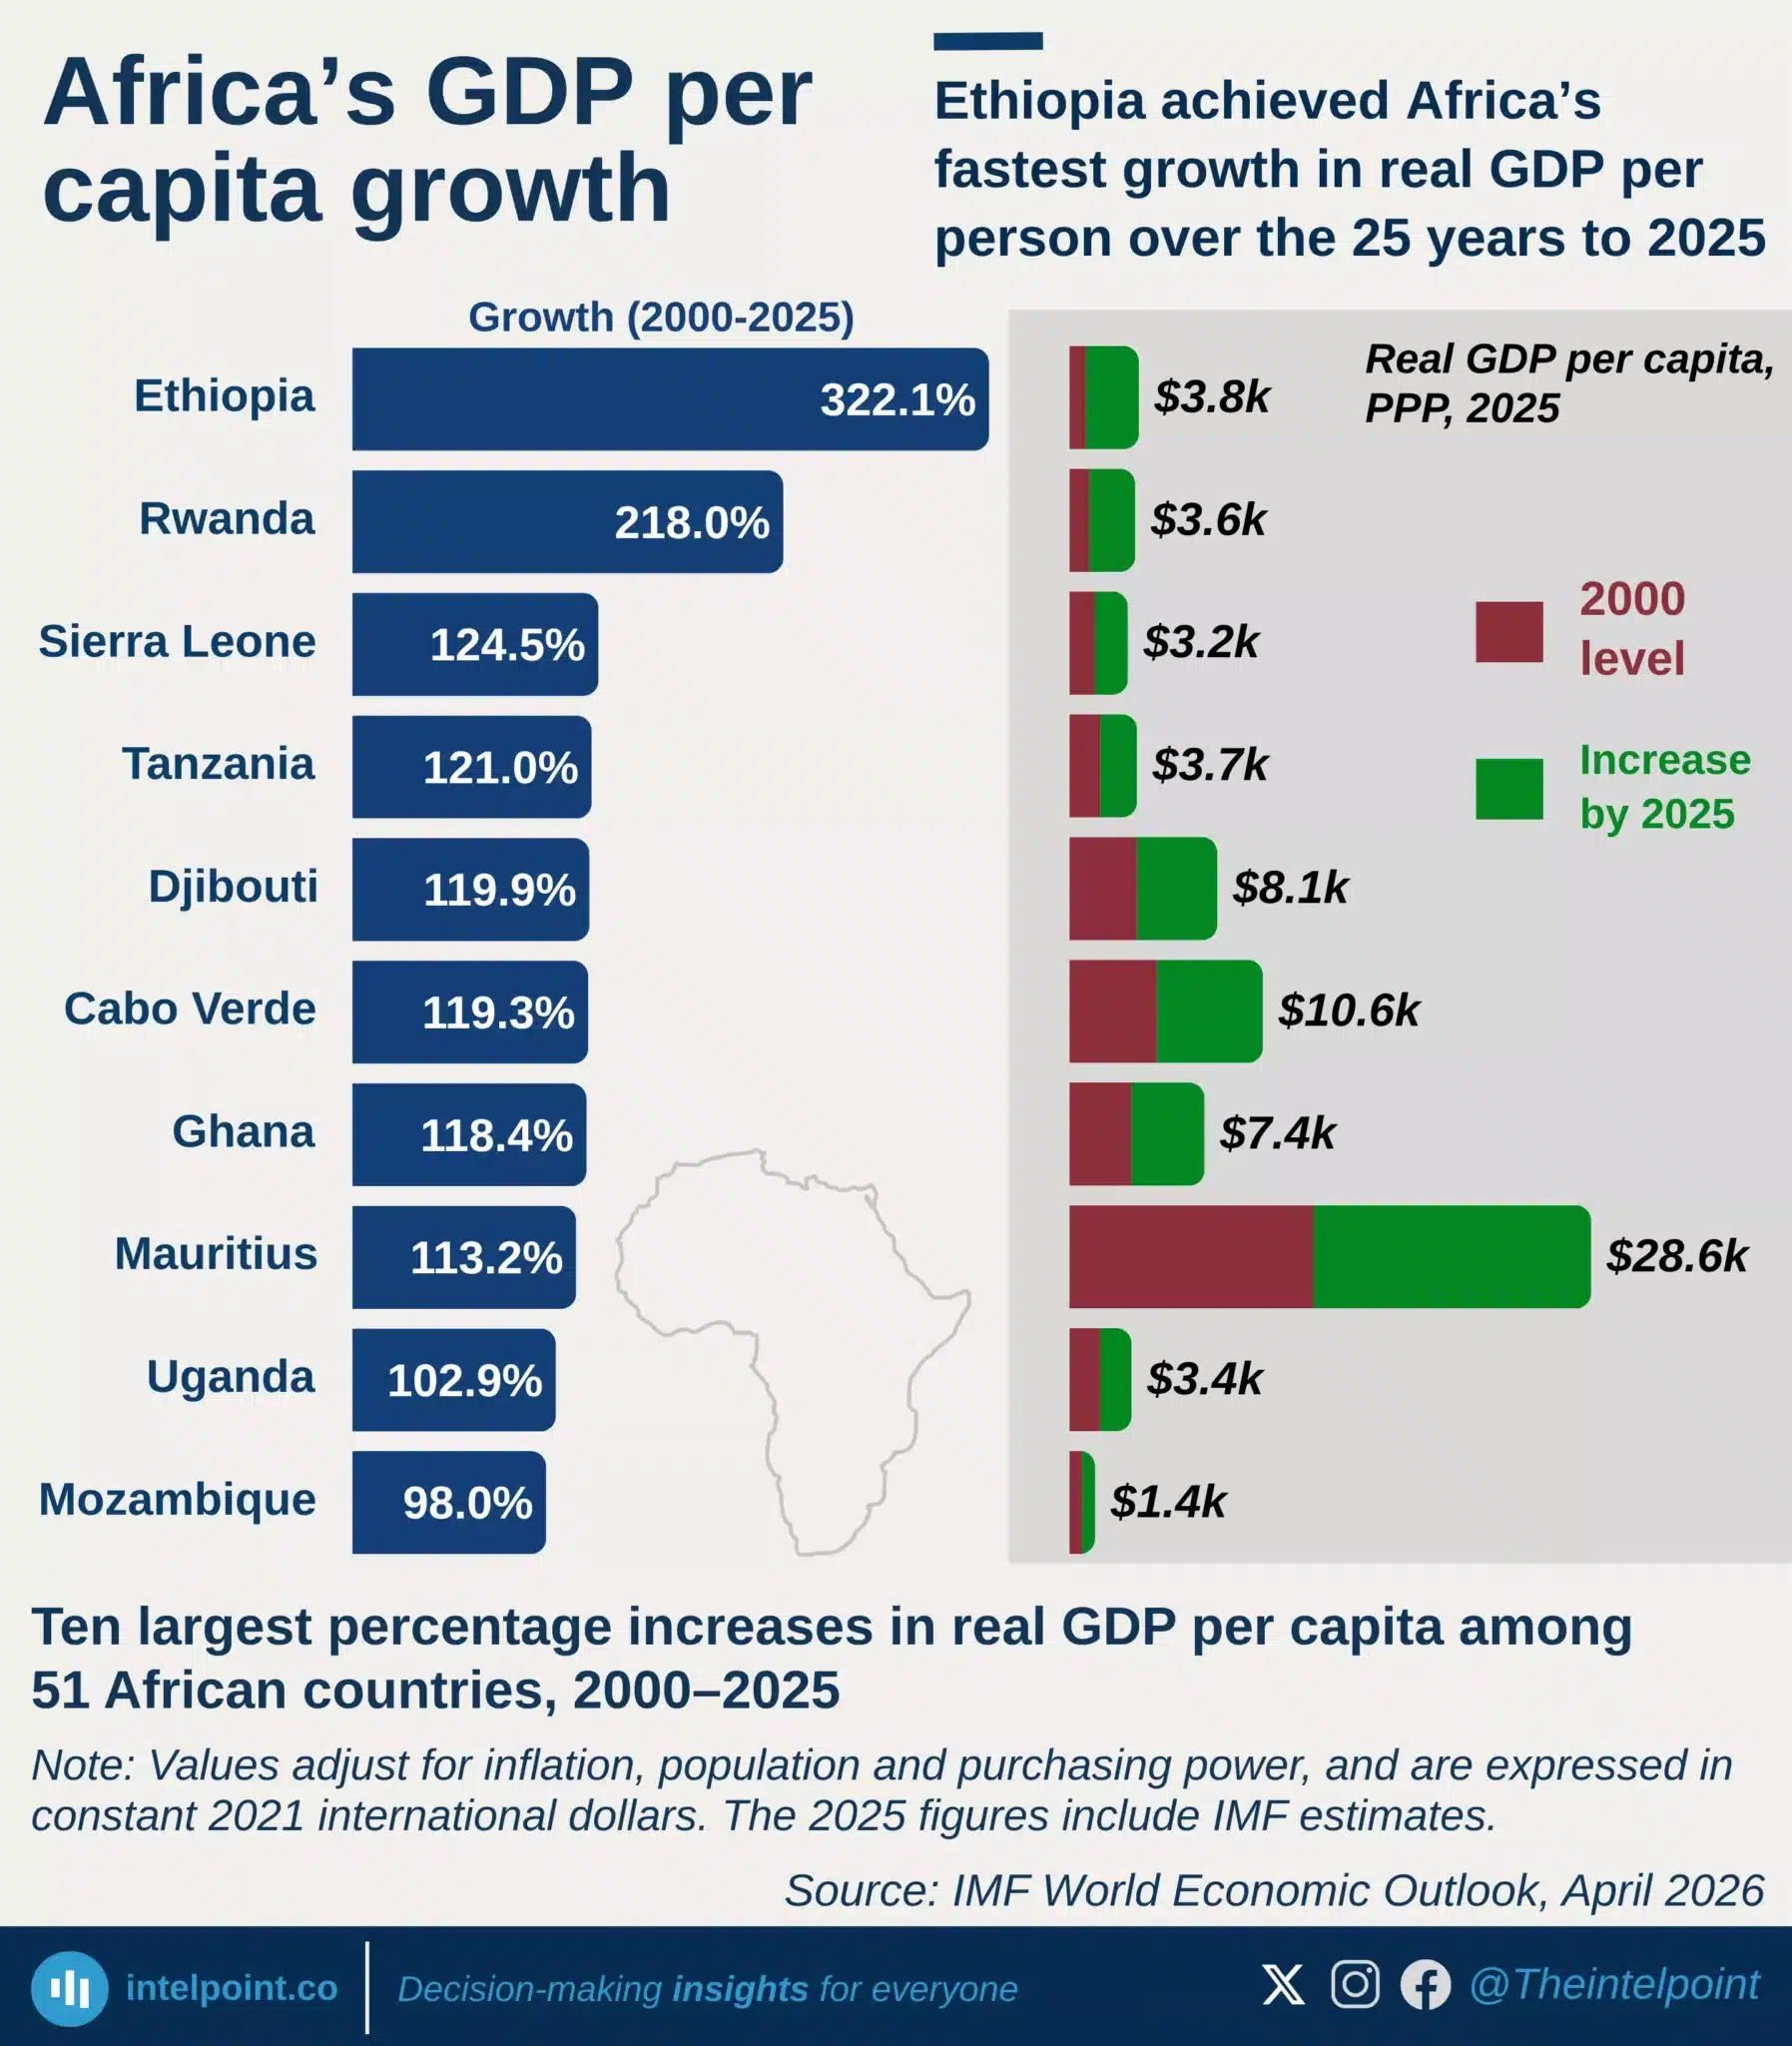
Ethiopia achieved Africa’s fastest growth in real GDP per person over the 25 years to 2025
  • Ethiopia recorded Africa's fastest real GDP per capita growth between 2000 and 2025.
  • Rwanda ranked second, while Sierra Leone, Tanzania and Djibouti completed the top five.
  • Ethiopia's real GDP per capita rose 322%, from $910 to $3,843.
  • Mauritius recorded Africa's largest absolute gain in real GDP per capita.
  • Nigeria ranked 15th, with real GDP per capita increasing 76.7%.

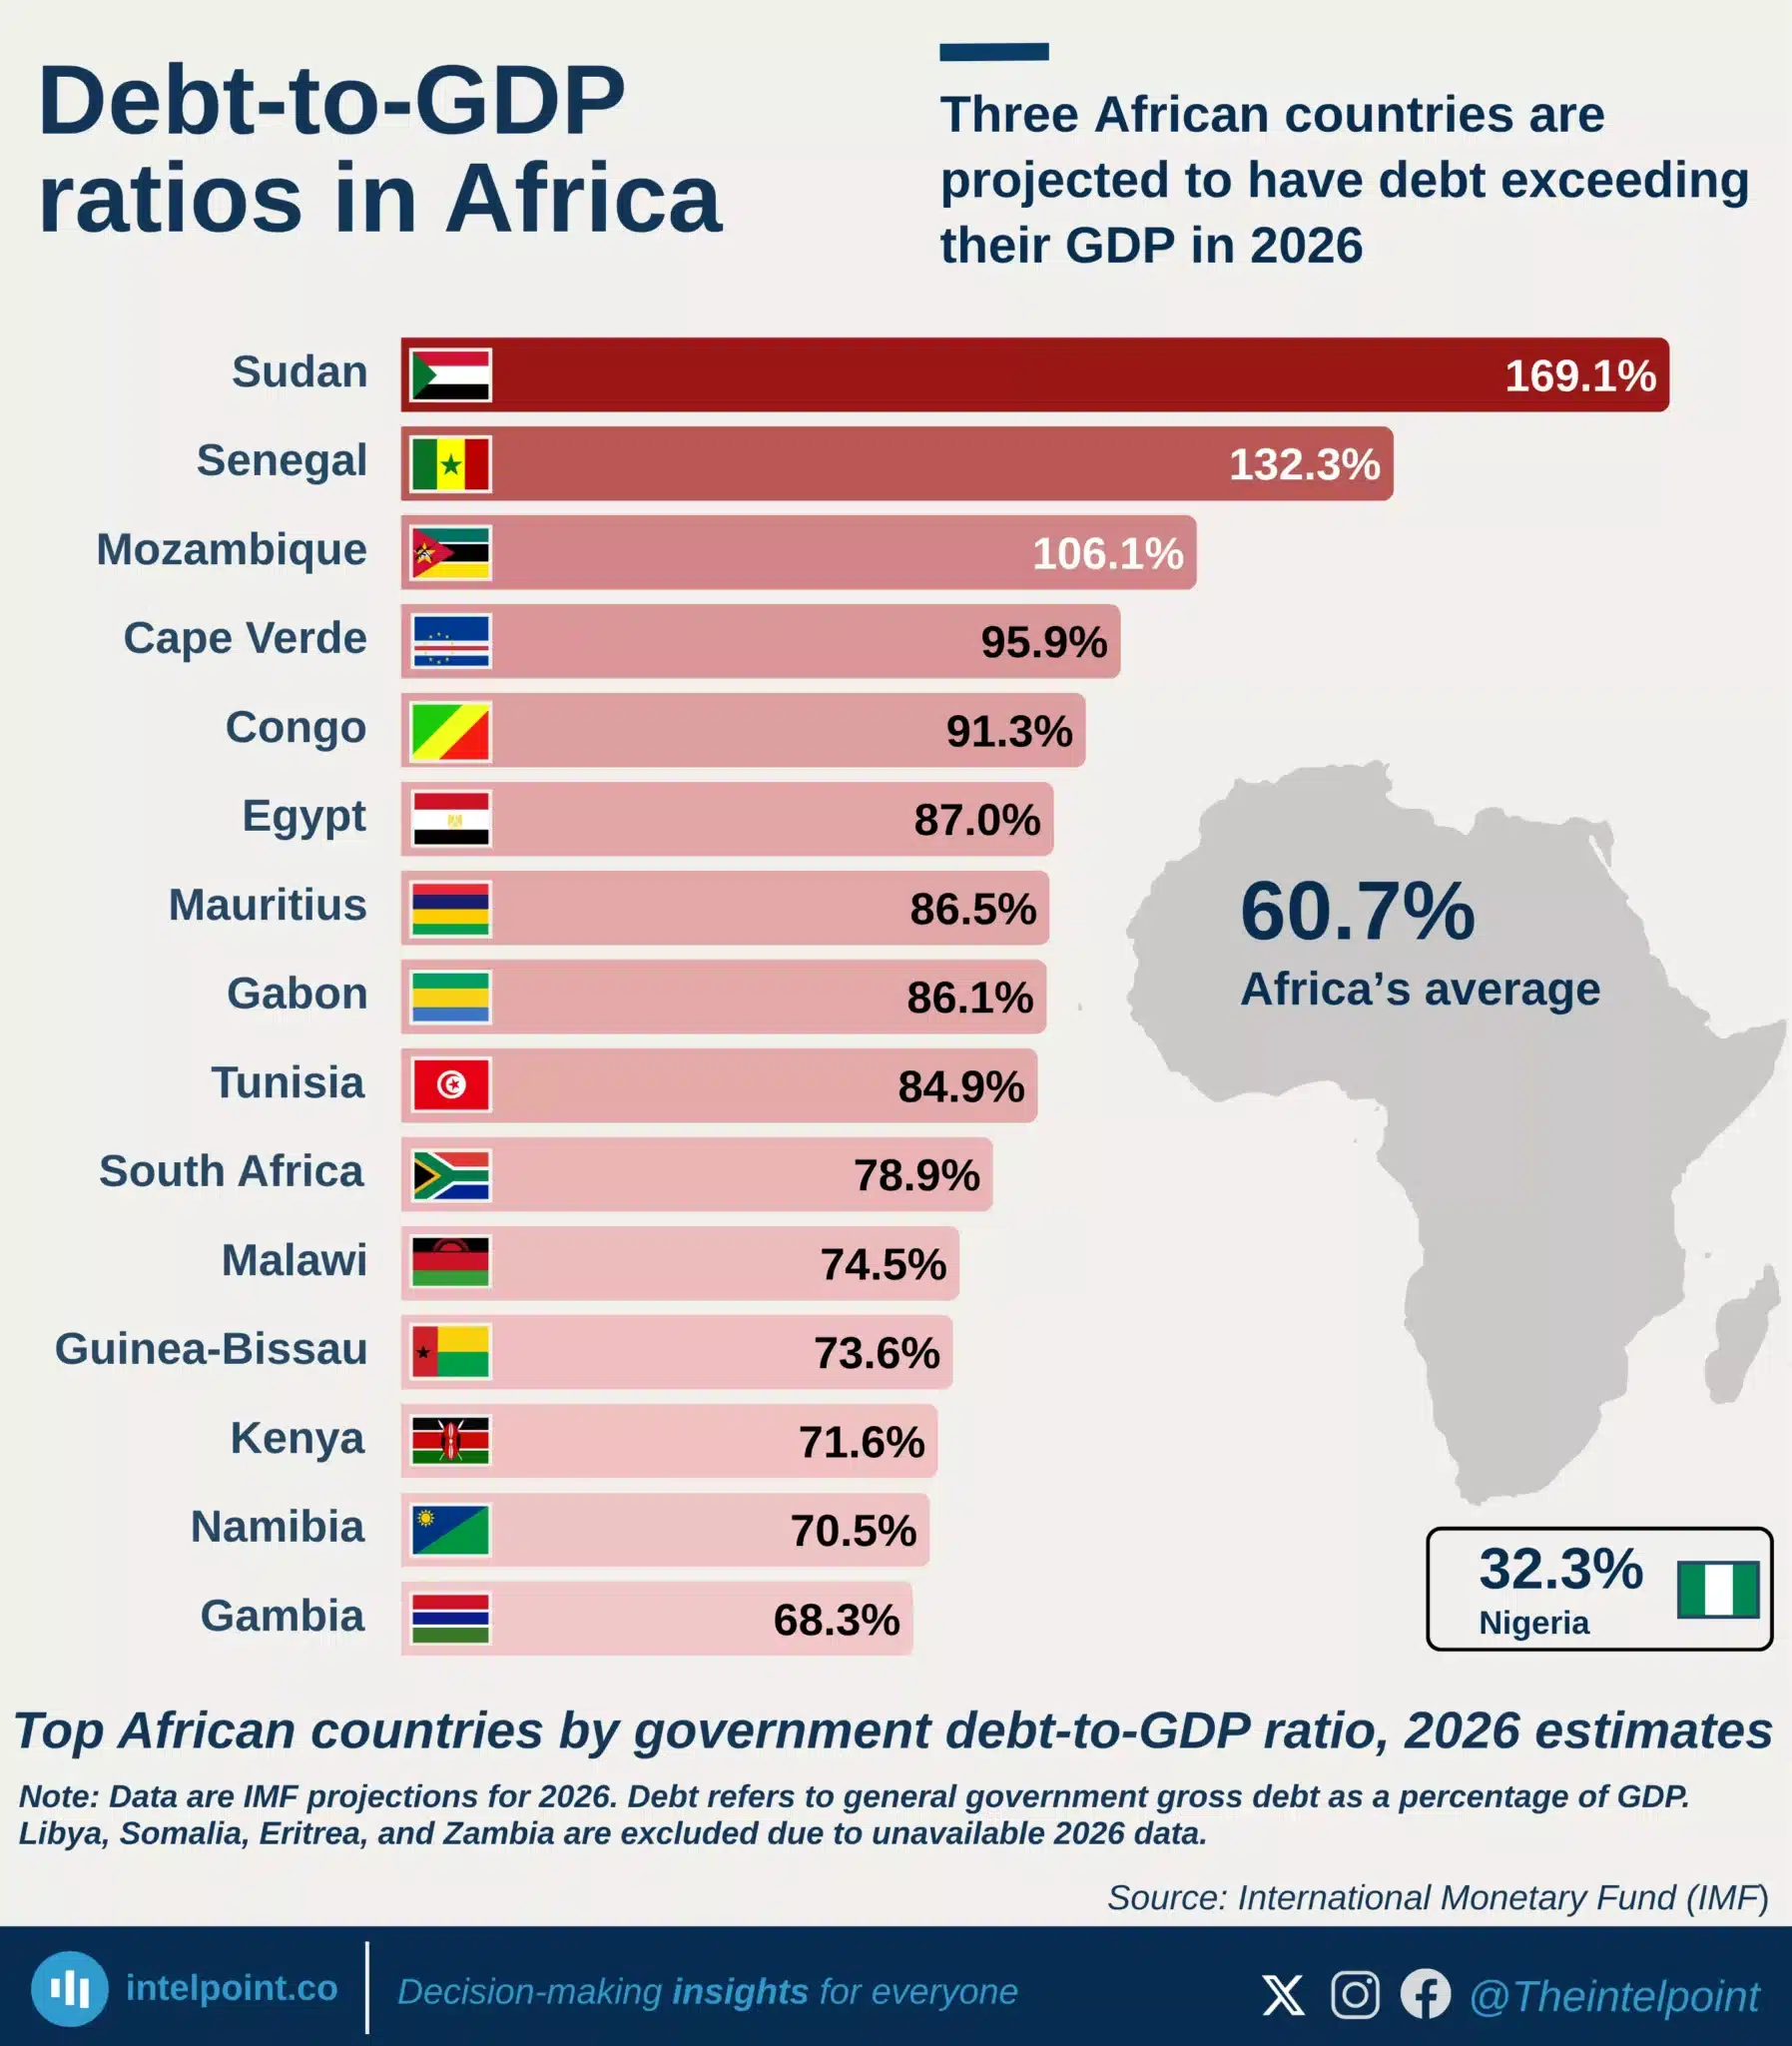
Three African countries are projected to have debt exceeding their GDP in 2026
  • Sudan is projected to have Africa’s highest debt-to-GDP ratio in 2026, at 169.1%.
  • Only three African countries are projected to owe more than the size of their economies in 2026.
  • Senegal and Mozambique join Sudan among countries with debt-to-GDP ratios above 100%.
  • Africa’s average government debt-to-GDP ratio is projected at 60.7% in 2026.
  • Nigeria’s projected debt-to-GDP ratio of 32.3% is far below the African average.

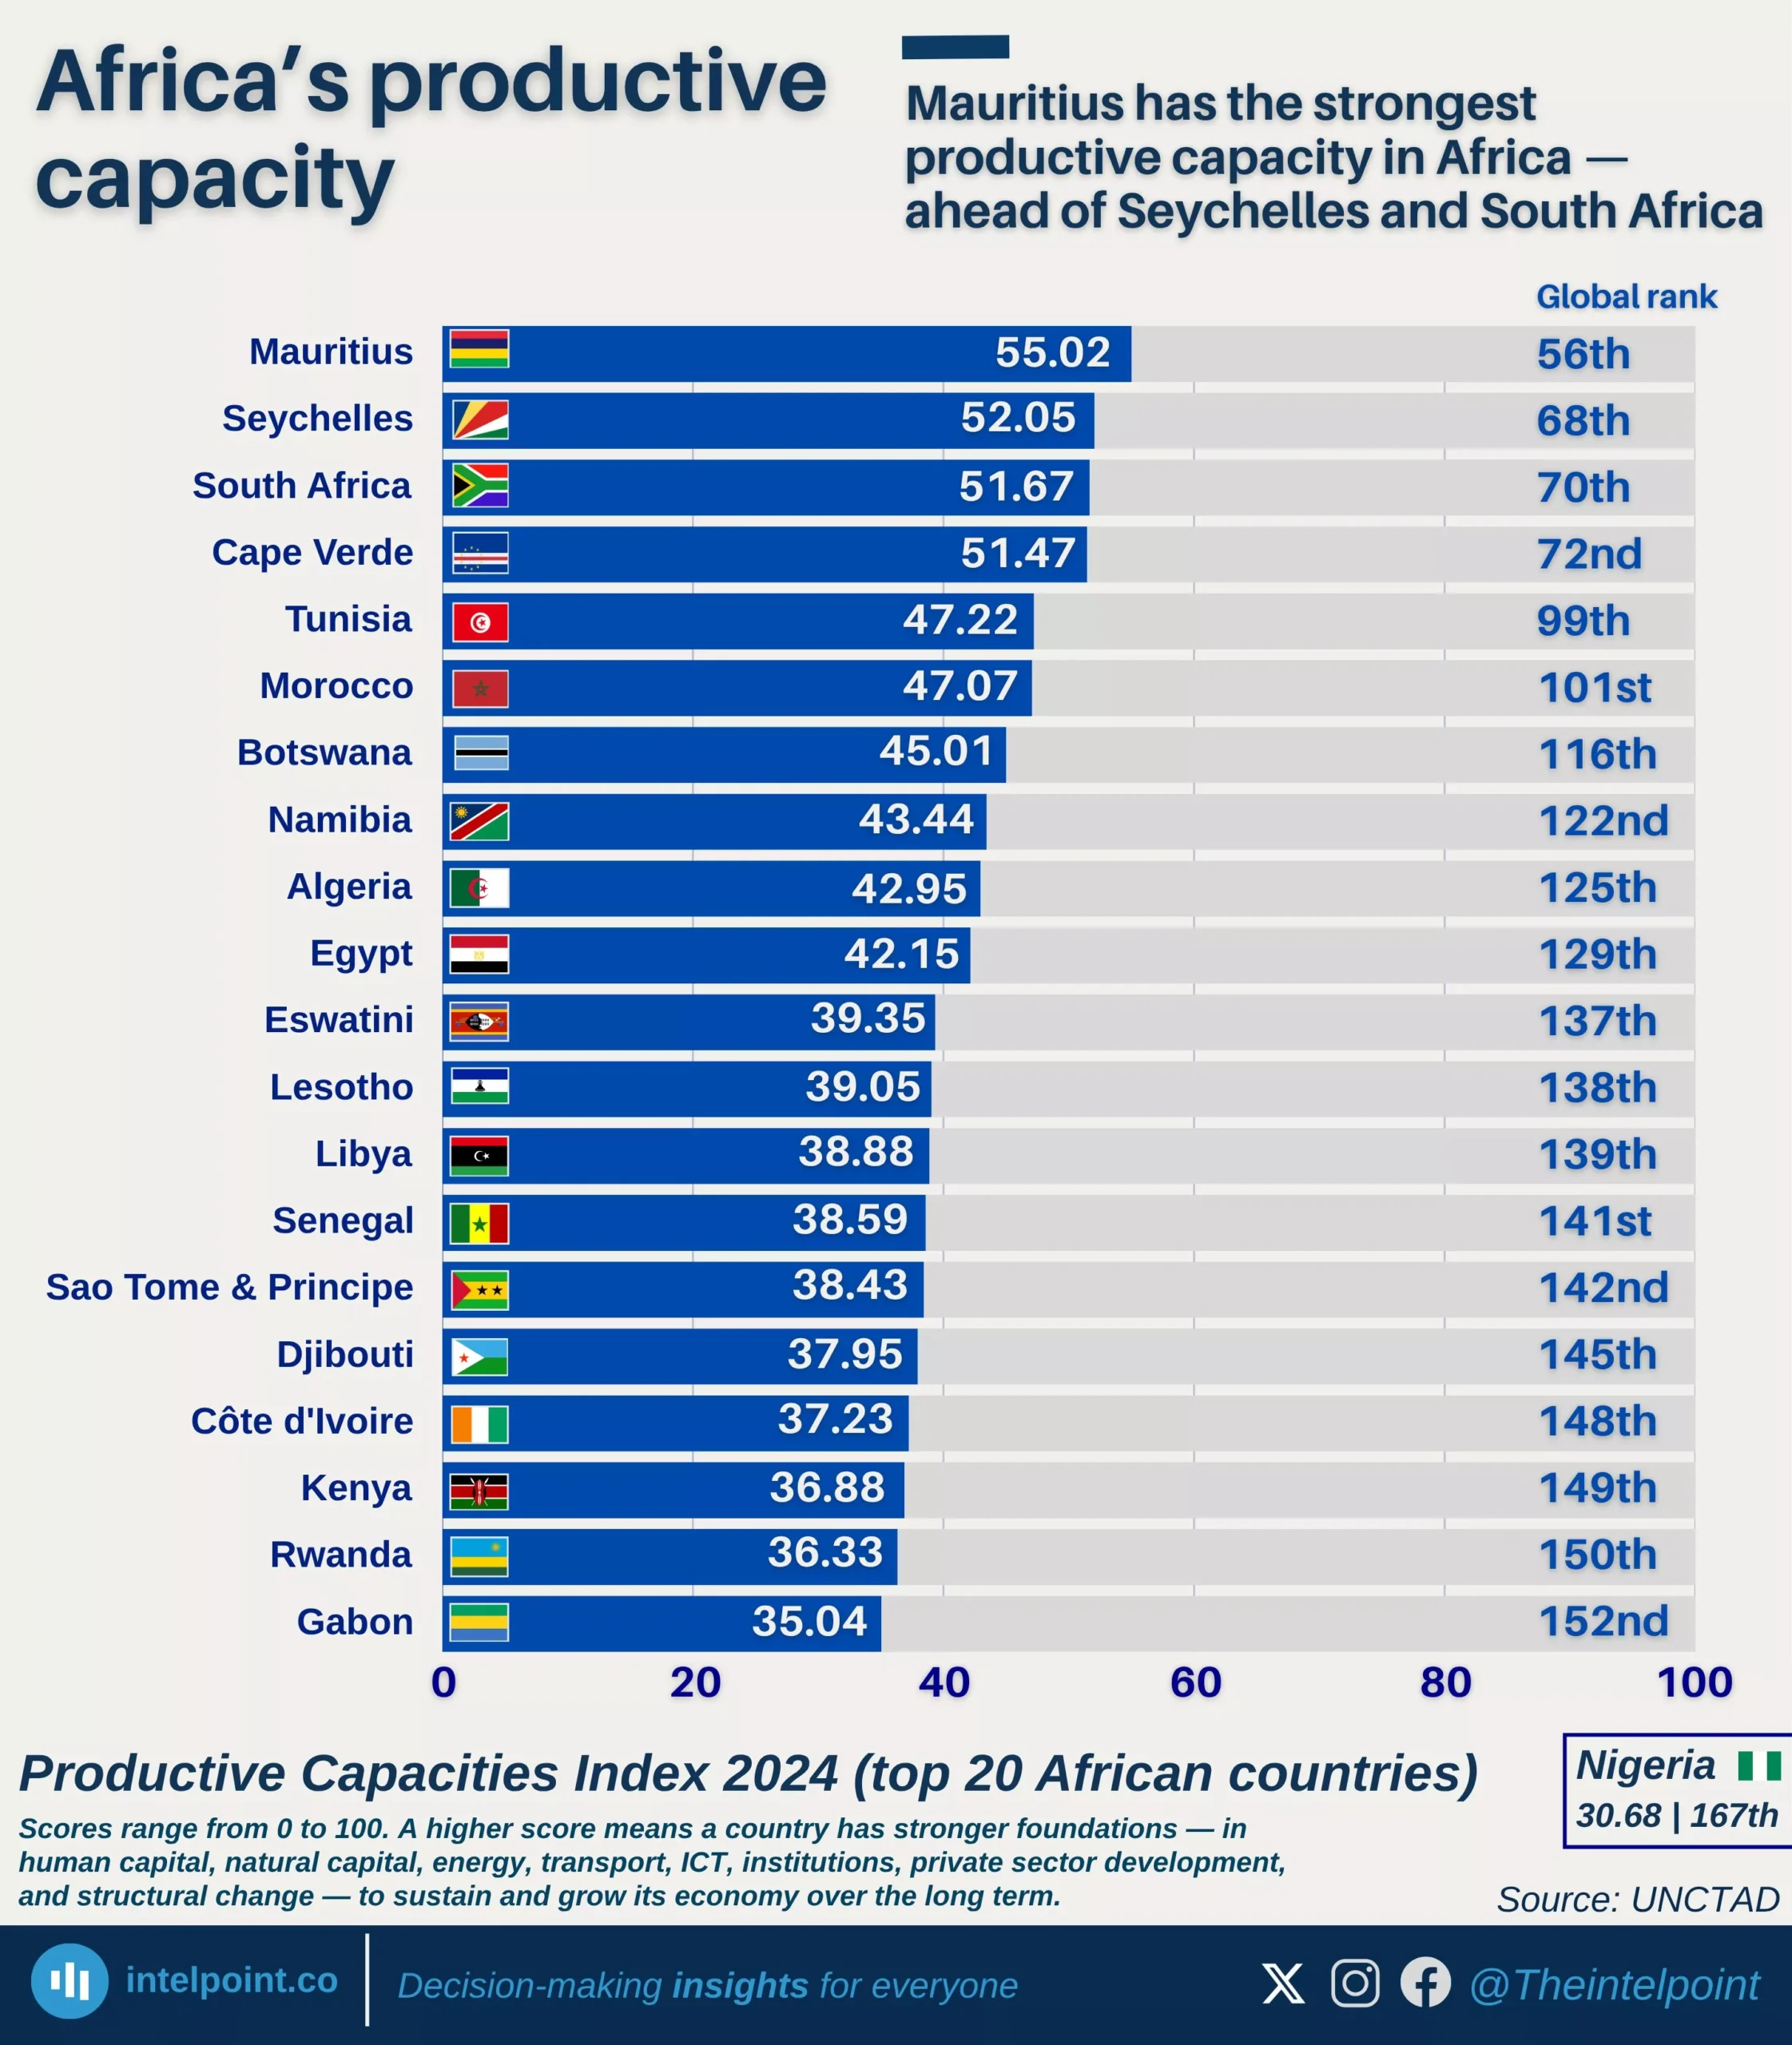
Mauritius has the strongest productive capacity in Africa — ahead of Seychelles and South Africa
  • Mauritius leads Africa on the Productive Capacities Index with a score of 55.02, ranking 56th globally.
  • Seychelles, South Africa, and Cape Verde complete Africa’s top four, but none enters the global top 50.
  • Nigeria ranks much lower at 167th globally, with a score of 30.68, despite being one of Africa’s largest economies.
  • The ranking shows that economic size does not always translate into stronger productive foundations like human capital, ICT, energy, transport, and institutions.

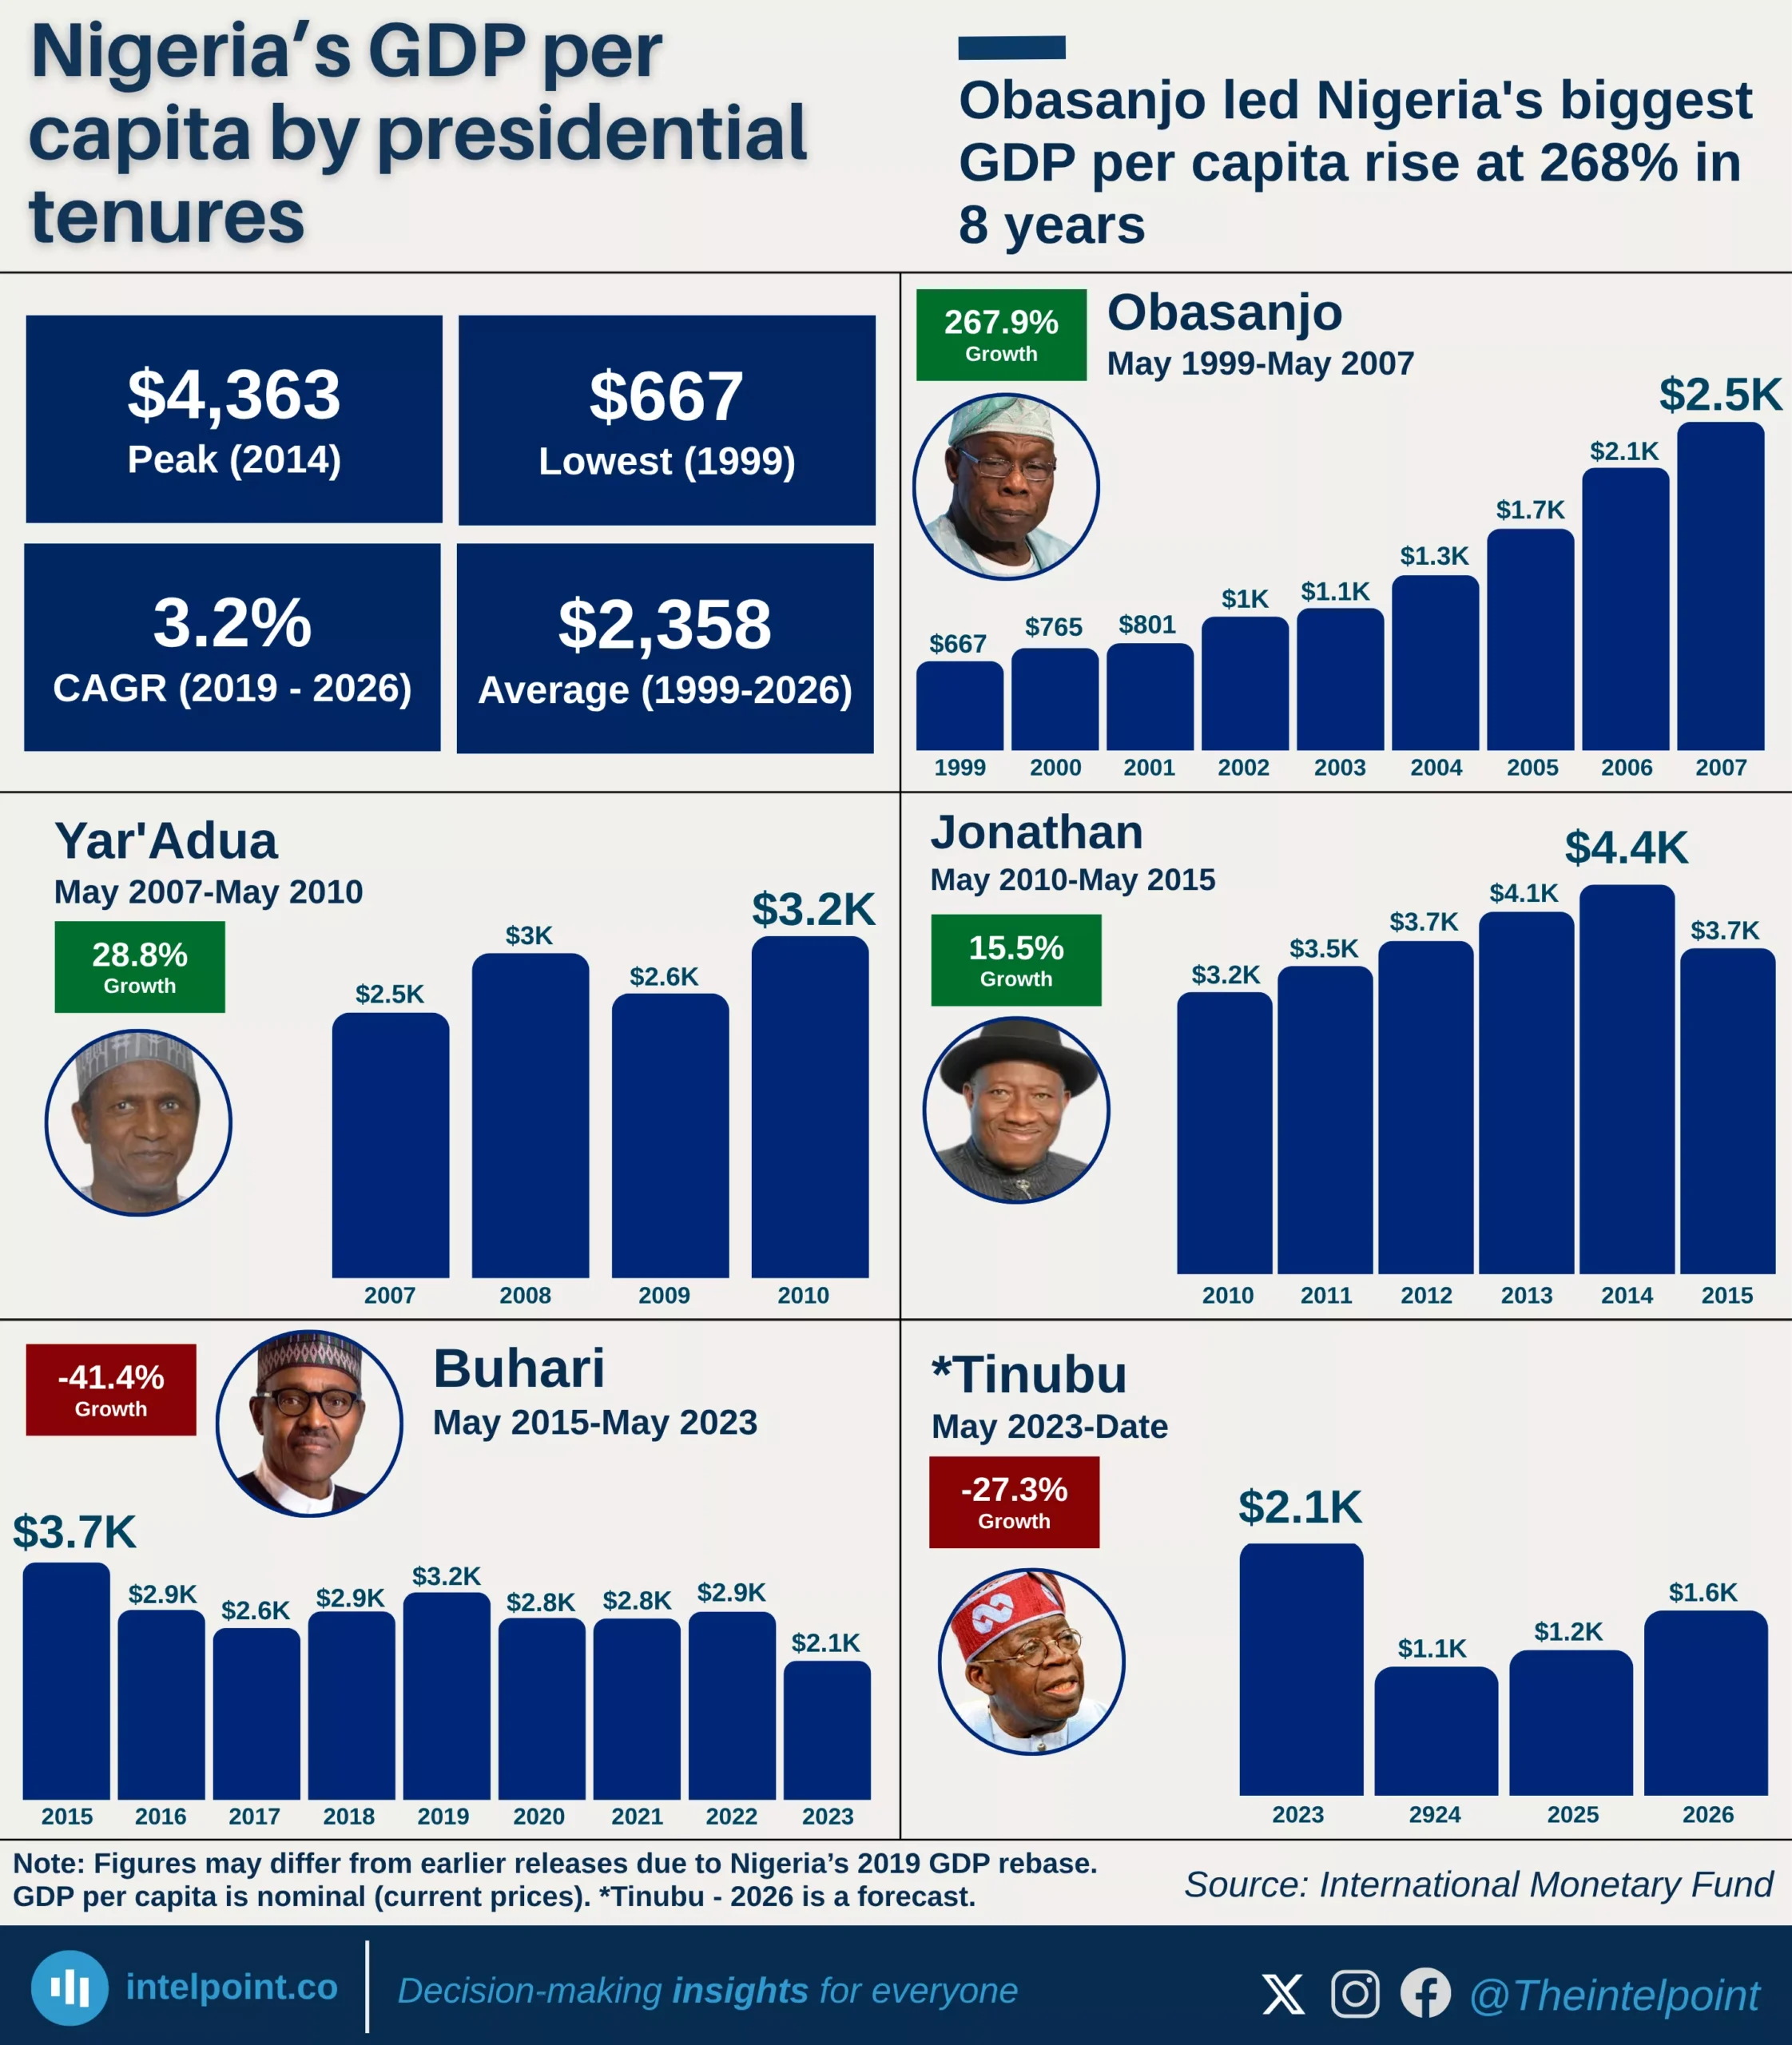
Obasanjo led Nigeria's biggest GDP per capita rise at 268% in 8 years
  • Nigeria’s GDP per capita rose strongly from 1999 to 2014, then reversed.
  • The 2014 peak remains the defining turning point.
  • Obasanjo’s years show the fastest sustained climb from a very low base.
  • Yar’Adua’s short tenure still maintained upward momentum.
  • Jonathan’s period delivered the peak level, not the fastest growth rate.
  • Buhari’s tenure marks the longest clear decline in GDP per capita.
  • Tinubu’s period begins with another sharp fall.

POPULAR TOPICS
SIGN UP TO OUR NEWSLETTER
Get periodic updates about the African startup space, access to our reports, among others.
Subscribe Here
Subscription Form

A product of Techpoint Africa. All rights reserved