Bite-sized Insights about
 
Providing you with data-based insights about things happening around you.
Popular Insights
  • In Q4 2023, Spectranet maintained its top position as Nigeria's biggest internet service provider with nearly 114k active subscribers, holding 43% of the market share. FiberOne followed with 10% of the market.

    Starlink increased its subscriber base by 113% to claim the 3rd position with 9% of the market.

    Here are Nigeria's top internet service providers by active subscribers in Q4 2023.

    See more

    Nigeria's VAT revenue has grown every year since 2013, reaching ₦3.6 trillion in 2023. The amount collected in 2023 exceeded 2022’s by ₦1.13 trillion — a 45% increase.

    See more
  • A Trend of Adult literacy rates of African countries

    Between 2018 and 2021, adult literacy rates across African nations exhibited significant disparities. Seychelles and South Africa led with literacy rates of 96% and 95%, respectively, indicating a high proportion of literate adults. Conversely, Chad had the lowest literacy rate during this period.

    These statistics underscore the uneven progress in educational attainment across Africa, highlighting the need for targeted interventions to improve literacy in lower-performing nations.

    See more

    Inflation rate in Nigeria increased to 31.7% in February 2024. Nigeria has the 13th highest inflation rate out of 186 countries and territories as of February 2024.

    The data showcases Argentina leading with 276%, followed by Lebanon and Syria. Seven of the top fifteen are African.

    See more
  • Nigeria was the seventh most populous nation in the world in 2020, with 206.1 million people. Projected to reach a population of 401.3 million by 2050, Nigeria will rank third after India (1st) and China (2nd). According to Institut national d'études démographiques' projections, Nigeria, Ethiopia, DR Congo, Egypt, Tanzania, and Kenya will be among the world’s top 20 most populous countries by 2050.

    See more
    Top ten African countries by estimated number of films produced annually

    The Nigerian movie industry, mainly financed via public or private funding and international grants, produces the most films in Africa, yearly. Nigeria produced more than double the number of films that the Ghanaian and Kenyan movie industries produce annually.

    See more

  • Five of the top tep African countries with the largest gold reserves are North African

    Half of the top 10 African countries with significant gold reserves come from North Africa, with Algeria leading with 174 tonnes. Egypt and South Africa come in second and third with 126 tonnes and 125 tonnes, respectively. Algeria, Egypt, South Africa, and Libya hold the most significant gold reserves.

    See more
  • Only 10% of Nigerians earn above ₦100,000, according to the Nigerian Financial Services Market Report. This aligns with most reports about Nigeria, and it's in sharp contrast to the narratives online.
    See more
  • A Trend of Adult literacy rates of African countries

    Between 2018 and 2021, adult literacy rates across African nations exhibited significant disparities. Seychelles and South Africa led with literacy rates of 96% and 95%, respectively, indicating a high proportion of literate adults. Conversely, Chad had the lowest literacy rate during this period.

    These statistics underscore the uneven progress in educational attainment across Africa, highlighting the need for targeted interventions to improve literacy in lower-performing nations.

    See more

Other Insights
  • Landlight tariffs (20A and 60A), offered primarily in rural areas, are Eskom’s highest tariff rates and are exclusive to direct (non-local authority) customers.
  • The Homelight 20A Block 1 tariff, which applies to consumption between 0–350 kWh, is the lowest among Eskom’s tariffs.
  • Landlight tariffs carry higher rates because they exclude other fixed charges such as: Ancillary service charge (c/kWh), Network demand charge (c/kWh), Network capacity charge (R/POD/day), and Service charge (R/POD/day). This structure makes Landlight more suitable for rural or low-income areas, where simplifying cost recovery is necessary.
  • Eskom classifies its tariffs into the following categories:
    • Residential Tariffs (for household electricity supply): Homelight 20A, Homelight 60A, Homepower, and Homeflex
    • Urban Tariffs (for large industrial and commercial users): Megaflex, Miniflex, Nightsave Urban (Large and Small), Business Rate, Public Lighting, Transflex (rail), and Gen-Wheeling/Offset tariffs
    • Rural Tariffs (for agricultural, business, and residential customers in rural areas): Ruraflex, Nightsave Rural, Landrate, and Landlight
    • Municipal Tariffs (for municipalities purchasing in bulk and for municipal services like water pumps or offices): Municrate, Municflex, and Public Lighting.
  • Customers with rooftop solar PV systems are required to be on the Homeflex tariff plan, which is based on Time-of-Use (ToU) pricing.
  • Several Eskom tariffs are Time-of-Use-based, where charges vary depending on peak, standard, and off-peak periods. These include: Nightsave Urban Large, Nightsave Urban Small, Megaflex, Miniflex, Homeflex, Nightsave Rural, Ruraflex, and Ruraflex Gen
See more
  • Electricity distribution in South Africa reached its peak in 2018, a record high of 231 TWh.

  • The lowest electricity distribution was recorded in 2023, dropping to 206 TWh.

  • Load shedding has become a persistent challenge, with 2023 experiencing the highest number of load shedding days — 332 days in total.

  • Eskom accounts for about 80% of electricity distributed in South Africa.
See more
  • Just 16 out of 54 African countries have launched a national AI strategy.
  • Over 30 countries remain at the early or inactive stage with no clear roadmap.
  • Nigeria, Africa’s most populous nation, is still drafting its AI policy.
  • Leaders include Kenya, Egypt, Ghana, Algeria, Rwanda, and Senegal.
  • Most low-income and post-conflict states like Chad, Somalia, and South Sudan are far behind.
See more
  • Access Bank paid the highest total salaries in 2024, amounting to ₦357.6 billion.
  • Stanbic IBTC devoted the largest share of its revenue to salaries at 9.96%, despite a much lower total salary bill than Access or FirstHoldCo.
  • Zenith Bank had one of the highest salary bills (₦137.7 billion) but spent the smallest portion of its revenue on staff at just 3.47%.
  • Wema Bank, though paying the lowest in total salaries (₦33.8 billion), had one of the highest salary-to-revenue ratios at 7.81%.
  • FirstHoldCo, with ₦229.1 billion in staff costs, maintained a moderate salary-to-revenue ratio of 7.14%.
  • The gap between total salary spend and salary-to-revenue ratios reveals more about each bank’s internal cost structure.
See more
  • Access Bank led all Nigerian banks with ₦4.9T in gross earnings in 2024, nearly doubling its 2023 performance.
  • FirstHoldCo saw a sharp rise in earnings to ₦3.2T in 2024
  • Zenith Bank grew consistently, crossing the ₦4T mark in 2024 from ₦1T in 2022, showing strong operational expansion.
  • Wema Bank, despite being the smallest, quadrupled its earnings over two years, from ₦0.1T to ₦0.4T.
  • Fidelity and FCMB nearly tripled their gross earnings between 2022 and 2024, showing rising momentum among mid-tier banks.
See more
 
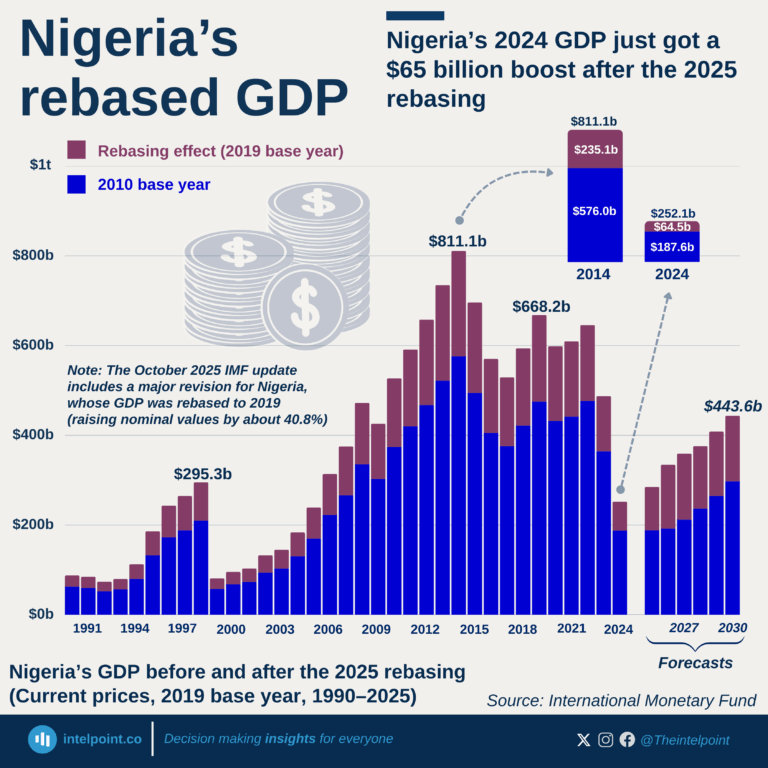
  • Real GDP grew from ₦205.1 trillion in 2019 to ₦217.8 trillion in 2024, a modest 6% rise.
  • Nominal GDP jumped from ₦205.1 trillion to ₦372.8 trillion over the same period, an 82% increase.
  • The gap between nominal and real GDP widened sharply after 2021, reaching ₦155 trillion in 2024.
  • Nominal GDP has grown year-on-year, with the steepest jump between 2023 (₦314.0 trillion) and 2024 (₦372.8 trillion).
  • Inflationary pressures have driven nominal gains, masking subdued real economic expansion.
See more
  • FirstBank's planned headquarters will have 43 floors, nearly double UBA‌'s HQ.
  • Among the five FUGAZ banks, three currently have headquarters with 15 floors or fewer.
  • FirstBank’s existing HQ has only 15 floors, showing how big the planned leap is.
  • UBA’s HQ in Marina leads the pack among existing HQs, with 23 floors, followed by Access Bank with 16 floors.
  • The new FirstBank property in Eko Atlantic will be the tallest bank HQ in Nigeria by a wide margin when completed.
See more
  • Eskom’s average electricity tariff increased by approximately 162% between 2013/14 and 2023/24.
  • Tariffs are categorized into two groups based on distribution: Local Authority Tariffs and Non-Local Authority Tariffs.
  • Landlight Tariff (Non-Local Authority category) is the highest rate and in 2023/24 it stood at 608.61 c/kWh.
  • Homelight 20A (Block 1) is the lowest tariff also in the non-local authority category, at 168.78 c/kWh in 2023/24.
  • Eskom applies Time-of-Use (ToU) pricing, where tariffs vary by Time of day (peak, standard, off-peak periods) and Demand season (high-demand season: June to August and Low-demand season: September to May)

See more
  • Jewellery demand made up 81.35% of Egypt’s total gold demand between 2010 and 2024.
  • The highest jewellery demand was recorded in 2010 at 53 tonnes, and no year since has reached that level.
  • Jewellery demand declined by 50.75% between 2010 and 2024.
  • Bar and coin demand saw a sharp 700% increase between 2021 and 2022.
  • In 2023, bar and coin demand hit a record high of 30.3 tonnes and, for the first time, exceeded jewellery demand.
  • Overall, bar and coin demand rose by 943.48% between 2010 and 2024.
See more
  • The North Central zone accounts for the highest share of road accidents in Nigeria, contributing 34.55% of the national total.
  • Within the North Central zone, Abuja (FCT) recorded the most accidents, with a cumulative total of 8,133 cases.
  • The South West zone ranks second, responsible for 25.78% of all accidents nationwide, with Ogun State leading the zone at 6,418 accidents.
  • The South East zone has the lowest share, contributing just 5.38% of total accidents from Q2 2020 to Q2 2024.
  • Enugu State, the highest contributor within the South East, accounts for only 1.59% of the national total.
See more
  • Venezuela and Iran offer diesel at nearly free prices, charging just $0.004 and $0.006 per litre respectively, the lowest globally.
  • Libya leads Africa with diesel priced at only $0.028 per litre, making it the third cheapest worldwide.
  • Six African countries—Libya, Algeria, Egypt, Angola, Nigeria and Sudan—feature in the global top 20 for the lowest diesel prices.
  • Nigeria ranks 17th globally, with diesel priced at $0.658 per litre, despite recent subsidy removals and price hikes.
See more
  • Over six MPC meetings from February to November 2024, the MPR rose cumulatively by 875 basis points, ending the year at 27.5%.
  • The pace of increases slowed after March: from 200 bps (Feb–Mar) to just 25 bps (Sept–Nov), reflecting a tapering hike strategy.
  • Since November 2024, the CBN has maintained the rate at 27.5% across four consecutive MPC meetings into July 2025.
  • The 2024 cycle was dominated by aggressive rate hikes aimed at stabilising inflation and exchange rate volatility.
  • The CBN’s interest rate strategy appears more restrained in 2025, indicating a possible pause phase in the monetary policy cycle.
See more
1 10 11 12 13 14 100
  • South Africa’s GDP per capita rose from $440 in 2000 to an all-time high of $2,692 in 2024.
  • Growth was relatively steady in the 2000s, with notable jumps after 2006 and again in the post-pandemic years.
  • Despite dips in 2008 (global financial crisis) and 2020 (COVID-19 shock), the economy showed resilience with quick rebounds.
  • By 2024, South Africa achieved its strongest per capita GDP on record, cementing its role as one of Africa’s leading middle-income economies.
  • The country recorded growth in 21 of the past 24 years.
Read more
  • Algeria’s GDP per capita more than tripled in 25 years, rising from $1,772.9 in 2000 to $5,631.2 in 2024.
  • The 2000s boom saw rapid growth, peaking at $5,180.9 in 2008, fuelled by high oil and gas prices.
  • Between 2014 and 2016, GDP per capita fell from $6,094.7 to $4,425.0, reflecting oil price collapses and domestic fiscal strain.
  • After pandemic-era lows in 2020 ($3,743.5), Algeria rebounded to its second-highest level on record in 2024 ($5,631.2), regaining its regional standing.
Read more
  • Egypt’s GDP per capita grew from $1,366 in 2000 to $3,339 in 2024, a 144% increase over 25 years.
  • The economy peaked at $4,233 in 2022, marking the highest point in the series before a two-year decline.
  • Sustained growth was driven by the 2000s and 2010s, with resilience after the 2008 financial crisis and Arab Spring disruptions.
  • The dip after 2022 reflects external pressures, currency adjustments, and inflationary challenges, though per capita levels remain well above early 2000s baselines.
Read more
  • The United States dominates global natural gas production in 2024, contributing 1.03 trillion cubic metres (Tcm), nearly one-quarter of the world’s total.

  • Russia (0.63Tcm) and Iran (0.26Tcm) follow as the second and third largest producers.

  • China (0.25Tcm) and Canada (0.19Tcm) also feature strongly, rounding out the top five producers.

  • Collectively, these top five countries account for more than 50% of global production.

  • Emerging producers like Nigeria, Egypt, and Azerbaijan contribute significantly to the supply but remain far behind the leading nations.

Read more
  • Burundi recorded its highest GDP per capita in 2015 ($280.97).

  • By 2024, GDP per capita dropped to $153.93, a decline of nearly 45% from its peak.

  • Burundi’s population exceeds 13 million (2024), which dilutes income per person even when overall GDP grows.

  • Structural challenges like limited industrialization, reliance on subsistence farming, and political instability contribute to stagnation.

  • Since 2015, Burundi has held the lowest GDP per capita in Africa—and at $153.9 in 2024, it is the poorest country in the world by GDP per capita.

Read more
  • Zimbabwe’s GDP per capita nearly quintupled since 2000, marking a 472% increase over 25 years.
  • The country's GDP per capita declined consistently from 2001 to 2008.
  • It soared to $3,448.1 in 2017, which is still the highest in the country's history.
  • The GDP per capita plummeted to $2,271.9 in 2019, recording a (34.1%) decrease.
Read more
1 10 11 12 13 14 199

Can’t find what you’re looking for? Please fill the form below
Contact Form Demo
SIGN UP TO OUR NEWSLETTER
Get periodic updates about the African startup space, access to our reports, among others.
Subscribe Here
Subscription Form

A product of Techpoint Africa. All rights reserved