Nigeria's manufacturing sector contributed 9.2% (₦3.37 trillion) to the total GDP in H1 2024, mainly driven by food, clothing, and cement, which make up a combined 79.5% of the sector's GDP.
Smaller sectors like Non-Metallic Products, Wood & Wood Products, and Motor Vehicles & Assembly could expand with targeted investments. The minimal impact of Oil Refining and Electrical & Electronics underscores the need for diversification.
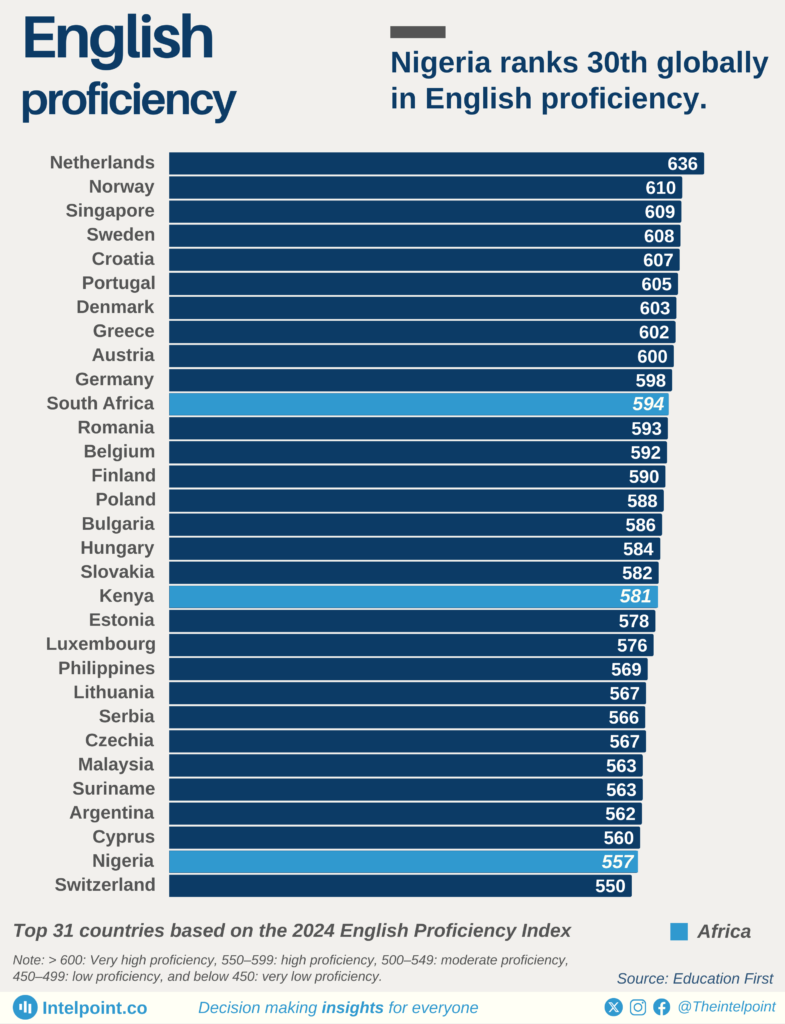
Nigeria occupies the 30th spot globally in the English Proficiency Index, achieving a score of 557, just behind Kenya (581) and South Africa (594). As one of Africa's linguistic leaders, this ranking highlights Nigeria’s strength in English proficiency, a vital skill driving communication, business, and education across the continent.
This data comes from the EF English Proficiency Index, which aggregated the test results of 2.2m adults from 113 countries and regions. Countries where English is the primary native spoken language are not included in this ranking. Ranks are determined by each country’s average score in the EF Standard English Test (EF SET).

The 2024 Global Peace Index reveals a decline in peacefulness in 97 countries, the highest since the index began.
Nigeria is among the nations affected by regional conflicts and rising violence. With a peace index score of 2.91, Nigeria is facing increasing challenges.
A deteriorating peace score impacts foreign investment and economic stability. Global economic losses due to violence reached $19.1 trillion in 2023.

Between 2018 and 2021, adult literacy rates across African nations exhibited significant disparities. Seychelles and South Africa led with literacy rates of 96% and 95%, respectively, indicating a high proportion of literate adults. Conversely, Chad had the lowest literacy rate during this period.
These statistics underscore the uneven progress in educational attainment across Africa, highlighting the need for targeted interventions to improve literacy in lower-performing nations.

Nigeria was the seventh most populous nation in the world in 2020, with 206.1 million people. Projected to reach a population of 401.3 million by 2050, Nigeria will rank third after India (1st) and China (2nd). According to Institut national d'études démographiques' projections, Nigeria, Ethiopia, DR Congo, Egypt, Tanzania, and Kenya will be among the world’s top 20 most populous countries by 2050.

Nigeria was the seventh most populous nation in the world in 2020, with 206.1 million people. Projected to reach a population of 401.3 million by 2050, Nigeria will rank third after India (1st) and China (2nd). According to Institut national d'études démographiques' projections, Nigeria, Ethiopia, DR Congo, Egypt, Tanzania, and Kenya will be among the world’s top 20 most populous countries by 2050.
The 2024 Global Peace Index reveals a decline in peacefulness in 97 countries, the highest since the index began.
Nigeria is among the nations affected by regional conflicts and rising violence. With a peace index score of 2.91, Nigeria is facing increasing challenges.
A deteriorating peace score impacts foreign investment and economic stability. Global economic losses due to violence reached $19.1 trillion in 2023.
Key Takeaways:
Key Takeaways:
Key takeaways:
Key takeaways:
Key takeaways: