Nigerian passport mobility score

Key Takeaways

  • The mobility score improved dramatically from 42 in 2015 to 56 in 2023, highlighting a significant enhancement in travel freedom for Nigerian passport holders.
  • A sharp decline occurred in 2020, dropping to 44, likely reflecting global travel disruptions due to the COVID-19 pandemic.
  • Post-pandemic recovery is evident in the score rebounding to 48 in 2021 and surging to 54 by 2022, surpassing pre-pandemic levels.
  • The overall trend shows a steady upward trajectory from 2017 onward, suggesting successful diplomatic and policy initiatives aimed at expanding visa-free travel.

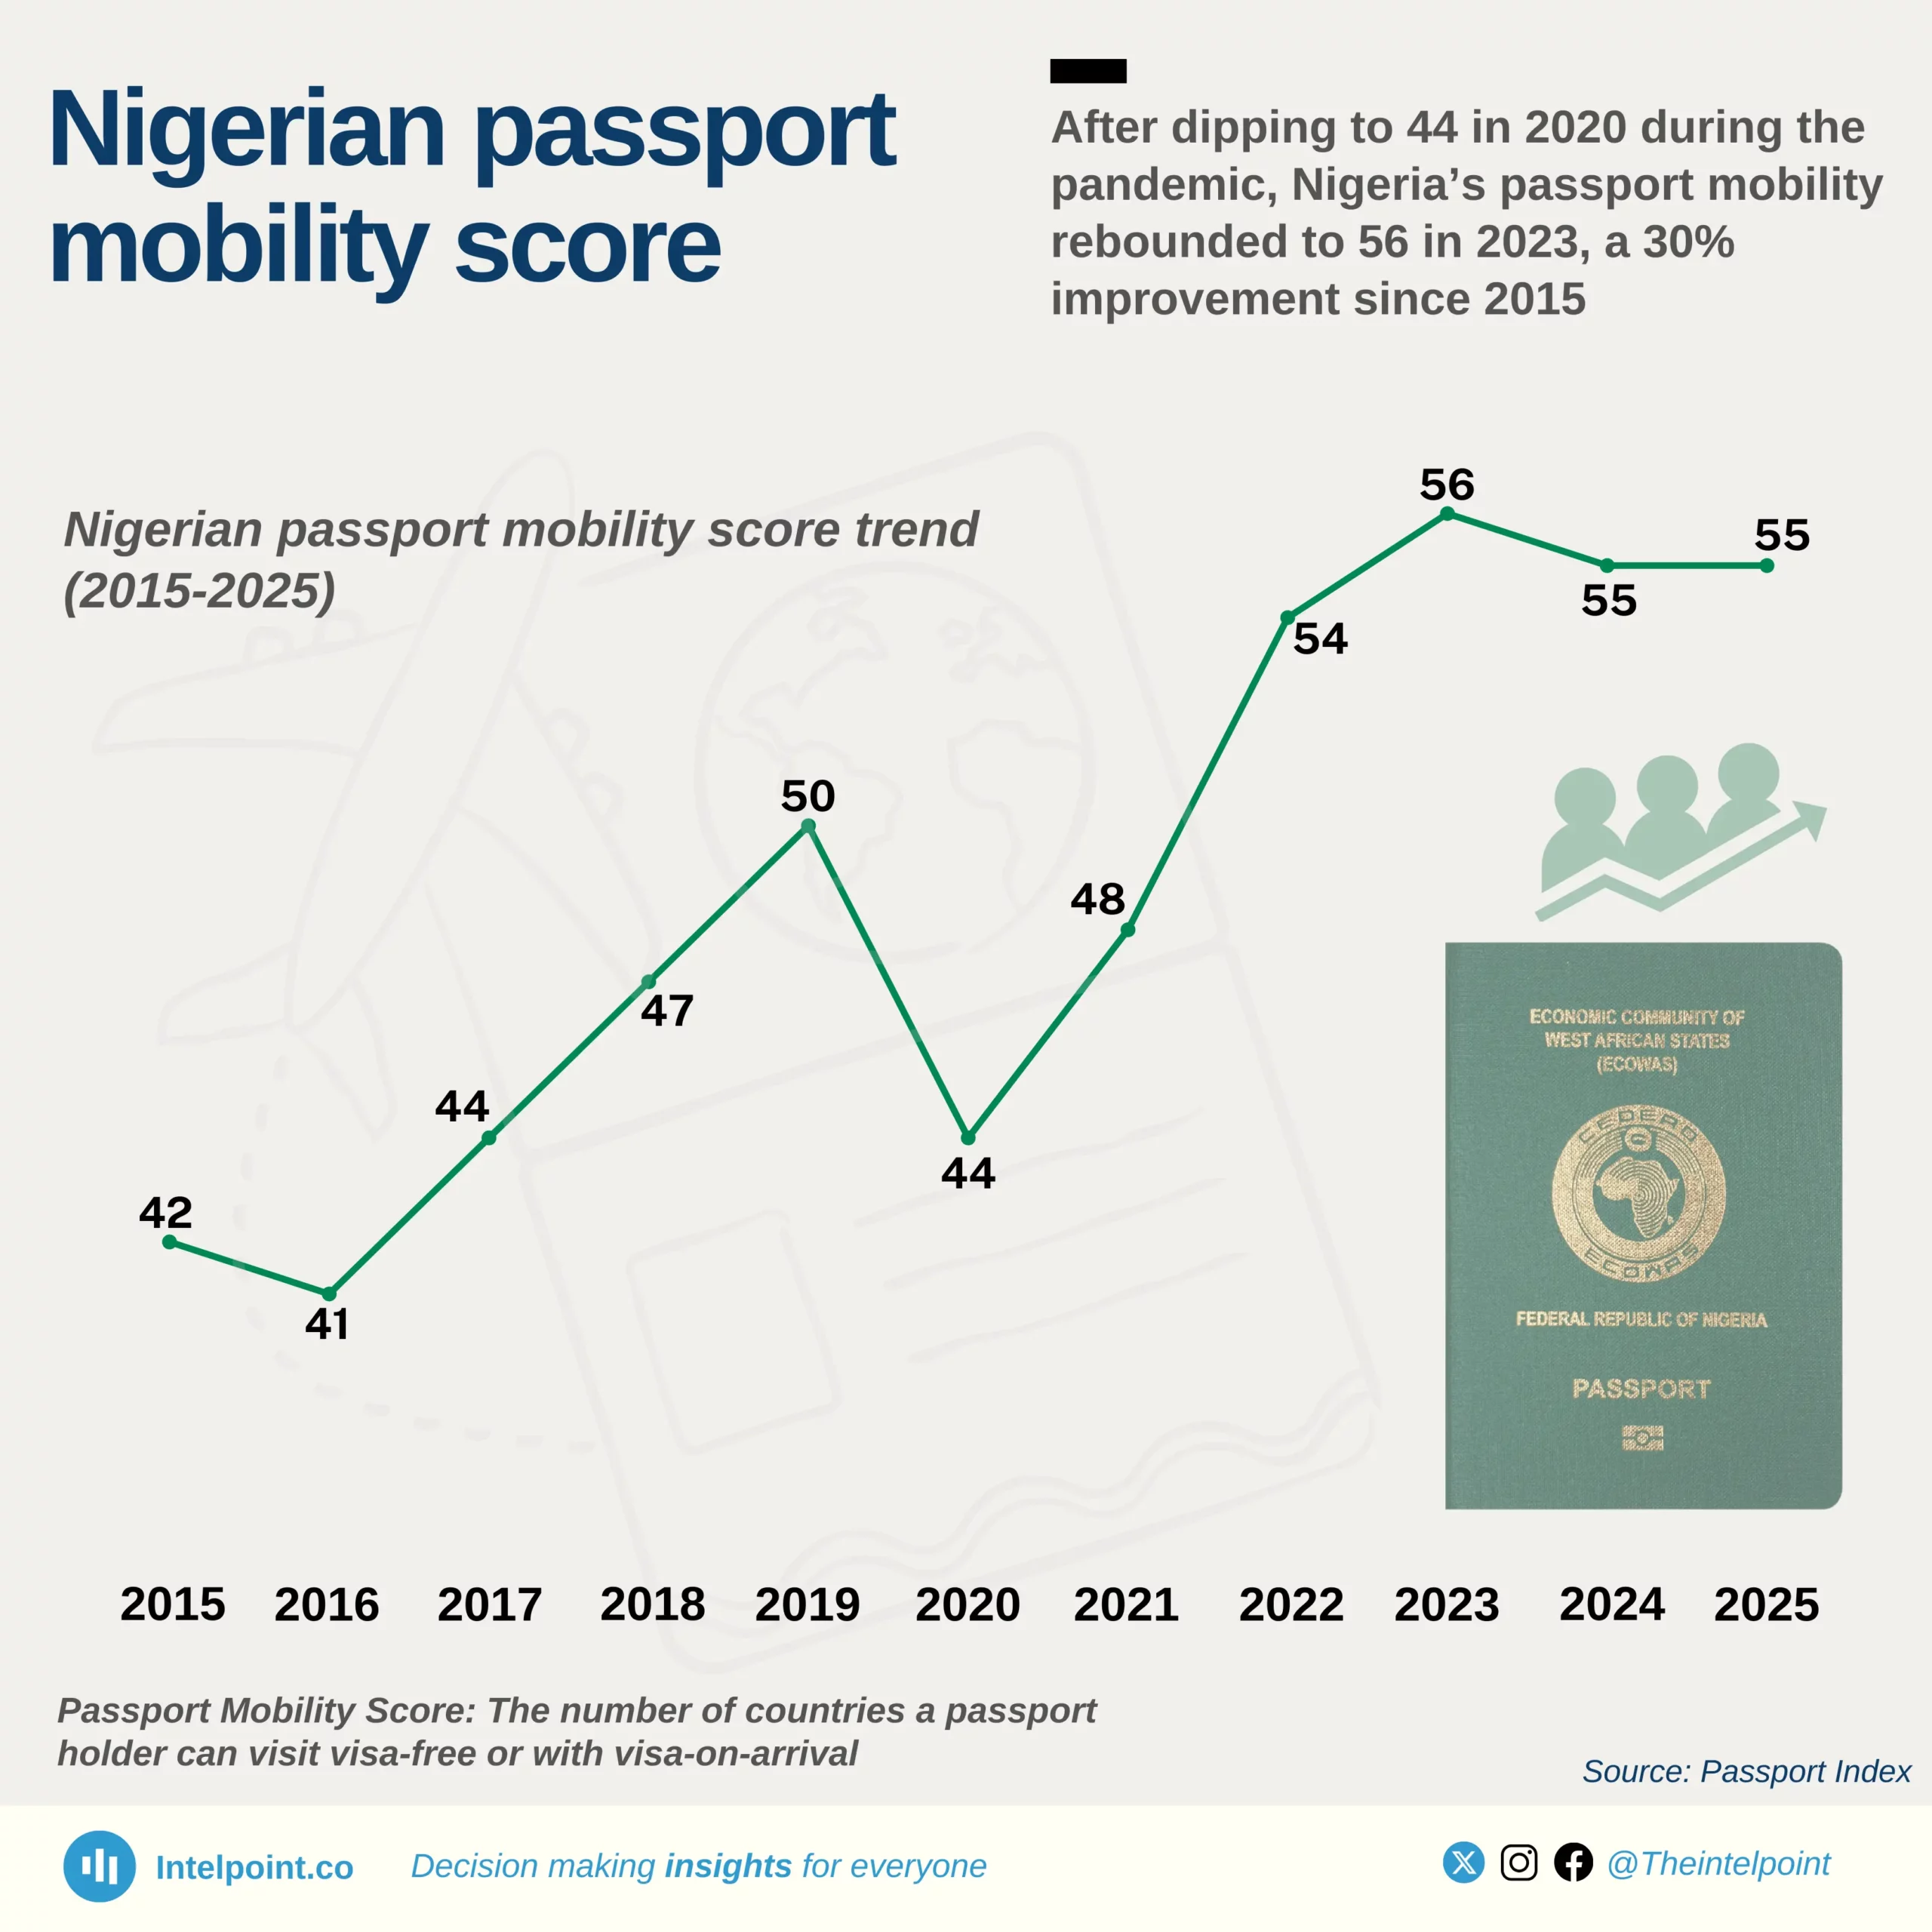
Nigeria’s passport mobility has seen notable shifts over the past decade, reflecting changes in global travel dynamics and diplomatic efforts. In 2015, the mobility score stood at 42, experiencing a slight dip to 41 in 2016 before climbing steadily to 50 by 2019. However, the COVID-19 pandemic in 2020 led to a sharp decline, dropping the score back to 44 as global travel restrictions tightened.

Post-pandemic recovery began in 2021, with the score rebounding to 48, followed by a strong surge to 54 in 2022. This upward momentum peaked in 2023 at 56, marking the highest recorded mobility score in the dataset. Despite a slight stabilisation at 55 in 2024 and 2025, the overall trend shows a significant improvement, with Nigerian passport holders gaining access to more destinations over time.

From 2015 to 2025, the mobility score increased by 31%, underscoring enhanced international partnerships and improved visa agreements. While challenges such as global crises can impact travel freedom, Nigeria’s steady recovery highlights progress in global mobility access for its citizens.

Source:

Passport Index

Period:

2025
HTML code to embed chart
Want a bespoke report?
Reach out
Tags
Related Insights

Lagos leads VAT remittance with ₦305B, over 53% of total and more than 3x Rivers'
  • Lagos State contributed ₦305B in VAT, making up over 53% of the national total and more than three times that of any other state.
  • Rivers (₦90B) and Oyo (₦27B) followed Lagos as the second and third highest contributors, highlighting a steep drop after the top state.
  • Only a few states, including Bayelsa, Kano, Kwara, and Edo, remitted above ₦5B, showing a highly uneven distribution of VAT contributions.
  • Over 8 states, such as Kebbi, Osun, Imo, and Zamfara, contributed less than ₦2B each, indicating minimal VAT activity in many parts of the country.

Kano leads all Nigerian states with 44 LGAs; FCT, Bayelsa, and Nasarawa have the fewest with 6, 8, and 13 respectively
  • Kano State has the highest number of LGAs in Nigeria, with 44, far exceeding the national average of 21 LGAs per state.
  • Bayelsa, Nasarawa, and the FCT have the fewest LGAs, recording 8, 13, and 6 respectively, despite varying population sizes and landmass.
  • Northern states dominate the upper tier of the LGA count, with Katsina (34), Oyo (33), and Jigawa (27) all ranking among the top.
  • Southern states tend to have fewer LGAs, with Lagos and Ogun, two highly urbanised states, having just 20 LGAs each, hinting at a denser governance structure per area.

South west leads with Lagos recording 114 female candidates, while the North East trails with just 7 in Yobe
  • Lagos had the highest female representation in Nigeria’s 2023 elections, with 114 female candidates, more than any other state.
  • Yobe recorded the lowest, with just 7 female candidates, highlighting a wide disparity in representation across regions.
  • The South East and South South zones recorded some of the strongest numbers overall, with Imo (86) and Rivers (85) nearly matching Lagos.
  • The South West led overall in female candidate numbers, while the North East trailed, with its highest (Gombe – 42) still lower than other zones’ peaks.

The South-West remitted ₦341.18B in VAT but received only ₦106.85B, getting back just ₦0.31 for every ₦1 remitted.
  • Lagos carried the South-West VAT burden, remitting ₦305.52B (89.6% of the region's total) but receiving only ₦62.59B (20.5% return), making it the highest net contributor in Nigeria.
  • Osun had the most disproportionate gain, remitting a mere ₦590M but receiving ₦7.73B, an astronomical 1,211% return—the highest redistribution gain in the South-West.
  • The entire South-West remitted ₦341.18B but received only ₦106.85B, meaning it got back just ₦0.31 for every ₦1 contributed, highlighting a severe VAT allocation imbalance.
  • Ondo and Ogun remitted only ₦3.3B but received ₦16B combined, far exceeding their generated VAT, while Lagos alone subsidised most of the allocations across the country.

Abia State generated just 1.9% of the South-East’s VAT revenue but took home 18.6% of the total the region received
  • The South-East remitted ₦10.94 billion in VAT but received ₦39.15 billion, a 257.7% increase, showing a high reliance on VAT sharing.
  • Abia, the lowest contributor (₦734M), received ₦7.29B, nearly 10× its remittance, making it the biggest relative beneficiary in the region.
  • Anambra, the highest contributor (₦3.56B), received only ₦8.72B, showing a sharing trend where high-contributing states do not necessarily receive the most.
  • Every South-East state received at least 2× what they remitted, with an average allocation of ₦7.83B despite an average contribution of just ₦2.19B.

Zamfara, the lowest contributor, received over 5× its input, while Kano, the highest contributor, had the lowest relative gain
  • The North-West region received ₦66.55 billion, more than double its remittance (₦28.31B), showing a heavy reliance on federal VAT sharing.
  • Zamfara, the lowest contributor (₦1.45B), received the highest percentage gain (+433%), getting ₦7.72B, while Kano, the highest contributor (₦9.59B), had the smallest relative gain (+41.5%).
  • Kaduna and Katsina, despite remitting ₦3.50B and ₦3.86B, received ₦10.18B and ₦10.01B, respectively, nearly tripling their remittance.
  • Kano remitted 34% of the zone’s VAT but received only 20.4% of the total allocation, reinforcing that VAT is distributed based on equality and not economic strength.

POPULAR TOPICS
SIGN UP TO OUR NEWSLETTER
Get periodic updates about the African startup space, access to our reports, among others.
Subscribe Here
Subscription Form

A product of Techpoint Africa. All rights reserved