Bite-sized Insights about
 
Providing you with data-based insights about things happening around you.
Popular Insights
  • Nigeria ranked 2nd after India in Chainalysis' 2023 Global Crypto Adoption Index. However, it ranked 1st in the peer-to-peer (P2P) exchange trade volume sub-index, which has 6 other African countries in the top 10. Here are the leading countries in P2P crypto trading volume.

    See more

    The African countries with the highest life expectancies as of 2023 are: Algeria - 77 years, Tunisia - 77 years, Cape Verde - 77 years, Mauritius - 76 years.

    The African countries with the lowest life expectancies: Central African Republic - 55 years, Lesotho - 55 years, Nigeria - 54 years, Chad - 54 years.

    See more
  • The 2024 Global Peace Index reveals a decline in peacefulness in 97 countries, the highest since the index began.

    Nigeria is among the nations affected by regional conflicts and rising violence. With a peace index score of 2.91, Nigeria is facing increasing challenges.

    A deteriorating peace score impacts foreign investment and economic stability. Global economic losses due to violence reached $19.1 trillion in 2023.

    See more

    The FAAC's revenue distribution from 2017 to August 2023 highlights the dominance of Delta, Akwa Ibom, Rivers, and Bayelsa states in allocations. Despite Lagos' economic prominence, it ranked fifth. Here is the distribution of revenue among states between 2017 and August 2023.

    See more
  • A Trend of Adult literacy rates of African countries

    Between 2018 and 2021, adult literacy rates across African nations exhibited significant disparities. Seychelles and South Africa led with literacy rates of 96% and 95%, respectively, indicating a high proportion of literate adults. Conversely, Chad had the lowest literacy rate during this period.

    These statistics underscore the uneven progress in educational attainment across Africa, highlighting the need for targeted interventions to improve literacy in lower-performing nations.

    See more

    Nigeria was the seventh most populous nation in the world in 2020, with 206.1 million people. Projected to reach a population of 401.3 million by 2050, Nigeria will rank third after India (1st) and China (2nd). According to Institut national d'études démographiques' projections, Nigeria, Ethiopia, DR Congo, Egypt, Tanzania, and Kenya will be among the world’s top 20 most populous countries by 2050.

    See more

  • In addition to having one of the lowest populations on the continent, Mauritius boasts the greatest broadband penetration rate — 147.39% as of 2022 — of any country in Africa. The eastern African nation's broadband Internet subscribers surpassed its population in 2019.

    See more
  • MTN Nigeria has dominated the country's telecommunications market over the years, accounting for the largest market share. All four operators, apart from 9mobile, recorded a significant increase in their subscriber base between May 2014 and March 2024.

    See more
  • The 2024 Global Peace Index reveals a decline in peacefulness in 97 countries, the highest since the index began.

    Nigeria is among the nations affected by regional conflicts and rising violence. With a peace index score of 2.91, Nigeria is facing increasing challenges.

    A deteriorating peace score impacts foreign investment and economic stability. Global economic losses due to violence reached $19.1 trillion in 2023.
    See more

Other Insights
     
  • The Netherlands has mostly been the top European import source, with Nigeria averaging 20% of annual imports from the region.
  • Netherlands' highest share of Nigeria's imports was 27.9% in 2018.
  • The United Kingdom consistently contributed around 5–15% of Nigeria’s European imports.
  • Germany’s share remained relatively stable at 5–10% over the years.
  • France, Italy, and Spain maintained smaller shares, mostly under 7%.
See more
         
  • Imports have consistently exceeded 85% of Nigeria's manufactured goods trade since 2017.
  • In H1 2025, imports accounted for 93.3% of the total ₦16.5 trillion trade.
  • Nigeria’s export share in the manufactured goods trade was only 6.7% in H1 2025.
  • The highest export share in the past eight years was 14.8% in 2019.
  • Total manufactured goods trade grew from ₦4.9 trillion in 2017 to ₦29.1 trillion in 2024.
See more
     
  • Nigeria’s food and beverage imports increased almost ninefold, from ₦0.7 trillion in 2013 to ₦6.6 trillion in 2024.
  • Imports remained relatively stable between 2015 and 2019, averaging around ₦1.1–₦1.6 trillion.
  • A major spike occurred in 2021, when imports surged by 62%, reaching ₦2.9 trillion.
  • Overall, the trend underscores Nigeria’s ongoing challenge of reducing dependency on imported food and beverages despite policies aimed at self-sufficiency.
See more
     
  • Nigeria imported a total of ₦60.6 trillion worth of goods in 2024.
  • Fuels and lubricants dominated imports with ₦22.7 trillion (37.4%).
  • Industrial supplies accounted for ₦13.4 trillion (22.1%), showing strong demand for production inputs.
  • Capital goods and parts represented ₦9.1 trillion (15%).
  • Food and beverage imports reached ₦6.6 trillion (10.9%), signalling a high reliance on external food sources.
See more
     
  • ECOWAS’s share of Nigeria’s African imports grew to 32.4% in H1 2025, up from 15.0% in 2021.
  • The lowest ECOWAS import share was recorded in 2014 (8.8%), showing significant progress since then.
  • The share of ECOWAS imports has more than doubled since 2021, signalling stronger regional trade ties.
  • Nigeria’s total imports from Africa rose to ₦1.8 trillion in 2025 (H1), indicating expanding trade activity.
See more
     
  • The six North-Eastern states collectively owe around ₦450 billion in domestic debt as of Q2 2025.
  • Borno State maintains the lowest debt in the region at ₦22.3 billion, showing signs of controlled borrowing amid post-conflict rebuilding.
  • Bauchi State has the highest domestic debt burden of ₦143.6 billion, accounting for about 31% of the region’s total.
  • The top three states, Bauchi, Taraba and Gombe, collectively account for more than two-thirds of the zone’s total subnational debt stock.
See more
     
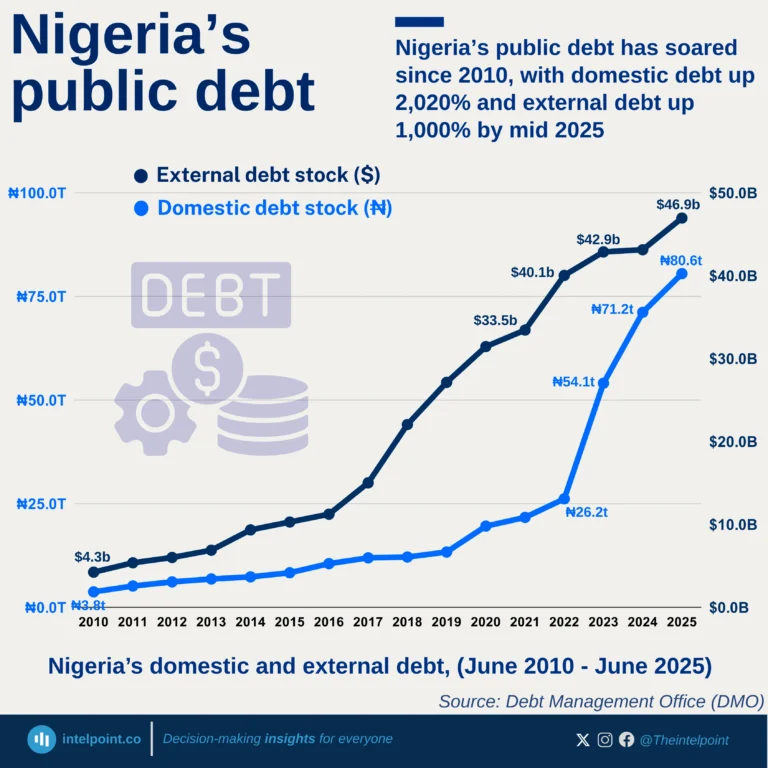
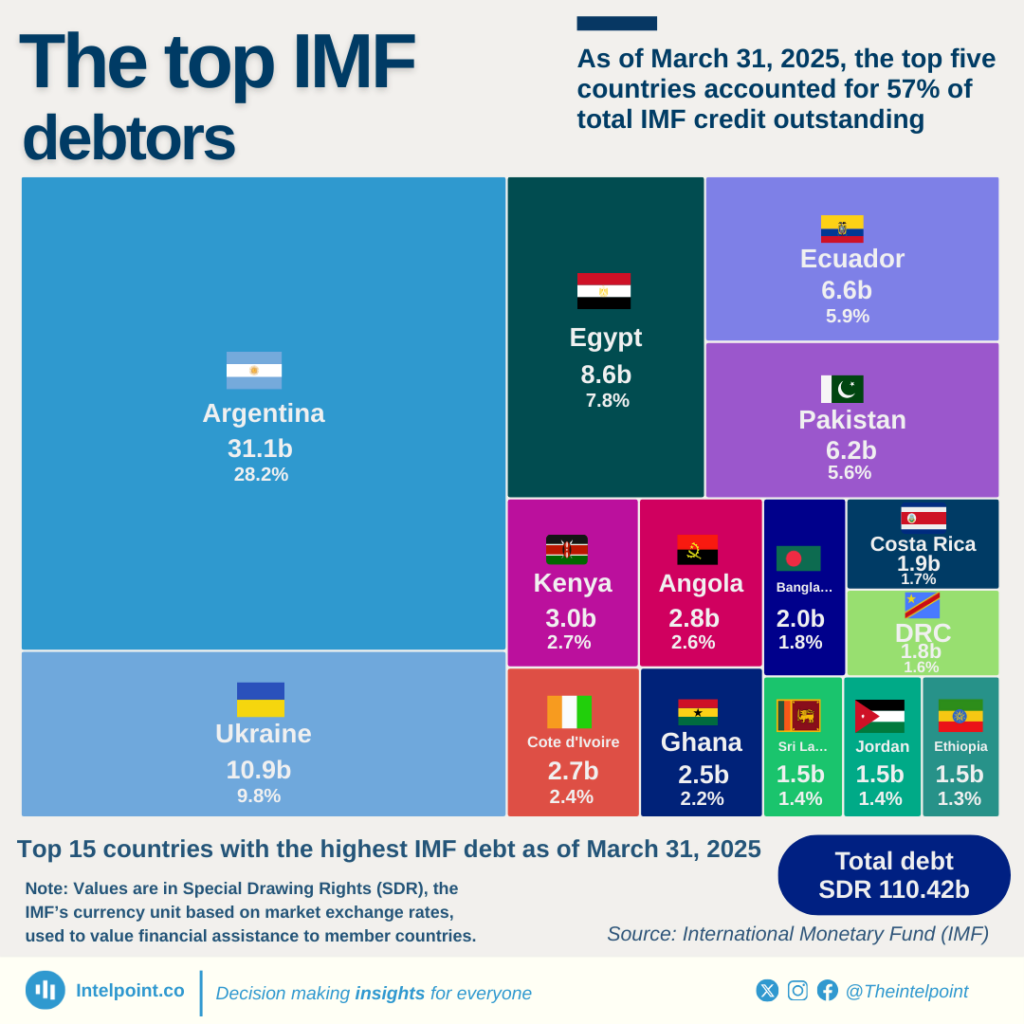
  • Nigeria paid $816.3 million to the International Monetary Fund, accounting for over 35% of total external debt service payments.
  • Eurobond payments followed closely, with $687.8 million paid, reflecting Nigeria’s heavy reliance on commercial debt instruments.
  • Multilateral lenders like IDA and AfDB collectively received about $463 million, signalling continued exposure to concessional financing.
  • China’s share shrinking: Payments to Chinese lenders (EXIM + CDB) totalled $235.6 million, less than 11% of total outflows, suggesting reduced Chinese debt servicing in H1 2025.
See more
     
  • FGN bonds dominated: ₦1.07 trillion went to Federal Government Bonds, accounting for about 63% of total domestic debt servicing.
  • Treasury bills followed: Payments on NTBs reached ₦537.9 billion, making up roughly 31% of the total.
  • Sukuk and promissory notes together cost ₦90.8 billion, reflecting Nigeria’s mix of infrastructure and settlement instruments.
  • Green and savings bonds remained minimal, together below ₦5 billion, showing limited traction for retail and sustainability-focused debt.
See more
  • China (773M) and India (607M) together make up for about 40% of the world’s total labour force.
  • Nigeria ranks 5th globally with 113 million workers, the largest in Africa and only African country in the top 10.
  • Asia dominates, accounting for over 47% of global workers, highlighting the region’s population and production strength.
  • The U.S.A. (174M) ranks third, representing just about 5% of global labour but producing almost a quarter of global GDP, proving productivity, not size, drives wealth.
See more
     
  • The Federal Government’s share of total public debt rose from 79.5% in 2019 to 92.6% in 2025.
  • States’ share has more than halved, from 20.5% to 7.4% in six years.
  • Total public debt grew from $83.9 billion to $99.7 billion, peaking at $113.4 billion in 2023.
  • Nigeria’s debt burden is increasingly concentrated at the centre, amplifying federal repayment risks and reducing fiscal independence for states.
See more
  • Wealth-building dominates motivation: 45.4% cite “active wealth building” as their primary motive, and an additional 21.8% cite “long-term financial security”.
  • Payments and utility are minor drivers: Only 3.3% report “daily utility” and 2.2% “digital commerce” as their chief motive for using crypto.
  • Hedging and cross-border flows matter: 8.7% use crypto for currency hedging, and 4.1% for cross-border payments, showing a dual role of investment plus international value flows.
  • Nigerian retail users treat crypto like a conventional financial instrument rather than only as a means of payment or speculation.
See more
  • Nearly two-thirds (67%) of all crypto transactions in Nigeria are below ₦50,000, reflecting widespread use among everyday retail users.
  • The ₦15,000–₦25,000 band (28.2%) is the single largest group, showing consistent, small-scale engagement rather than high-value speculation.
  • Around 25% of users transact between ₦50,000 and ₦250,000, suggesting a growing middle class of more confident, mid-level investors.
  • Less than 3% of users transact above ₦1 million, confirming that Nigeria’s crypto market remains primarily retail-driven, not institutional or high-net-worth.
See more
1 22 23 24 25 26 133
  • Local companies dominated CIT contributions in most years, accounting for over 50% of payments in 9 of 11 periods between 2015 and 2025 (Q1–Q3).
  • Foreign companies briefly closed the gap in 2023, contributing 49%, the closest they have come to matching local firms.p
  • Local companies recorded their strongest share in 2021 at 65%, marking the widest gap between local and foreign contributors.
  • “Other payments” peaked during the pandemic, rising to 17% in 2020 before dropping to 0% from 2022 onward.
Read more
  • Niger (76%), the Central African Republic (61%), and Chad (61%) top the global list, meaning the majority of women in these countries marry as children.
  • Seven of the top ten countries by prevalence are African, showing that child marriage is most entrenched relative to population on the continent.
  • Countries in South Asia — Bangladesh (51%) and Nepal (35%) — and Latin America — Suriname (36%) and Belize (34%) — also feature, highlighting the global nature of the challenge.
  • While some countries have larger populations, this list ranks the share of girls affected, not the absolute number, meaning even smaller populations can show extreme societal impact if the prevalence is high.
Read more
  1. Nigeria ranks first with 7.3 million estimated users — over 2.8 million more than Egypt.
  2. Egypt (4.5 million) and South Africa (3.1 million) follow, forming the top three markets.
  3. The top three countries account for nearly 60% of the total users across the ten listed countries.
  4. The gap between first (7.3 million) and tenth (Tunisia, 322,000) is more than 6.9 million users, highlighting wide market disparities.
Read more
  • Since its 2019 IPO, Jumia Group has accumulated over $1 billion in total losses, with 2019 marking its highest annual loss at $254.2 million.
  • Losses remained elevated between 2020 and 2022, consistently exceeding $180 million annually despite post-IPO restructuring efforts.
  • From 2023 onwards, annual losses dropped sharply — falling below $105 million for the first time since listing — following the shutdown of underperforming business units across African markets.
  • By 2025, losses declined further to $60.1 million, representing the company’s lowest annual loss in nine years and signalling the sustained impact of its cost-reduction strategy.
Read more
  • With revenue per screen of ₦ 271.6 million, EbonyLife Cinemas outperforms other top cinemas in West Africa.
  • Several Genesis and FilmHouse branches fall within the strong mid-tier cluster, with revenue per screen ranging from ₦100 million to ₦160 million.
  • Lower-tier cinemas still generate ₦40 million to ₦70 million per screen
  • Revenue per-screen metric reveals the operational efficiency of the cinemas
Read more
  • Nigeria is the fastest to reach $100B — 34 years, achieving the milestone in 1994.
  • Ethiopia took the longest — 81 years, reaching the mark in 2022 after decades of gradual expansion.
  • Resource-driven economies reached the threshold faster, including Angola (36 years) and Algeria (43 years).
  • North African economies crossed earlier, with Egypt (1989) and Morocco (2008) benefiting from diversified economic bases.
  • South Africa reached $100B as early as 1988, reflecting its long-standing industrial and financial depth.
  • Ghana is among the slowest climbers (68 years), but its recent 2025 milestone shows the impact of sustained reforms and growth.
  • Speed varies widely (34 to 81 years), showing that growth paths across Africa are shaped by very different economic realities.
Read more
1 22 23 24 25 26 265

Can’t find what you’re looking for? Please fill the form below
Contact Form Demo
SIGN UP TO OUR NEWSLETTER
Get periodic updates about the African startup space, access to our reports, among others.
Subscribe Here
Subscription Form

A product of Techpoint Africa. All rights reserved