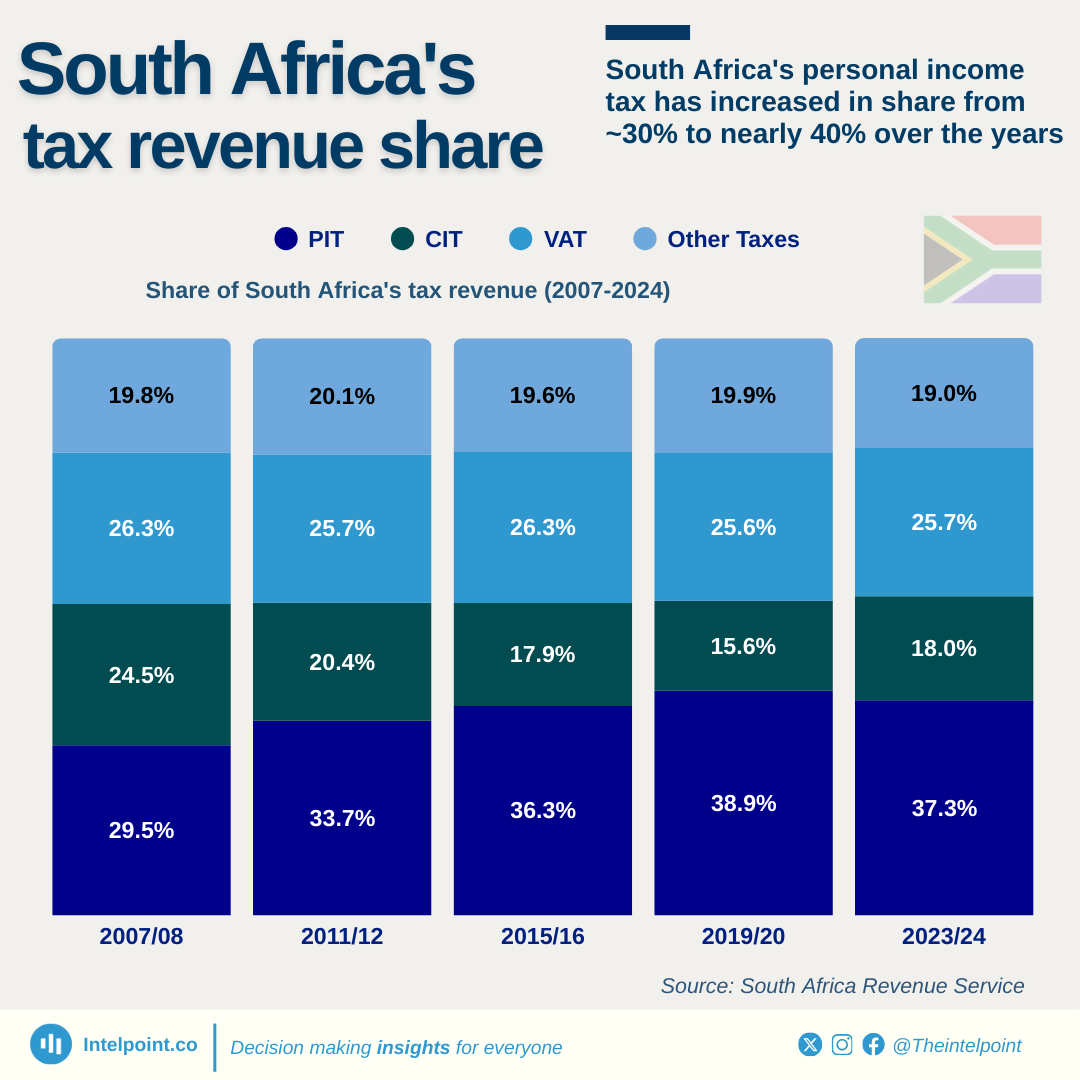
South Africa's personal income tax has increased in share from ~30% to nearly 40% over the years

Key Takeaways:

  • In 2007/08, personal income tax (PIT) contributed 29.46% of total tax revenue, while corporate income tax (CIT) added a substantial 24.46%.
  • The share of personal income tax in tax revenue rose by 27% from 2007/08 to 2023/24.
  • Corporate income tax contribution declined by 26% from 2007/08 to 2023/24.
  • In 2019/20, personal income tax made the largest contribution to tax revenue (38.9%), a 32% rise from the 2007/08 contribution.
  • Other taxes showed minor variations, averaging around 19% of total tax revenue.
  • Personal income tax reached its peak contribution at 38.92% in 2019/20 before dropping by 4% in 2023/24.

In the fiscal years spanning 2007/08 to 2023/24, the composition of South Africa's tax revenue has experienced notable shifts, mirroring broader economic transitions. Personal income tax (PIT) has established itself as the primary source of revenue, climbing from 29.46% in 2007/08 to 37.28% by 2023/24 and peaking at 38.92% in 2019/20. This trend reflects an increasing dependence on individual taxpayers.

In contrast, the Corporate Income Tax (CIT) witnessed a decrease from 24.46% in 2007/08 to 17.99% in 2023/24, including a significant reduction to 15.60% in 2019/20. This pattern aligns with analyses indicating a reduction in CIT contributions linked to factors like a contracting tax base and difficulties faced by key industries.

Meanwhile, VAT contributions remained relatively consistent throughout the examined years, oscillating between 25.58% and 26.27%. Other taxes displayed slight variances, averaging around 19% of the overall tax revenue.

In conclusion, the increasing significance of personal income tax points to a growing burden on individual taxpayers, while the gradual decline in CIT may suggest attempts to foster a more favourable business climate or reflect wider economic challenges.
Source:

South Africa Revenue Service

Period:

2007-2024
HTML code to embed chart
Want a bespoke report?
Reach out
Tags
Related Insights

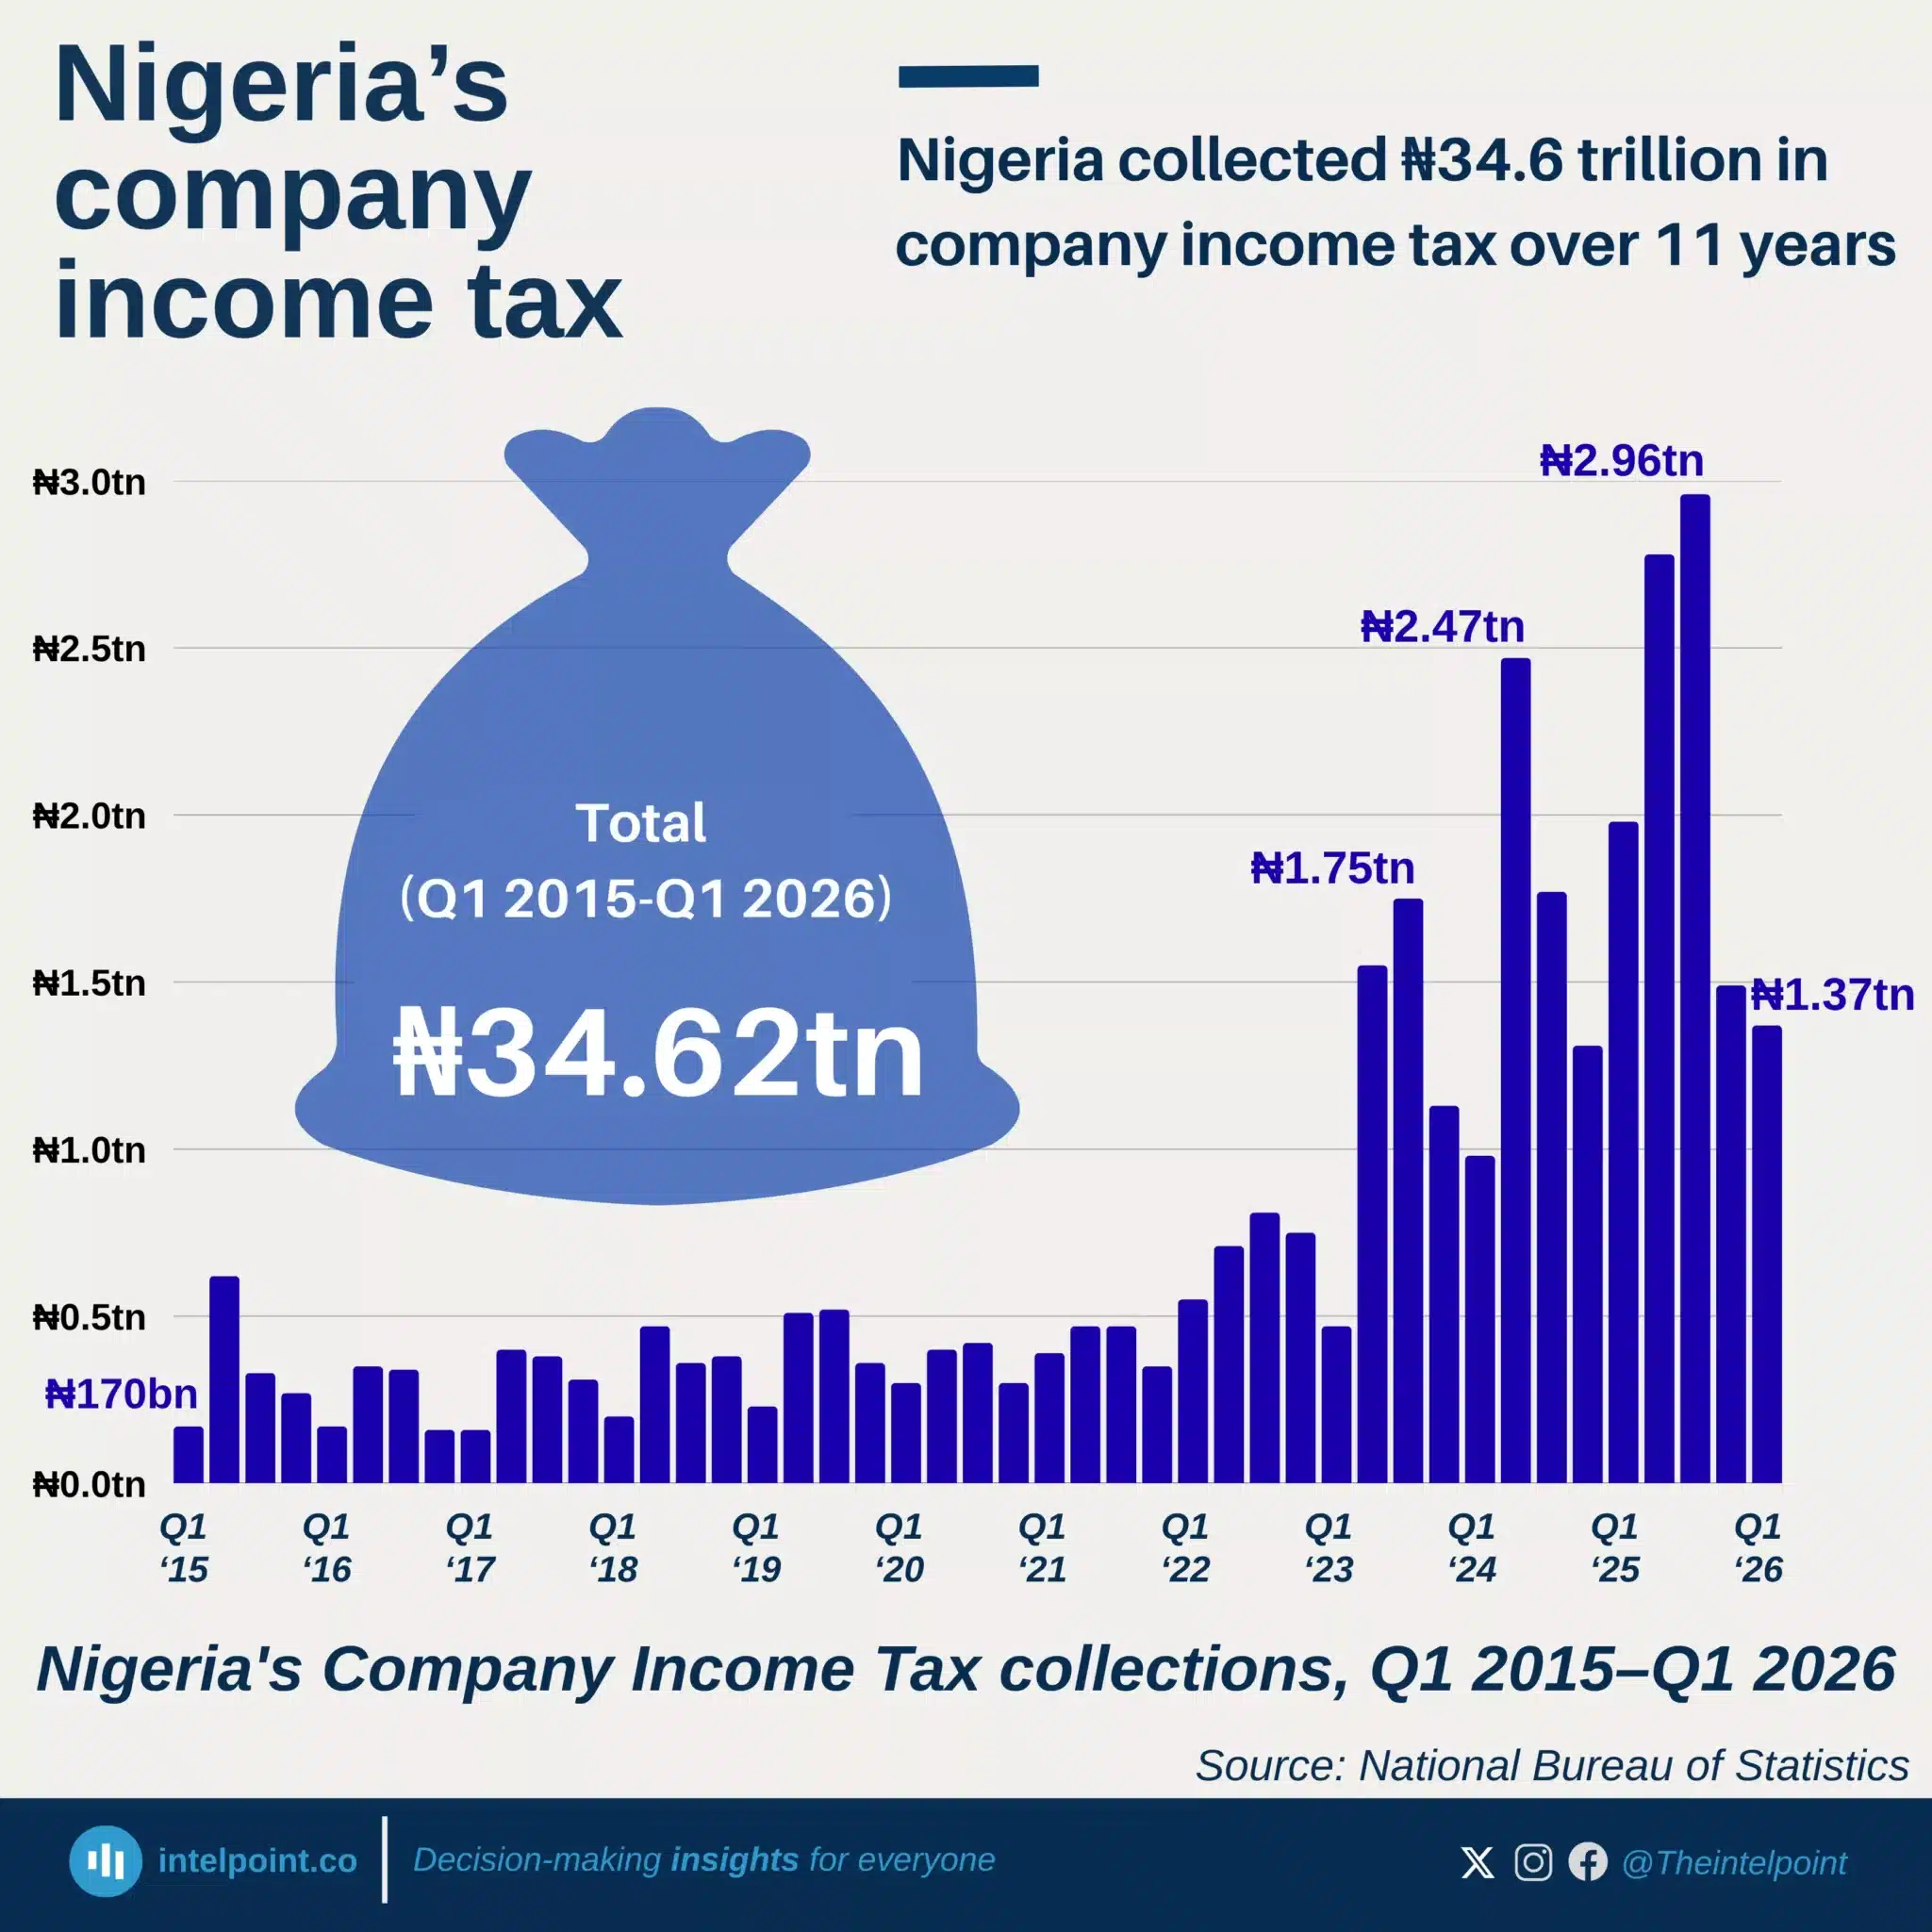
Nigeria collected ₦34.6 trillion in company income tax over 11 years
  • Nigeria collected ₦34.62 trillion in company income tax across 45 quarters from Q1 2015 to Q1 2026.
  • Average quarterly collection stood at about ₦769 billion over the period.
  • CIT collections stayed below ₦1 trillion in every quarter until Q2 2023.
  • Since Q2 2024, collections have remained above ₦1 trillion for eight straight quarters.
  • The highest quarterly collection was ₦2.96 trillion in Q3 2025.
  • Annual CIT collections rose sharply from ₦2.82 trillion in 2022 to ₦9.21 trillion in 2025.
  • The recent surge is nominal and likely reflects stronger collections, inflation, naira depreciation, and higher naira-value foreign CIT receipts.

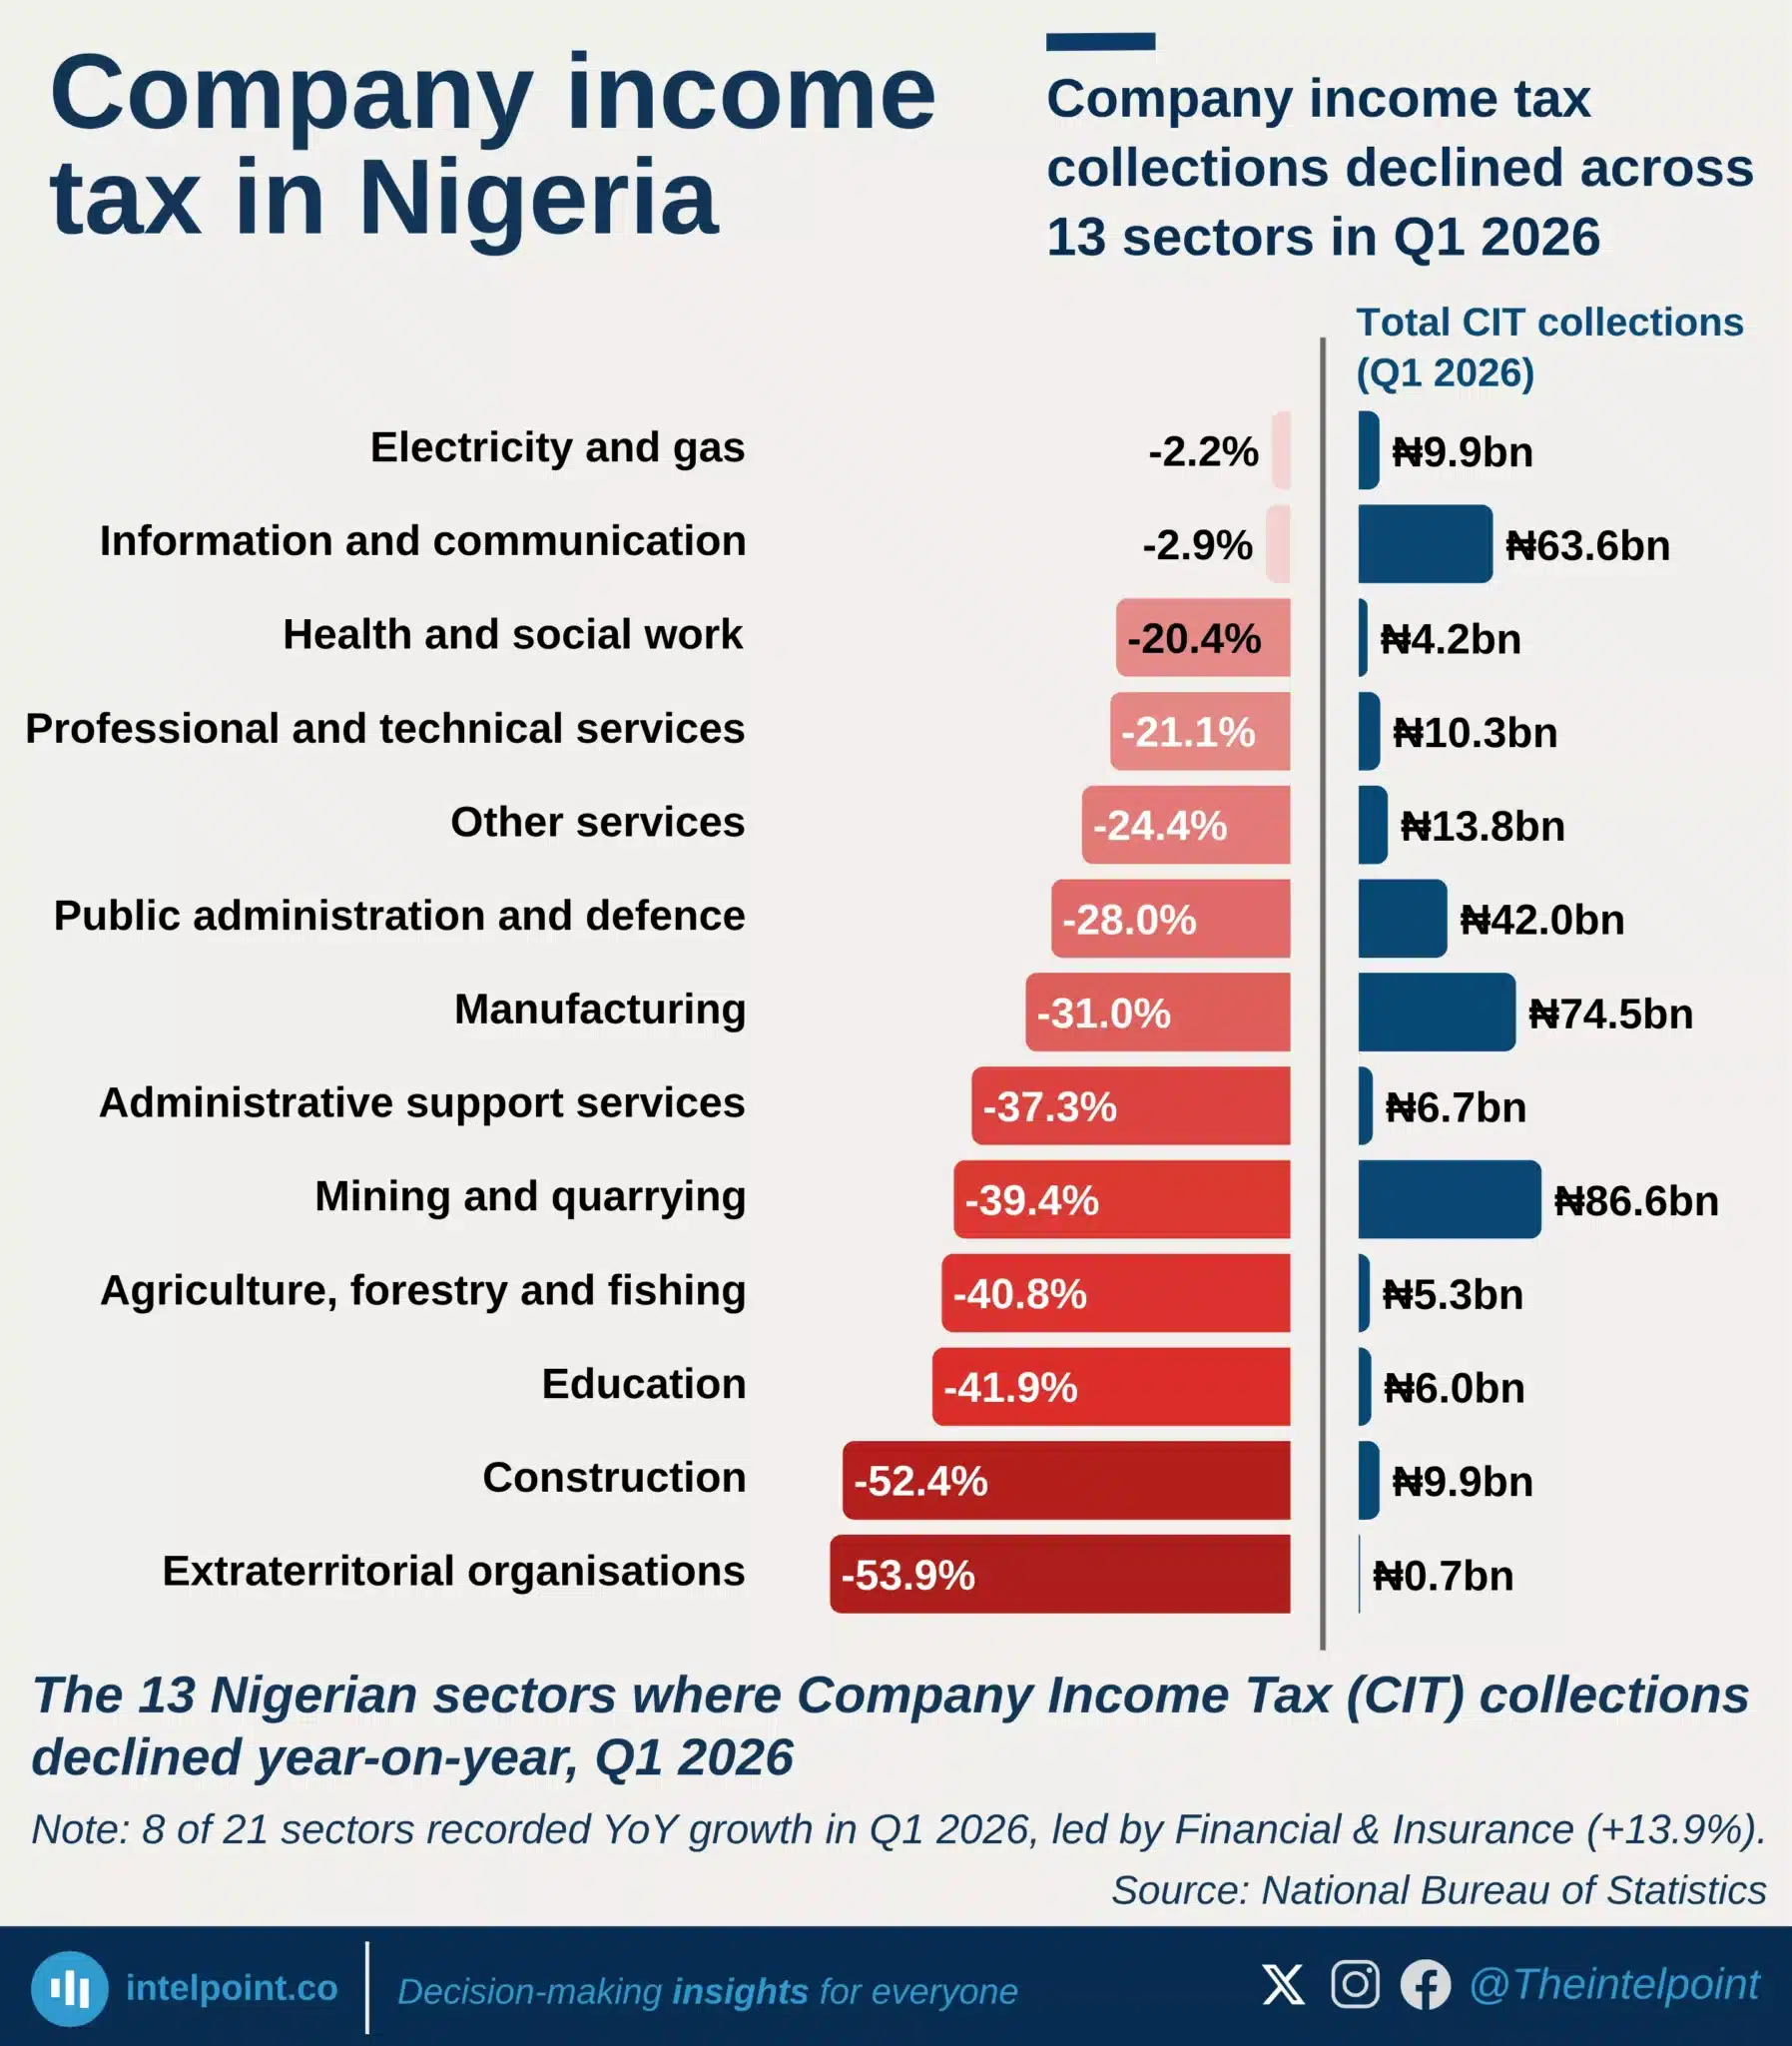
Company income tax collections declined across 13 sectors in Q1 2026
  • Thirteen of Nigeria’s 21 sectors recorded year-on-year declines in CIT collections.
  • Extraterritorial organisations recorded the steepest fall at 53.9%.
  • Construction collections fell by 52.4%, the second-largest decline.
  • Mining and agriculture declined by 39.4% and 40.8%, respectively.
  • Manufacturing still generated ₦74.5 billion despite a 31.0% decline.

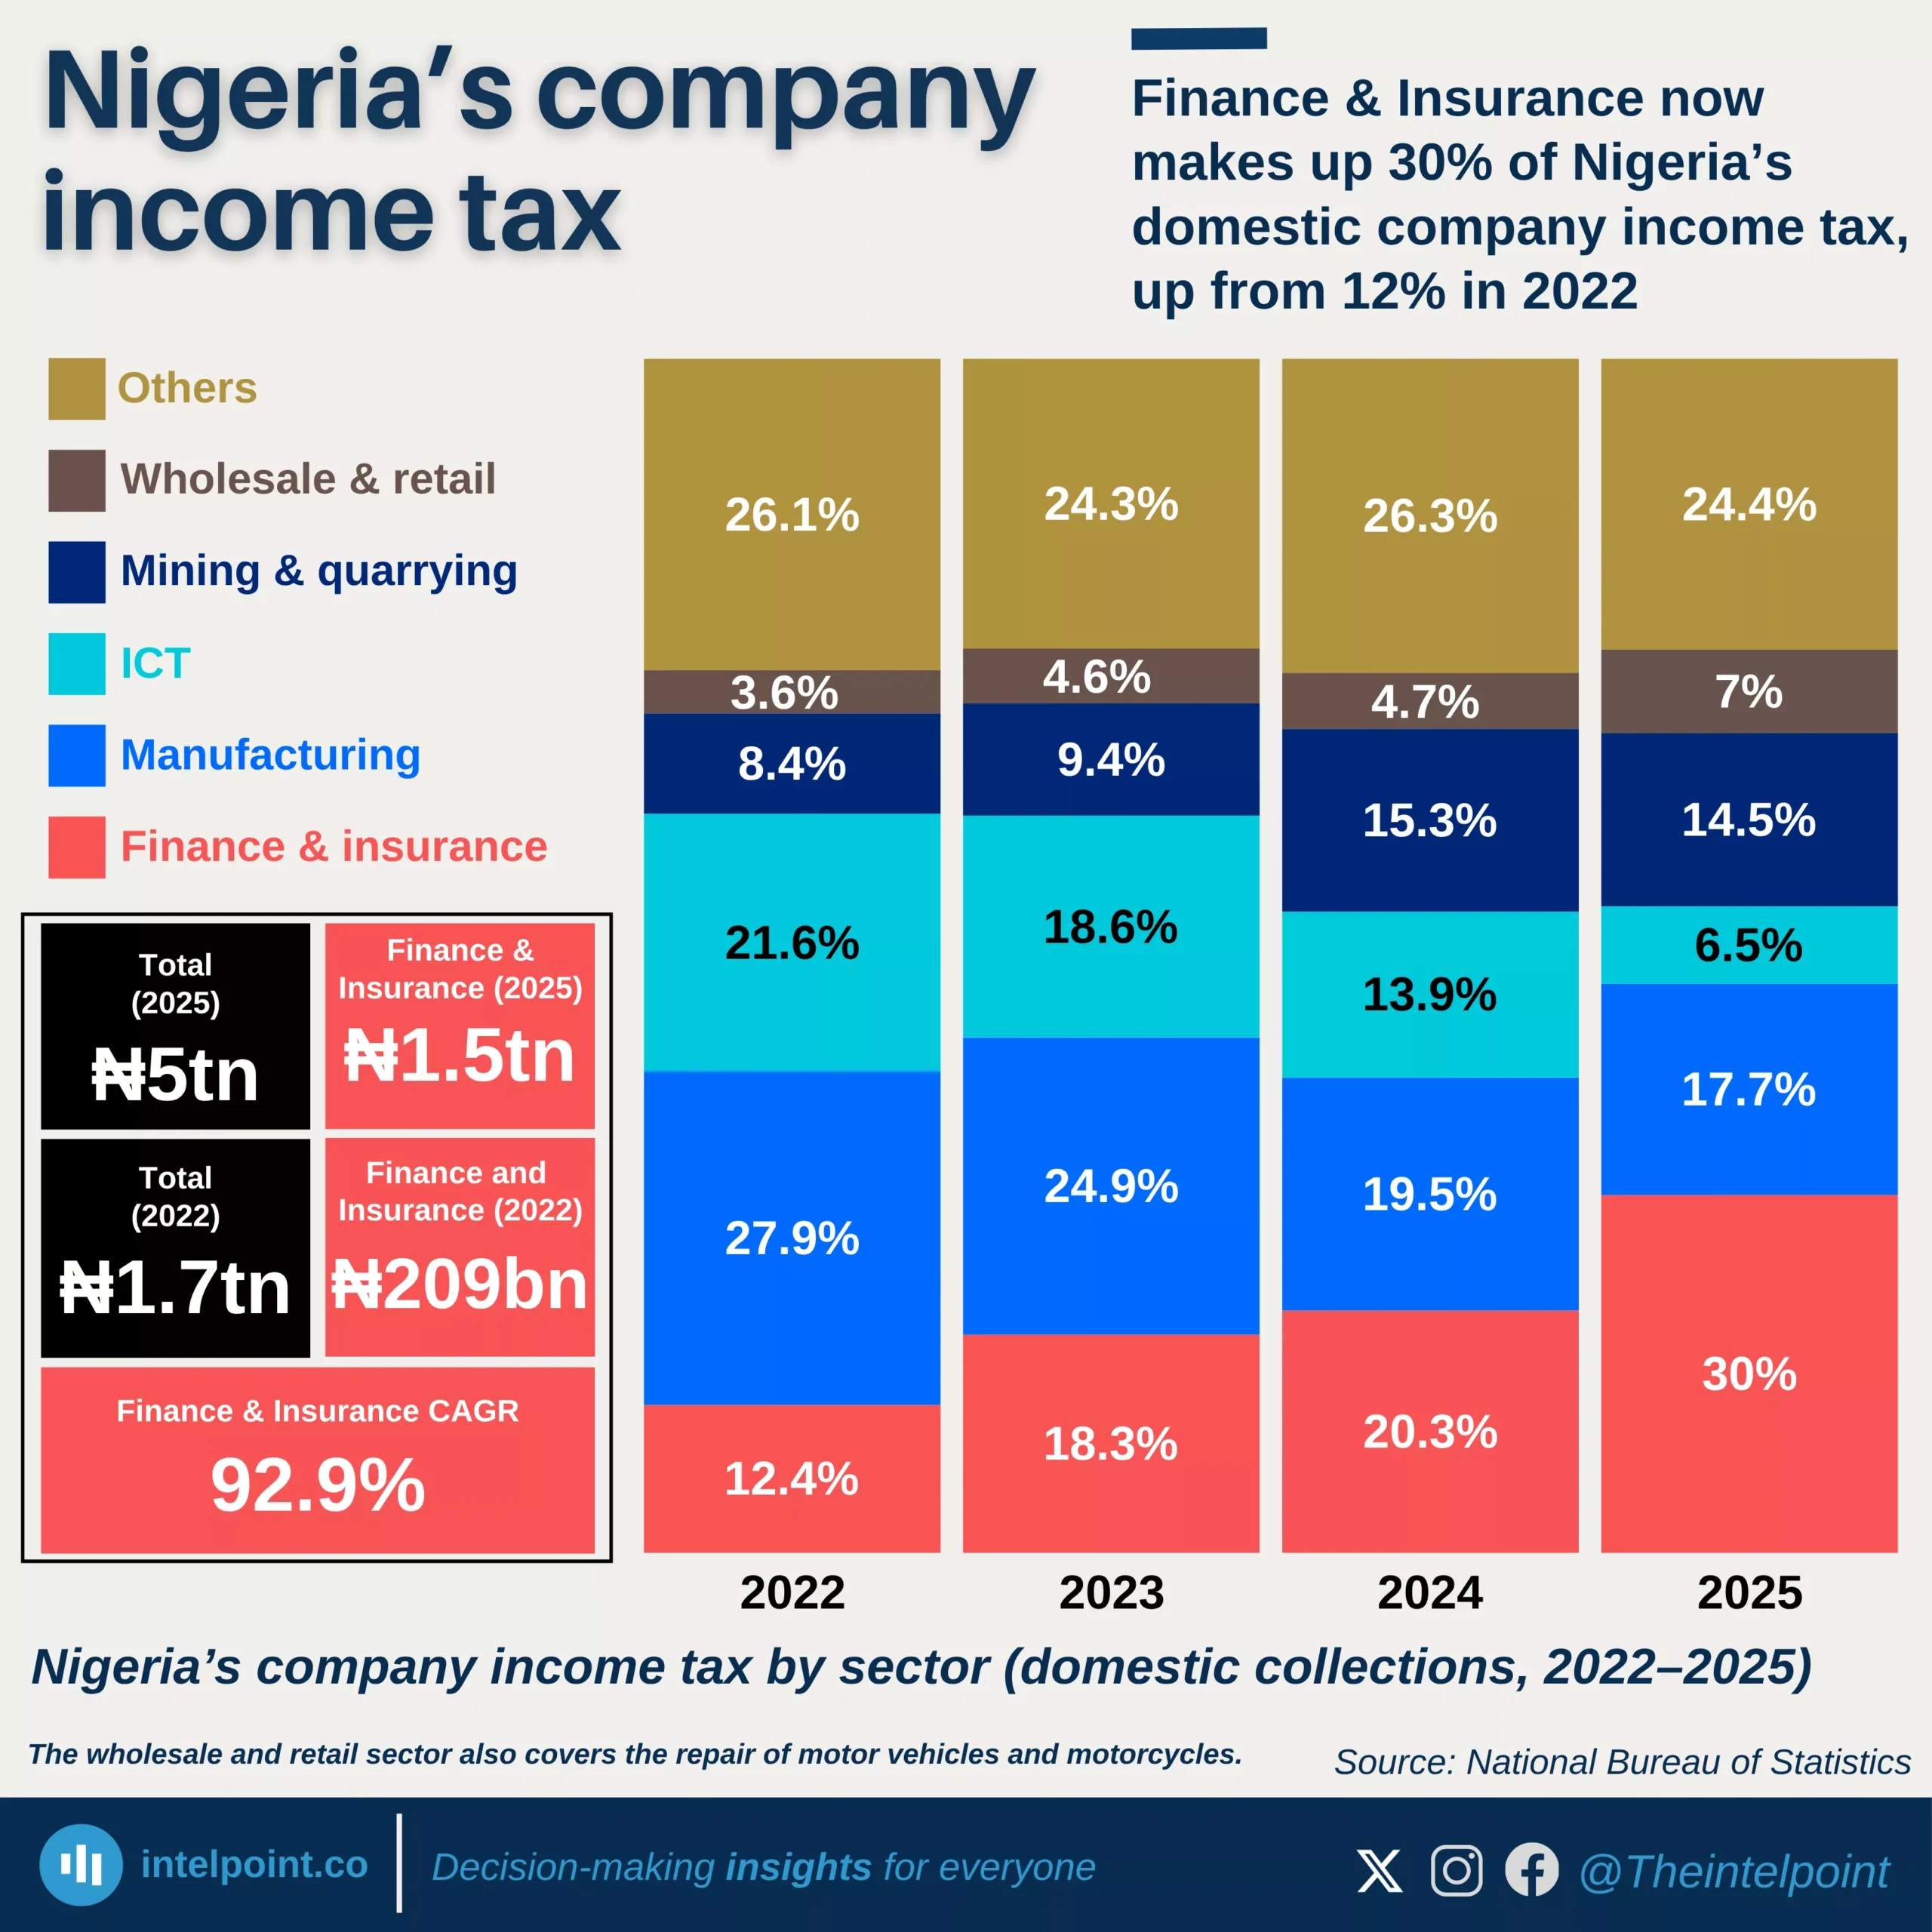
Finance & Insurance now makes up 30% of Nigeria’s domestic company income tax, up from 12% in 2022
  • Company income tax collections rose from ₦1.7tn in 2022 to ₦5.0tn in 2025.
  • Finance & Insurance more than doubled its share, from 12.4% to 30.0%.
  • Finance became the largest single sector in the tax mix by 2025.
  • Manufacturing remained important, but its share fell from 27.9% to 17.7%.
  • ICT saw one of the sharpest declines, from 21.6% to 6.5%.
  • Mining & quarrying gained weight, rising from 8.4% to 14.5%.
  • Wholesale & retail also increased, from 3.6% to 7.0%.
  • The tax base became less evenly distributed across sectors.

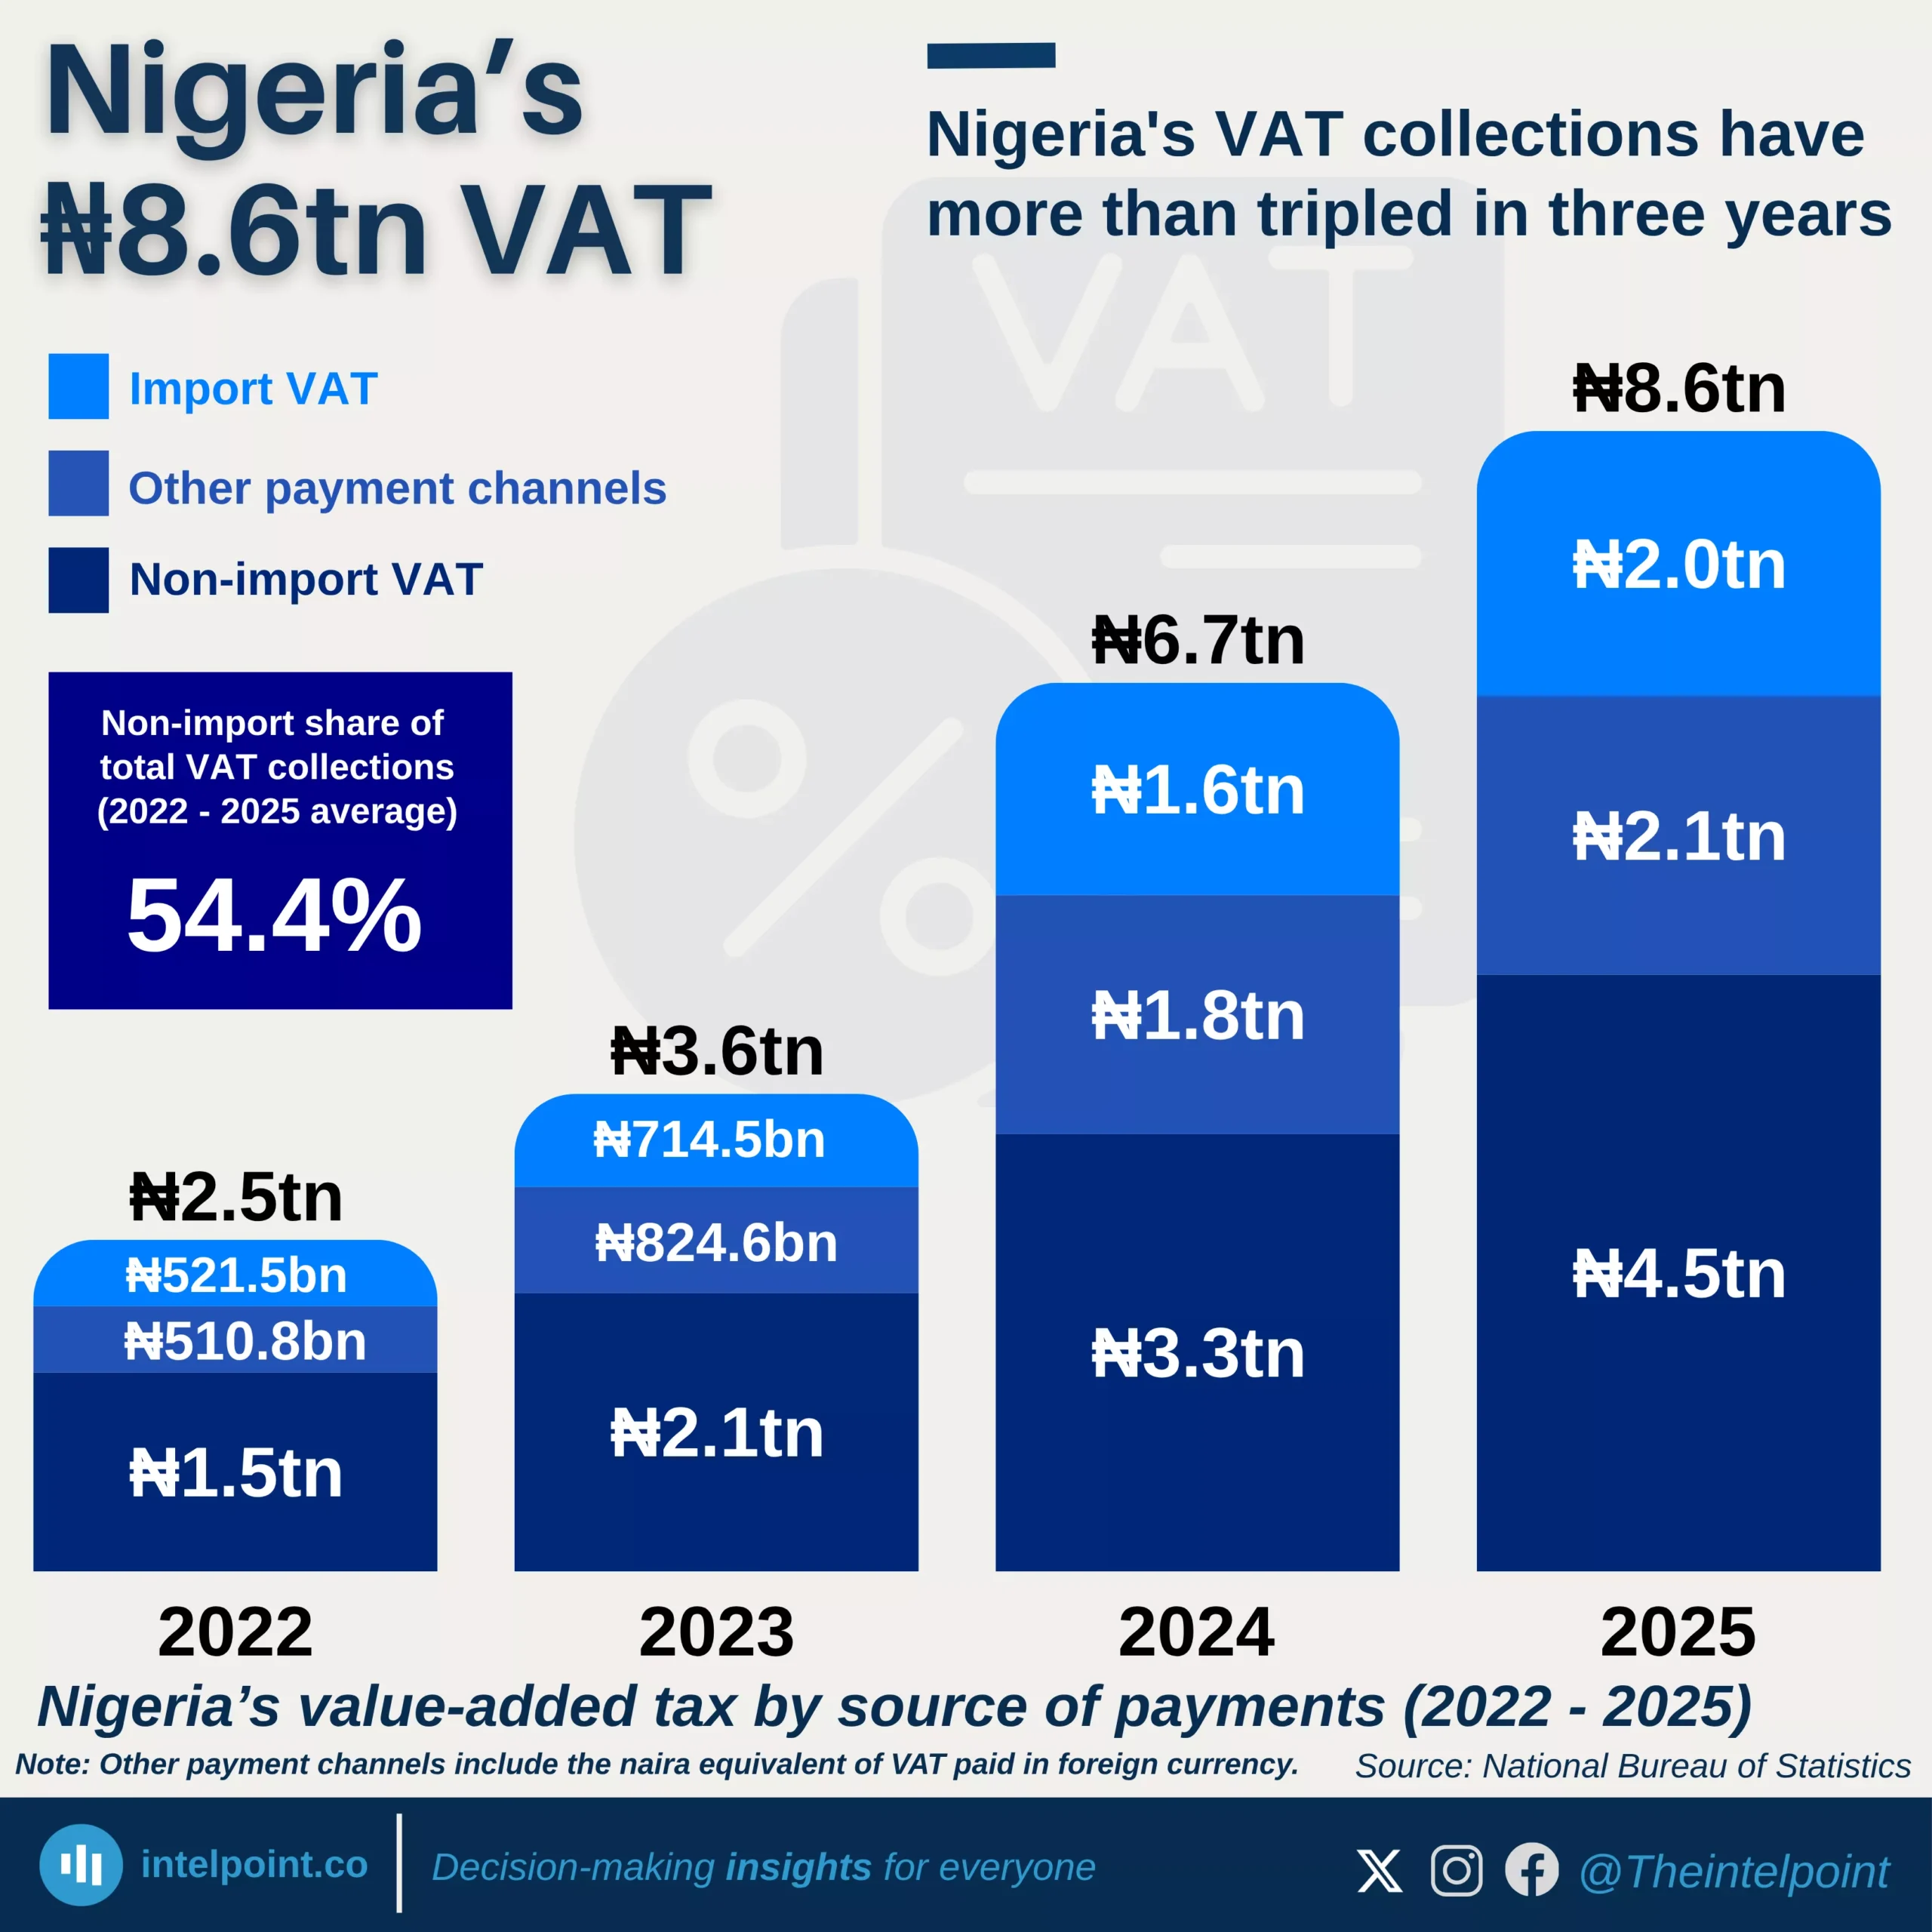
Nigeria's VAT collections have more than tripled in three years
  • Nigeria’s total VAT rose from ₦2.5tn in 2022 to ₦8.6tn in 2025.
  • VAT collections more than tripled in four years.
  • Local VAT remained the largest source of VAT throughout the period.
  • Local VAT increased from ₦1.5tn to ₦4.5tn.
  • Local VAT averaged 54.4% of total VAT between 2022 and 2025.
  • Import VAT also grew strongly, from ₦521.5bn to ₦2.0tn.
  • Other payment channels rose from ₦510.8bn to ₦2.1tn.
  • VAT growth is increasingly being driven by non-import activity.

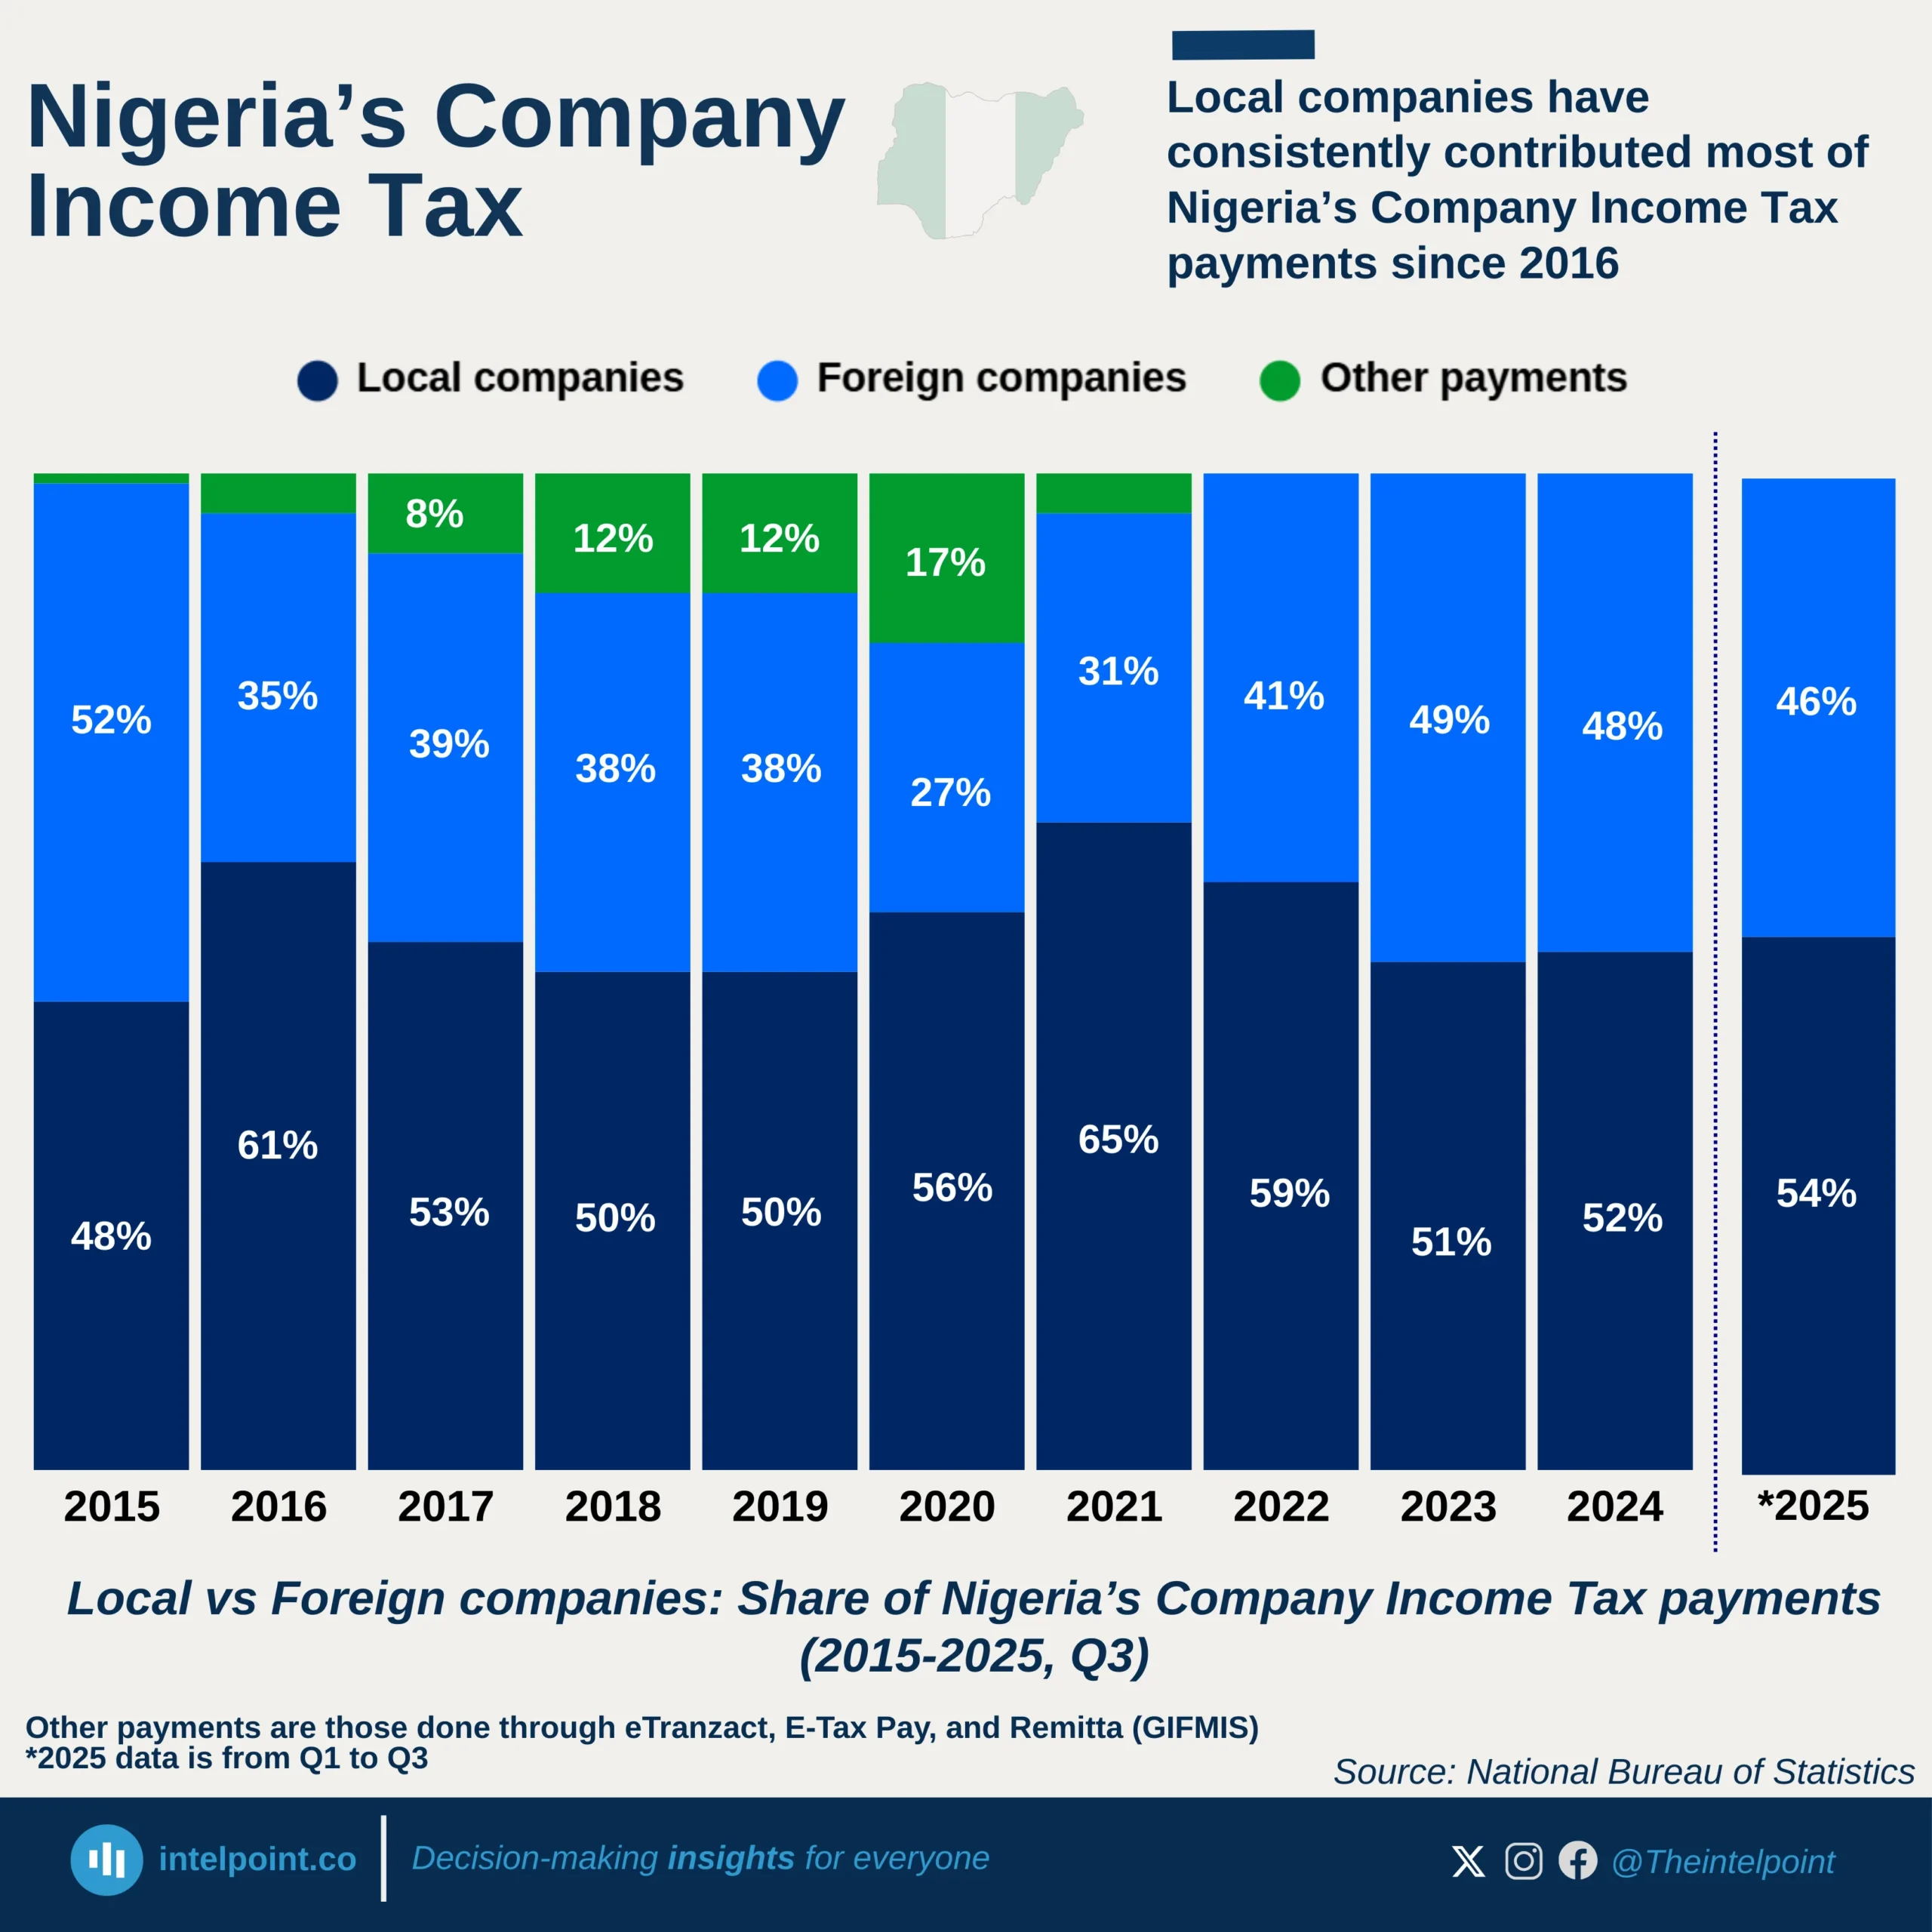
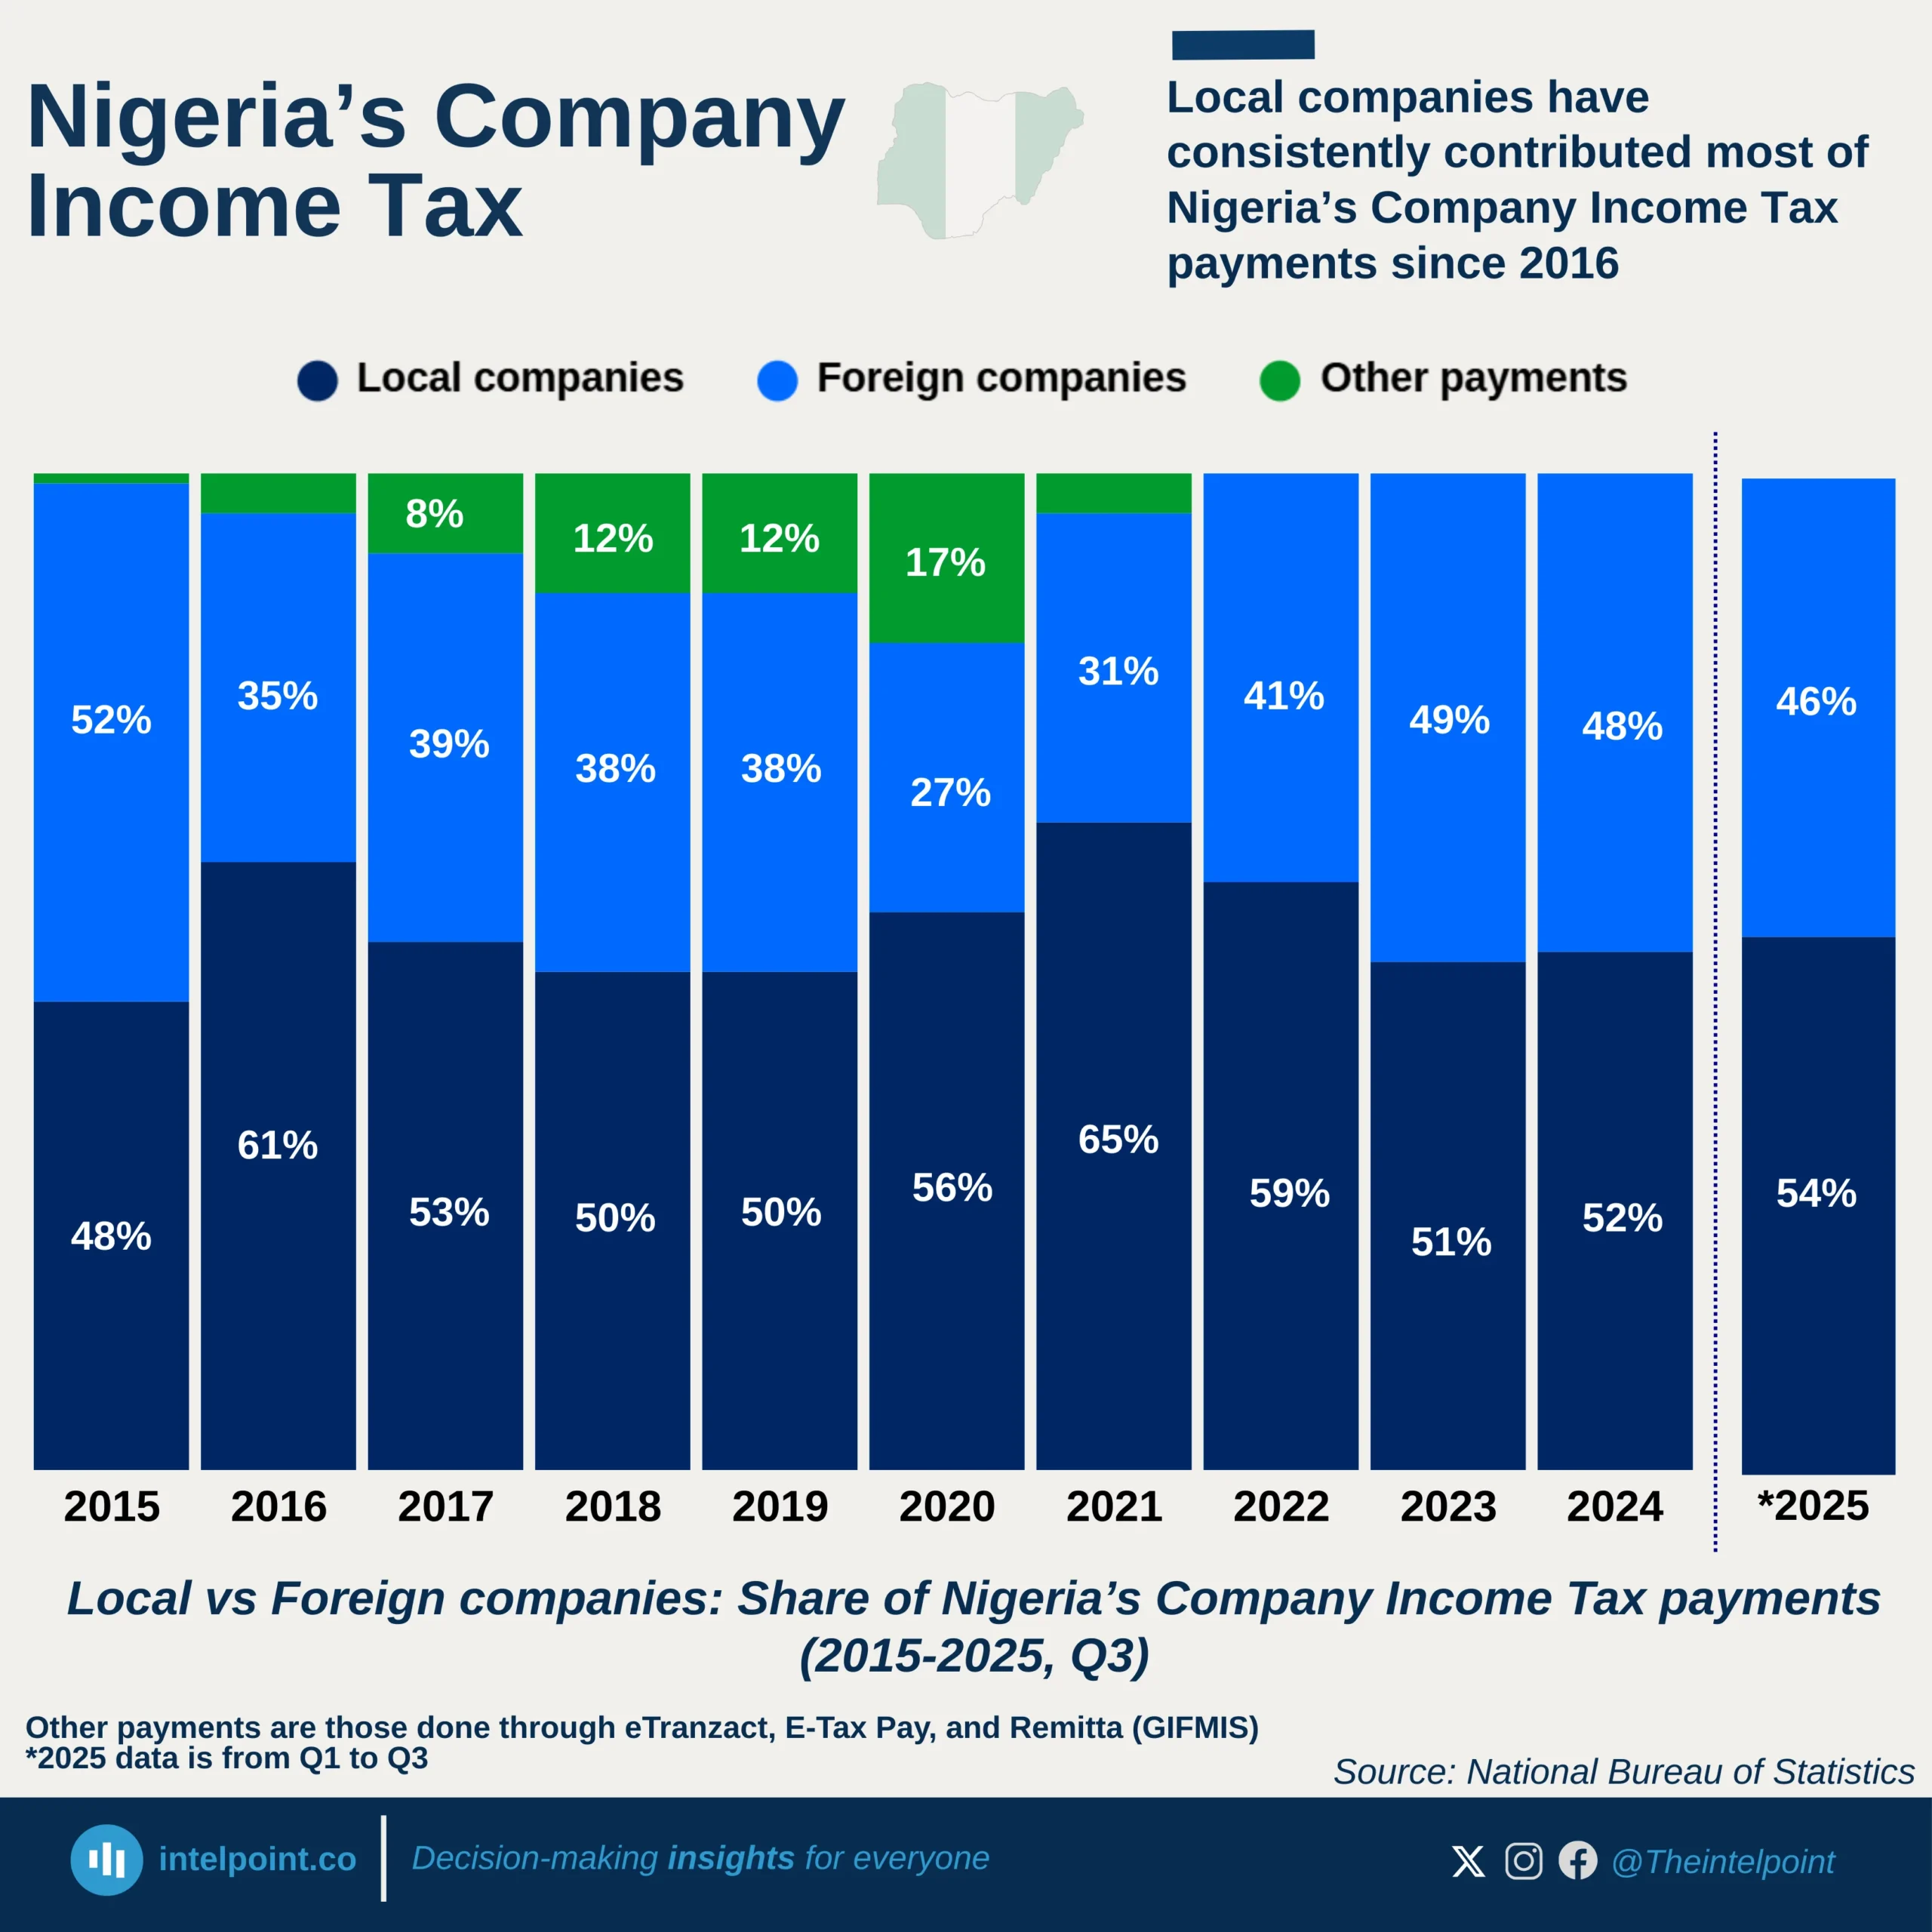
Local companies have consistently contributed most of Nigeria’s Company Income Tax payments since 2016
  • Local companies dominated CIT contributions in most years, accounting for over 50% of payments in 9 of 11 periods between 2015 and 2025 (Q1–Q3).
  • Foreign companies briefly closed the gap in 2023, contributing 49%, the closest they have come to matching local firms.
  • Local companies recorded their strongest share in 2021 at 65%, marking the widest gap between local and foreign contributors.
  • “Other payments” peaked during the pandemic, rising to 17% in 2020 before dropping to 0% from 2022 onward.

Local companies have consistently contributed most of Nigeria’s Company Income Tax payments since 2016
  • Local companies dominated CIT contributions in most years, accounting for over 50% of payments in 9 of 11 periods between 2015 and 2025 (Q1–Q3).
  • Foreign companies briefly closed the gap in 2023, contributing 49%, the closest they have come to matching local firms.p
  • Local companies recorded their strongest share in 2021 at 65%, marking the widest gap between local and foreign contributors.
  • “Other payments” peaked during the pandemic, rising to 17% in 2020 before dropping to 0% from 2022 onward.

POPULAR TOPICS
SIGN UP TO OUR NEWSLETTER
Get periodic updates about the African startup space, access to our reports, among others.
Subscribe Here
Subscription Form

A product of Techpoint Africa. All rights reserved