Bite-sized Insights about
 
Providing you with data-based insights about things happening around you.
Popular Insights
  • After tax, 12 NGX-listed Nigerian banks retained 10% - 45% of their respective revenues for the year as profit, with GTCO in the lead.

    Despite Zenith Bank leading in profit after tax with nearly ₦677 billion, GTCO recorded the highest profit margin, keeping 45% of its revenue.

    Here are Nigerian banks' profit margins in 2023.

    See more
    Nigeria's debt burden has been a growing concern, with data revealing that for every $1 billion external loan repaid in the past decade, approximately $3 billion was borrowed. Here, we look at how the country has managed its external debt in the past ten years.
    See more
  • A Trend of Adult literacy rates of African countries

    Between 2018 and 2021, adult literacy rates across African nations exhibited significant disparities. Seychelles and South Africa led with literacy rates of 96% and 95%, respectively, indicating a high proportion of literate adults. Conversely, Chad had the lowest literacy rate during this period.

    These statistics underscore the uneven progress in educational attainment across Africa, highlighting the need for targeted interventions to improve literacy in lower-performing nations.

    See more

    Inflation rate in Nigeria increased to 31.7% in February 2024. Nigeria has the 13th highest inflation rate out of 186 countries and territories as of February 2024.

    The data showcases Argentina leading with 276%, followed by Lebanon and Syria. Seven of the top fifteen are African.

    See more
  • Nigeria was the seventh most populous nation in the world in 2020, with 206.1 million people. Projected to reach a population of 401.3 million by 2050, Nigeria will rank third after India (1st) and China (2nd). According to Institut national d'études démographiques' projections, Nigeria, Ethiopia, DR Congo, Egypt, Tanzania, and Kenya will be among the world’s top 20 most populous countries by 2050.

    See more
    Top ten African countries by estimated number of films produced annually

    The Nigerian movie industry, mainly financed via public or private funding and international grants, produces the most films in Africa, yearly. Nigeria produced more than double the number of films that the Ghanaian and Kenyan movie industries produce annually.

    See more

  • top-15-african-countries-by-number-of-medical-doctors-per-10000-people-as-of-2022

    As of 2022, only seven African countries met the WHO's recommended doctor-to-population ratio of 10 doctors per 10,000 people.

    Cape Verde, Seychelles, Libya, Eswatini, Tunisia, Mauritius, and Algeria are leading the way in healthcare accessibility in Africa. However, the continent still averages only 2.6 doctors per 10,000 people.

    See more
  • Only 10% of Nigerians earn above ₦100,000, according to the Nigerian Financial Services Market Report. This aligns with most reports about Nigeria, and it's in sharp contrast to the narratives online.
    See more
  • A Trend of Adult literacy rates of African countries

    Between 2018 and 2021, adult literacy rates across African nations exhibited significant disparities. Seychelles and South Africa led with literacy rates of 96% and 95%, respectively, indicating a high proportion of literate adults. Conversely, Chad had the lowest literacy rate during this period.

    These statistics underscore the uneven progress in educational attainment across Africa, highlighting the need for targeted interventions to improve literacy in lower-performing nations.

    See more

Other Insights
  • Lagos State contributed ₦305B in VAT, making up over 53% of the national total and more than three times that of any other state.
  • Rivers (₦90B) and Oyo (₦27B) followed Lagos as the second and third highest contributors, highlighting a steep drop after the top state.
  • Only a few states, including Bayelsa, Kano, Kwara, and Edo, remitted above ₦5B, showing a highly uneven distribution of VAT contributions.
  • Over 8 states, such as Kebbi, Osun, Imo, and Zamfara, contributed less than ₦2B each, indicating minimal VAT activity in many parts of the country.
See more
  • Kano State has the highest number of LGAs in Nigeria, with 44, far exceeding the national average of 21 LGAs per state.
  • Bayelsa, Nasarawa, and the FCT have the fewest LGAs, recording 8, 13, and 6 respectively, despite varying population sizes and landmass.
  • Northern states dominate the upper tier of the LGA count, with Katsina (34), Oyo (33), and Jigawa (27) all ranking among the top.
  • Southern states tend to have fewer LGAs, with Lagos and Ogun, two highly urbanised states, having just 20 LGAs each, hinting at a denser governance structure per area.
See more
  • Lagos had the highest female representation in Nigeria’s 2023 elections, with 114 female candidates, more than any other state.
  • Yobe recorded the lowest, with just 7 female candidates, highlighting a wide disparity in representation across regions.
  • The South East and South South zones recorded some of the strongest numbers overall, with Imo (86) and Rivers (85) nearly matching Lagos.
  • The South West led overall in female candidate numbers, while the North East trailed, with its highest (Gombe – 42) still lower than other zones’ peaks.
See more
Share of investments (deal volume) in tech-enabled firms in Francophone Africa, 2015 – 2024 H1
  • The breakthrough year for tech in Francophone Africa was 2021, with 71% of deal volume going to tech-enabled firms, an all-time high.
  • The growth of tech began slowly, from 0% in 2015 to just 12% in 2017, showing how recent the tech surge is.
  • Between 2018 and 2020, tech’s share gradually rose from 15% to 27%, setting the stage for the explosive growth of 2021.
  • Post-2021, tech dominance slightly softened—holding 52% in 2022, 50% in 2023, and 63% in 2024 H1, suggesting a more balanced diversification.
  • The last year traditional sectors led in deal volume was 2020, accounting for 73%, right before tech flipped the narrative.
See more
Total volume of private capital exits in Francophone Africa, 2012 – 2024 H1
  • The peak year was 2019 with 13 exits, marking the most successful exit year since tracking began in 2012.
  • Zero exits occurred in 2020, likely reflecting the impact of the COVID-19 pandemic on exit strategies and deal closures.
  • The years 2021 and 2022 saw a rebound, with 11 and 10 exits respectively, suggesting a recovery in investor confidence post-pandemic.
  • Slower exit activity was recorded in 2023 and early 2024, with 6 and 3 exits, respectively (2024 is as of H1).
  • From 2012 to 2016, annual exits ranged between 3 and 4, except for a spike in 2013 with 10 exits.
  • The overall average exit volume is low, with fewer than 7 exits per year on average across the 12 years.
See more
Total volume of private capital deals in Francophone Africa, by sector, 2012 – 2024 H1
  • The consumer staples sector attracted the highest private capital volume with 69 deals.
  • The financial sector shows strong traction, especially as digital finance and fintechs continue to open access to banking services in underserved markets.
  • Fifty-five deals in the consumer discretionary category suggest investors are interested in rising middle-class consumption, retail, and lifestyle-driven spending patterns.
  • At 50 deals, industrials, including manufacturing and infrastructure, remain a backbone for private capital.
  • Healthcare (24 deals) and utilities (37 deals) reflect increasing investor focus on sectors with long-term impact and scalable public value.
See more
Private capital deal value in the top 5 Francophone African countries, 2012 – 2024 H1
  • With $1.2B in deal value (25%), Côte d’Ivoire stands far ahead, signalling strong investor confidence.
  • At $697M (14.5%), Senegal is proving itself as a rising investment star.
  • Despite being a small economy, Rwanda drew $166M (3.5%).
  • DR Congo attracted $143M (3.0%), a modest share relative to its size.
  • Twenty-four Francophone African countries collectively received 47.4% ($2.3B) of the deal value, suggesting huge untapped or underserved markets across Francophone Africa.
See more

Key takeaways:

  • Manufactured goods accounted for 44.2% of Nigeria’s total imports.
  • Petroleum products (excluding crude oil) made up 38% of the import value.
  • Raw materials represented 11% of the total import value.
  • Agricultural imports contributed 6.2% to the overall import value.
  • The total import value stood at ₦60.59 trillion in 2024, from ₦30.86 trillion in 2023.
  • The energy resources sector made a negligible amount in import value, while no record was made for the crude oil sector.
See more
  • Nigeria’s MMR dropped by just 13% in 23 years — from 1,136 to 993
  • The country never left the global top 10 between 2000 and 2023
  • Nigeria became number one by 2021 and still leads
  • Sierra Leone dropped by 78%, from 1,603 to 354
  • South Sudan dropped by 58%, despite conflict
  • Africa dominated the list, with nearly all top 10 countries coming from the region
  • Nigeria accounted for 29% of global maternal deaths in 2023
See more

Key Takeaways:

  • Mineral fuels and oils dominated the US' imports from Nigeria, totalling $5.28 billion.
  • Total US imports from Nigeria reached $5.70 billion in 2024.
  • Non-oil sectors contributed approximately $423 million to the total US imports from Nigeria.
  • US imports from Nigeria cut across 70 distinct product categories.
  • The average value across all import categories was $81.4 million.
  • The top 10 imported goods made up 99.1% of the total imported value.
See more

Key Takeaways:

  • Mineral fuels and oils led the US' exports to Nigeria at $1.82B, making up over 43% of the total.
  • Vehicles and automotive parts followed at $677.65 million, with machinery and nuclear reactors contributing $487.23 million.
  • Total US exports to Nigeria reached $4.17 billion in 2024.
  • The top 10 export categories made up 90.7% of the total export value.
  • The top three US export categories to Nigeria accounted for nearly 72% of total exports.
See more
  • Only 4 African countries ever crossed 1 million b/d:   Libya, Nigeria, Algeria, and Angola.
  • Libya was Africa’s top producer in the 1970s and 2000s. At its peak, Libya did over 3 million b/d. No other African country has touched that.
  • Nigeria peaked in 2005 with 2.5 million b/d. But since then, it’s been unstable due to theft and pipeline issues.
  • Angola and Algeria have stayed around or above 1 million b/d for long periods, especially post-2000.
  • Despite oil discoveries, most African countries never got close to 1 million b/d: countries like Chad, Sudan, and Gabon, while some peaked under 500k.
See more
1 40 41 42 43 44 107
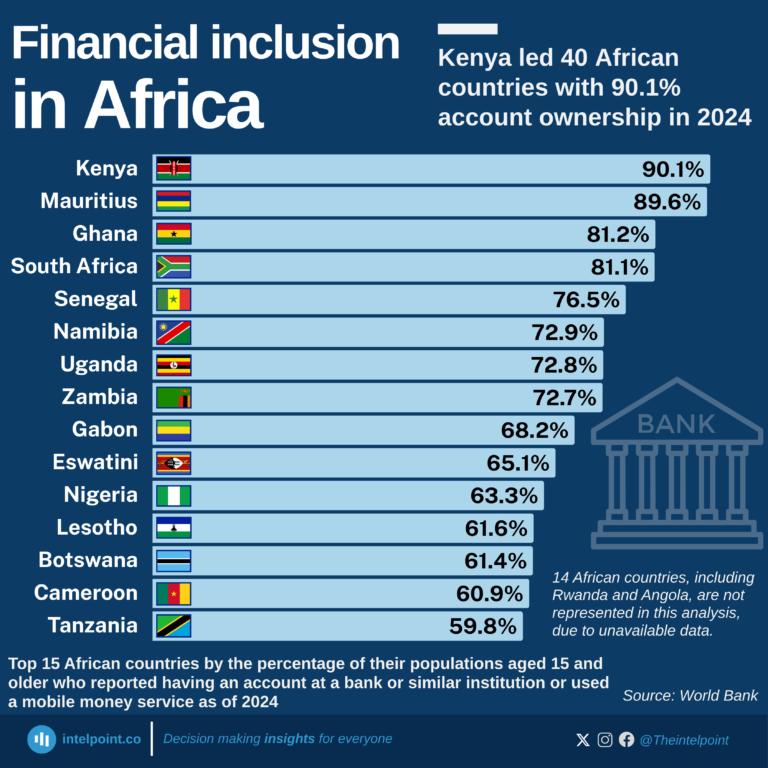
- Kenya led with 90.1 percent account ownership in 2024. - Mauritius (89.6 percent) and Ghana (81.2 percent) also in top 3. - Nigeria ranked 11th at 63.3 percent; Tanzania fell short at 59.8 percent. - Only 14 African countries exceeded the 60 percent inclusion benchmark. - Another 14 African countries have no recent data in the Global Findex
Read more
  • Nigeria’s FAAC revenue increased 49% YoY in March 2025 (₦1.68T vs ₦1.12T in March 2024).
  • February 2025 saw a 48% increase YoY (₦1.70T vs ₦1.15T in February 2024).
  • April 2025 revenue rose by 41% YoY, moving from ₦1.12T in April 2024 to ₦1.58T.
  • January 2025 showed no YoY change, recording ₦1.42T in both 2024 and 2025.
  • The consistent growth in H1 2025 FAAC revenues signals improved government revenue mobilisation, better oil/non-oil collections, and higher capacity for states to meet obligations.
Read more
  • Nigeria’s exchange rate gain revenue dropped by 73.2% in H1 2025 compared to H1 2024.
  • In April 2025, exchange rate gain fell by 90% year-on-year from ₦285.5B to ₦28.7B.
  • May saw an 81% drop, with revenue declining from ₦438.9B in 2024 to ₦81.4B in 2025.
  • January 2025 was the only month with a stable figure, matching January 2024’s ₦402.7B.
  • Exchange rate gain revenue for February and March 2025 was unavailable, likely worsening the total.
  • The first half of 2025 generated only ₦589.4B in FX gains, compared to ₦2.2T in the same period in 2024.
Read more
  • The value of agricultural goods exported in Q1 2025 rose to ₦1.70 trillion, up 64.65% year-on-year and 10.63% quarter-on-quarter, highlighting continued growth in the sector.
  • Standard and superior cocoa beans led the chart, contributing a combined ₦1.23 trillion, with major buyers being The Netherlands (₦344.17B) and Belgium (₦203.17B).
  • Cashew nuts in shell earned ₦157.63B, mostly exported to India (₦87.56B) and Vietnam (₦69.74B), while sesamum seeds brought in ₦128.18B.
  • Soya bean flours and ornamental flowers fetched ₦27B and ₦18B respectively, showing Nigeria's export mix is broadening.
Read more
  • Lagos alone accounts for nearly 25% of all Nigerian states’ external debt, totalling $1.17 billion.
  • The combined debt of Lagos, Kaduna, and Edo is larger than the sum of the debts of the bottom 30 states.
  • States like Yobe, Abuja, and Jigawa each owe less than $25 million externally, indicating minimal foreign exposure.
  • Cross River, Rivers, and Ogun round out the top six debtors, each with external debts around [$190–210] million.
  • Just eleven states owe over $100 million each, while the majority owes less than that threshold.
  • Despite 36 subnational governments, the federal government’s $40.98 billion external debt is over 8x that of all states combined.
Read more
  • Lagos alone holds more domestic debt than the bottom 25 states combined.
  • Jigawa’s domestic debt of ₦1.06 billion is less than 0.15% of Lagos’s debt, showing the widest disparity.
  • The 10 highest-indebted states account for nearly 70% of the total domestic debts across Nigerian states.
  • The Federal Capital Territory (FCT) carries more debt than 17 other states.
Read more
1 40 41 42 43 44 214

Can’t find what you’re looking for? Please fill the form below
Contact Form Demo
SIGN UP TO OUR NEWSLETTER
Get periodic updates about the African startup space, access to our reports, among others.
Subscribe Here
Subscription Form

A product of Techpoint Africa. All rights reserved