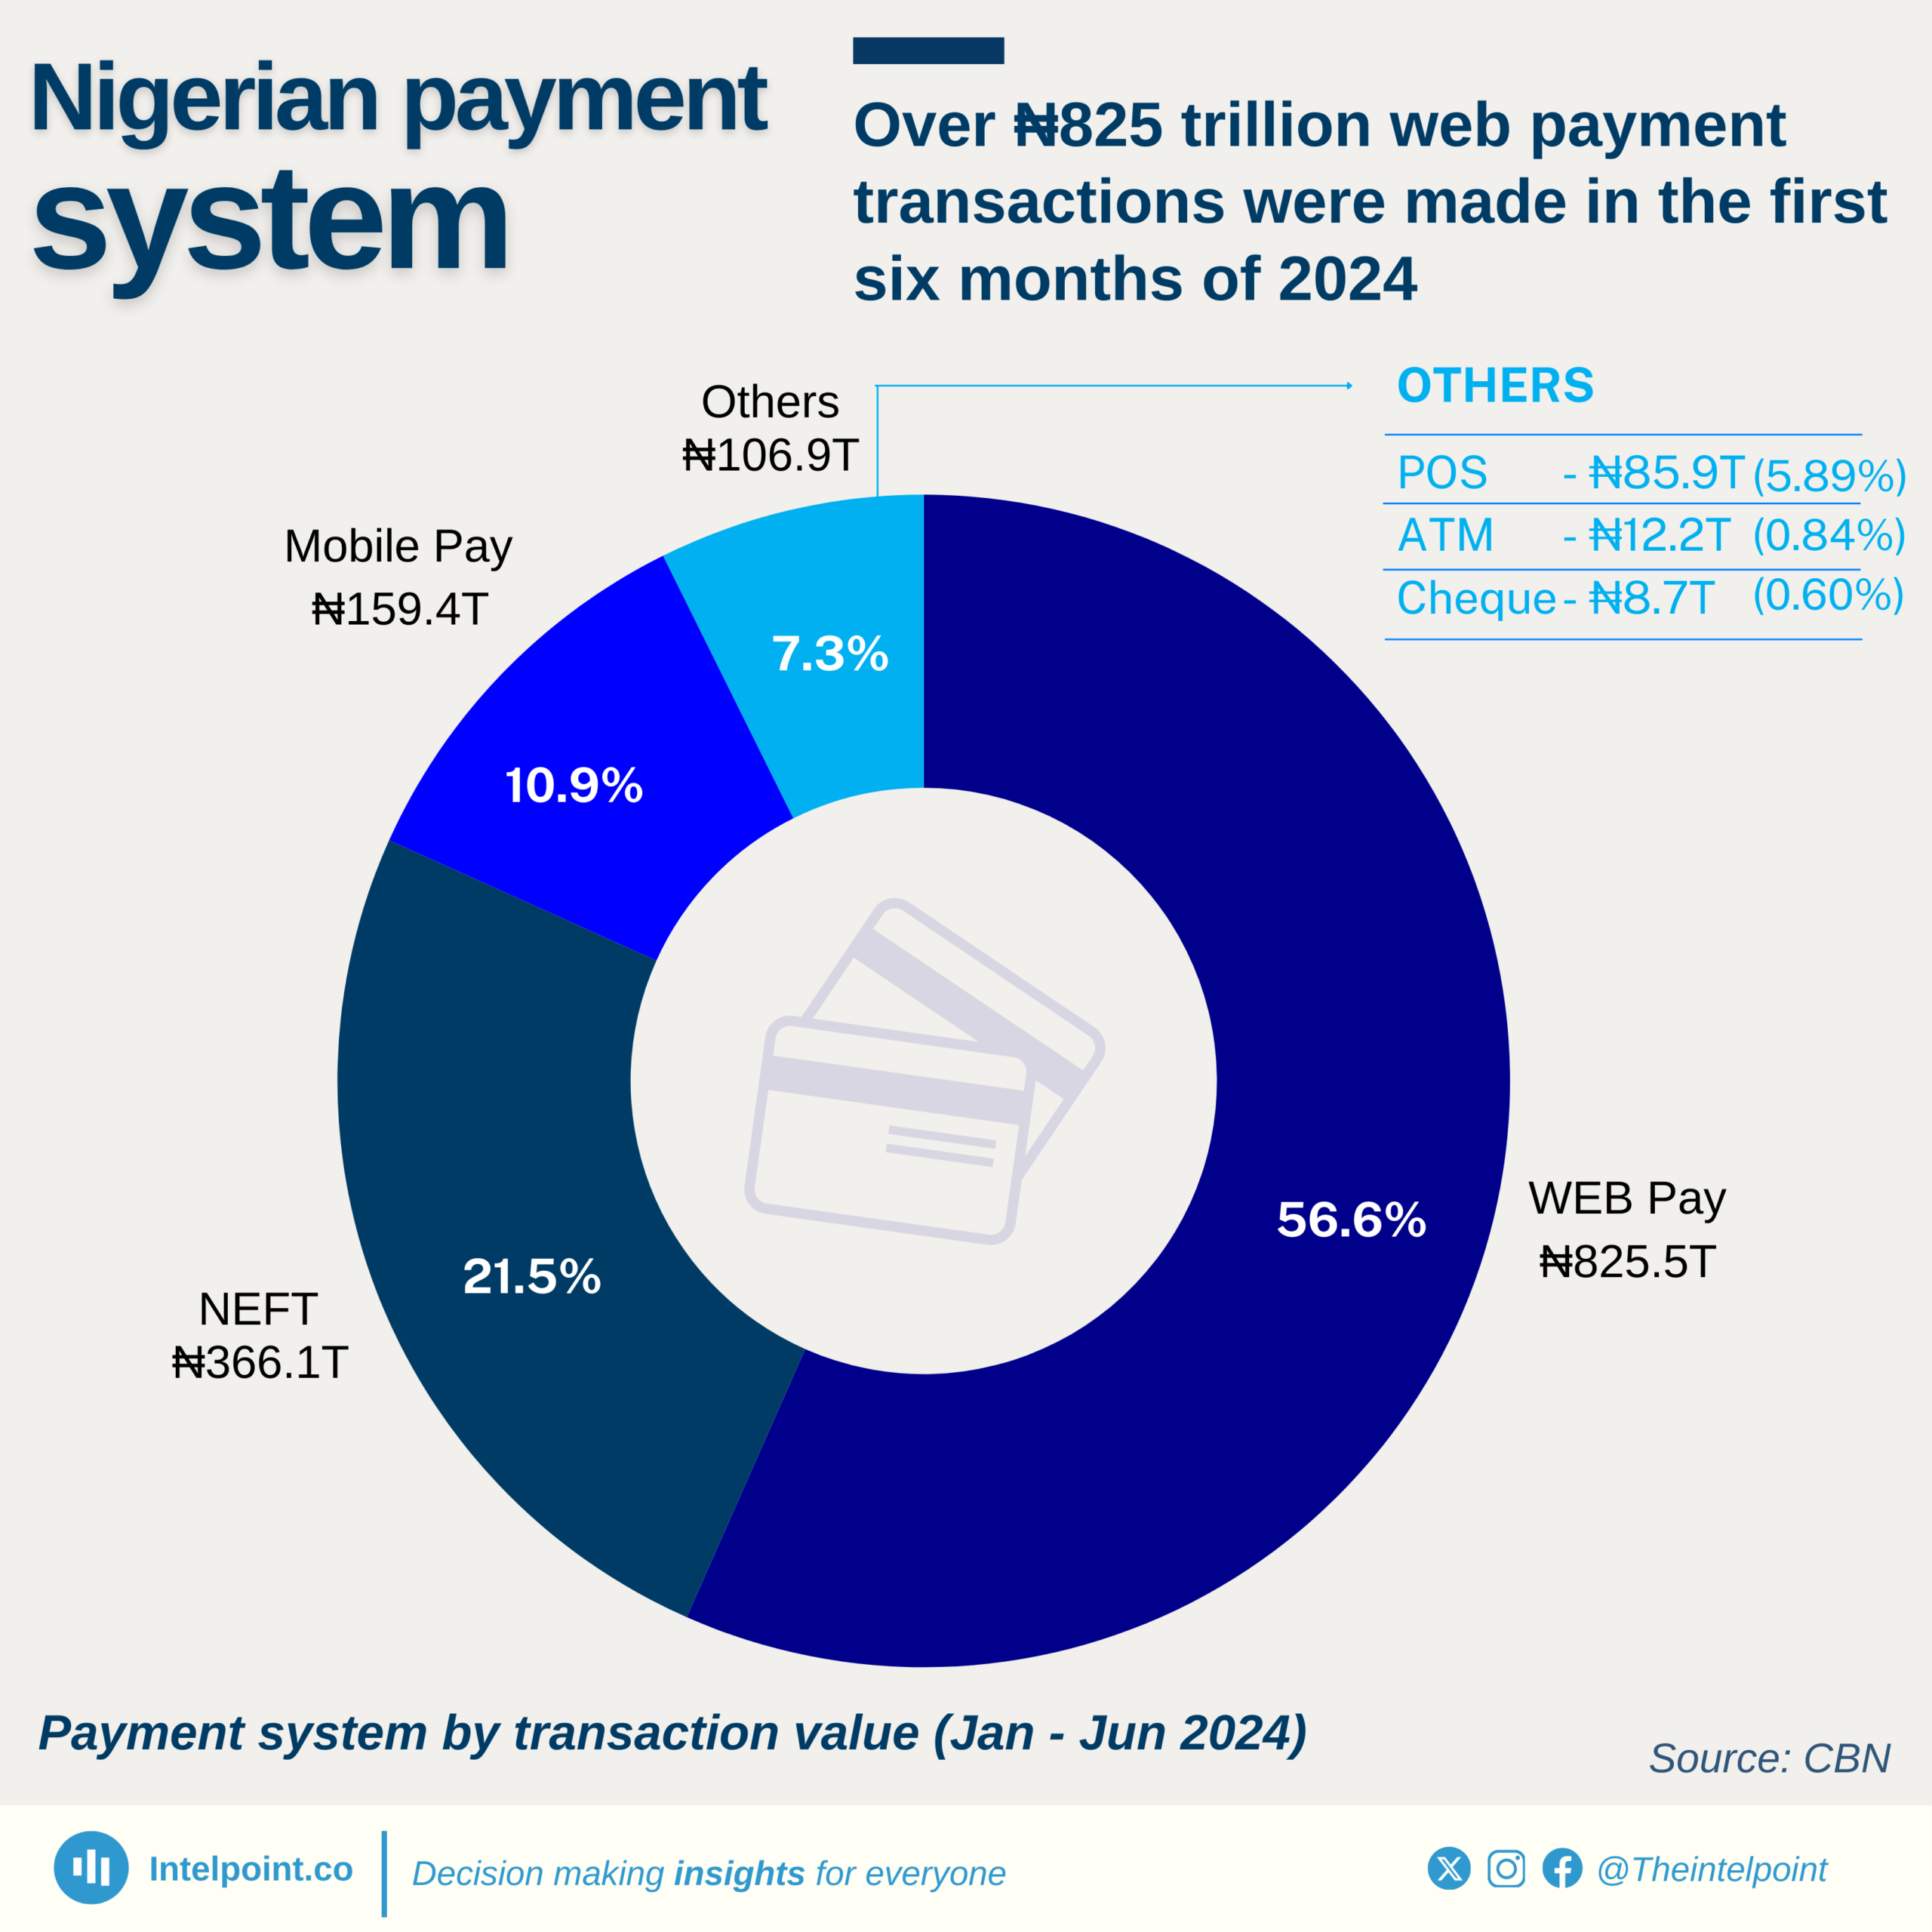
Over ₦825 trillion web payment transactions were made in the first six months of 2024

Key takeaways:

  • Web payment amassed a total transaction value of ₦825.5 trillion, showcasing its dominance in both frequency and financial significance.
  • With a Constant Annual Growth Rate of 150.4% (in volume) and 208.9% (in value), Web Pay has been leading the Nigerian Payment System in both transaction volume and value since 2020.
  • Mobile payments contribute 15.8% of transaction volume and 10.9% of transaction value, indicating growing adoption among tech-savvy users.
  • NEFT transactions represent 21.5% of the total transaction value, reflecting their importance for transferring large sums.
  • The dominance of web payments reflects Nigeria's ongoing transition to a cashless economy and widespread digital adoption.

The first half of 2024 highlights the dominance of web payment systems in Nigeria, accounting for 52.7% of all transactions by volume and 56.6% by value. With about 11.64 billion transactions and ₦825.5 trillion in value, web payments lead the payment system landscape, solidifying its role as the go-to choice for seamless and efficient transactions. This shows Nigeria’s growing reliance on digital platforms for economic activity, paving the way for a cashless society.
Point-of-sale (POS) terminals and mobile payments also demonstrate strong adoption, contributing 29% and 15.8% of transaction volume, respectively. However, when analysed by value, NEFT (National Electronic Funds Transfer) ranks second, holding 21.5% of the total transaction value, indicating its preferability for high-value transactions.
Source:

CBN

Period:

2024
HTML code to embed chart
Want a bespoke report?
Reach out
Tags
Related Insights

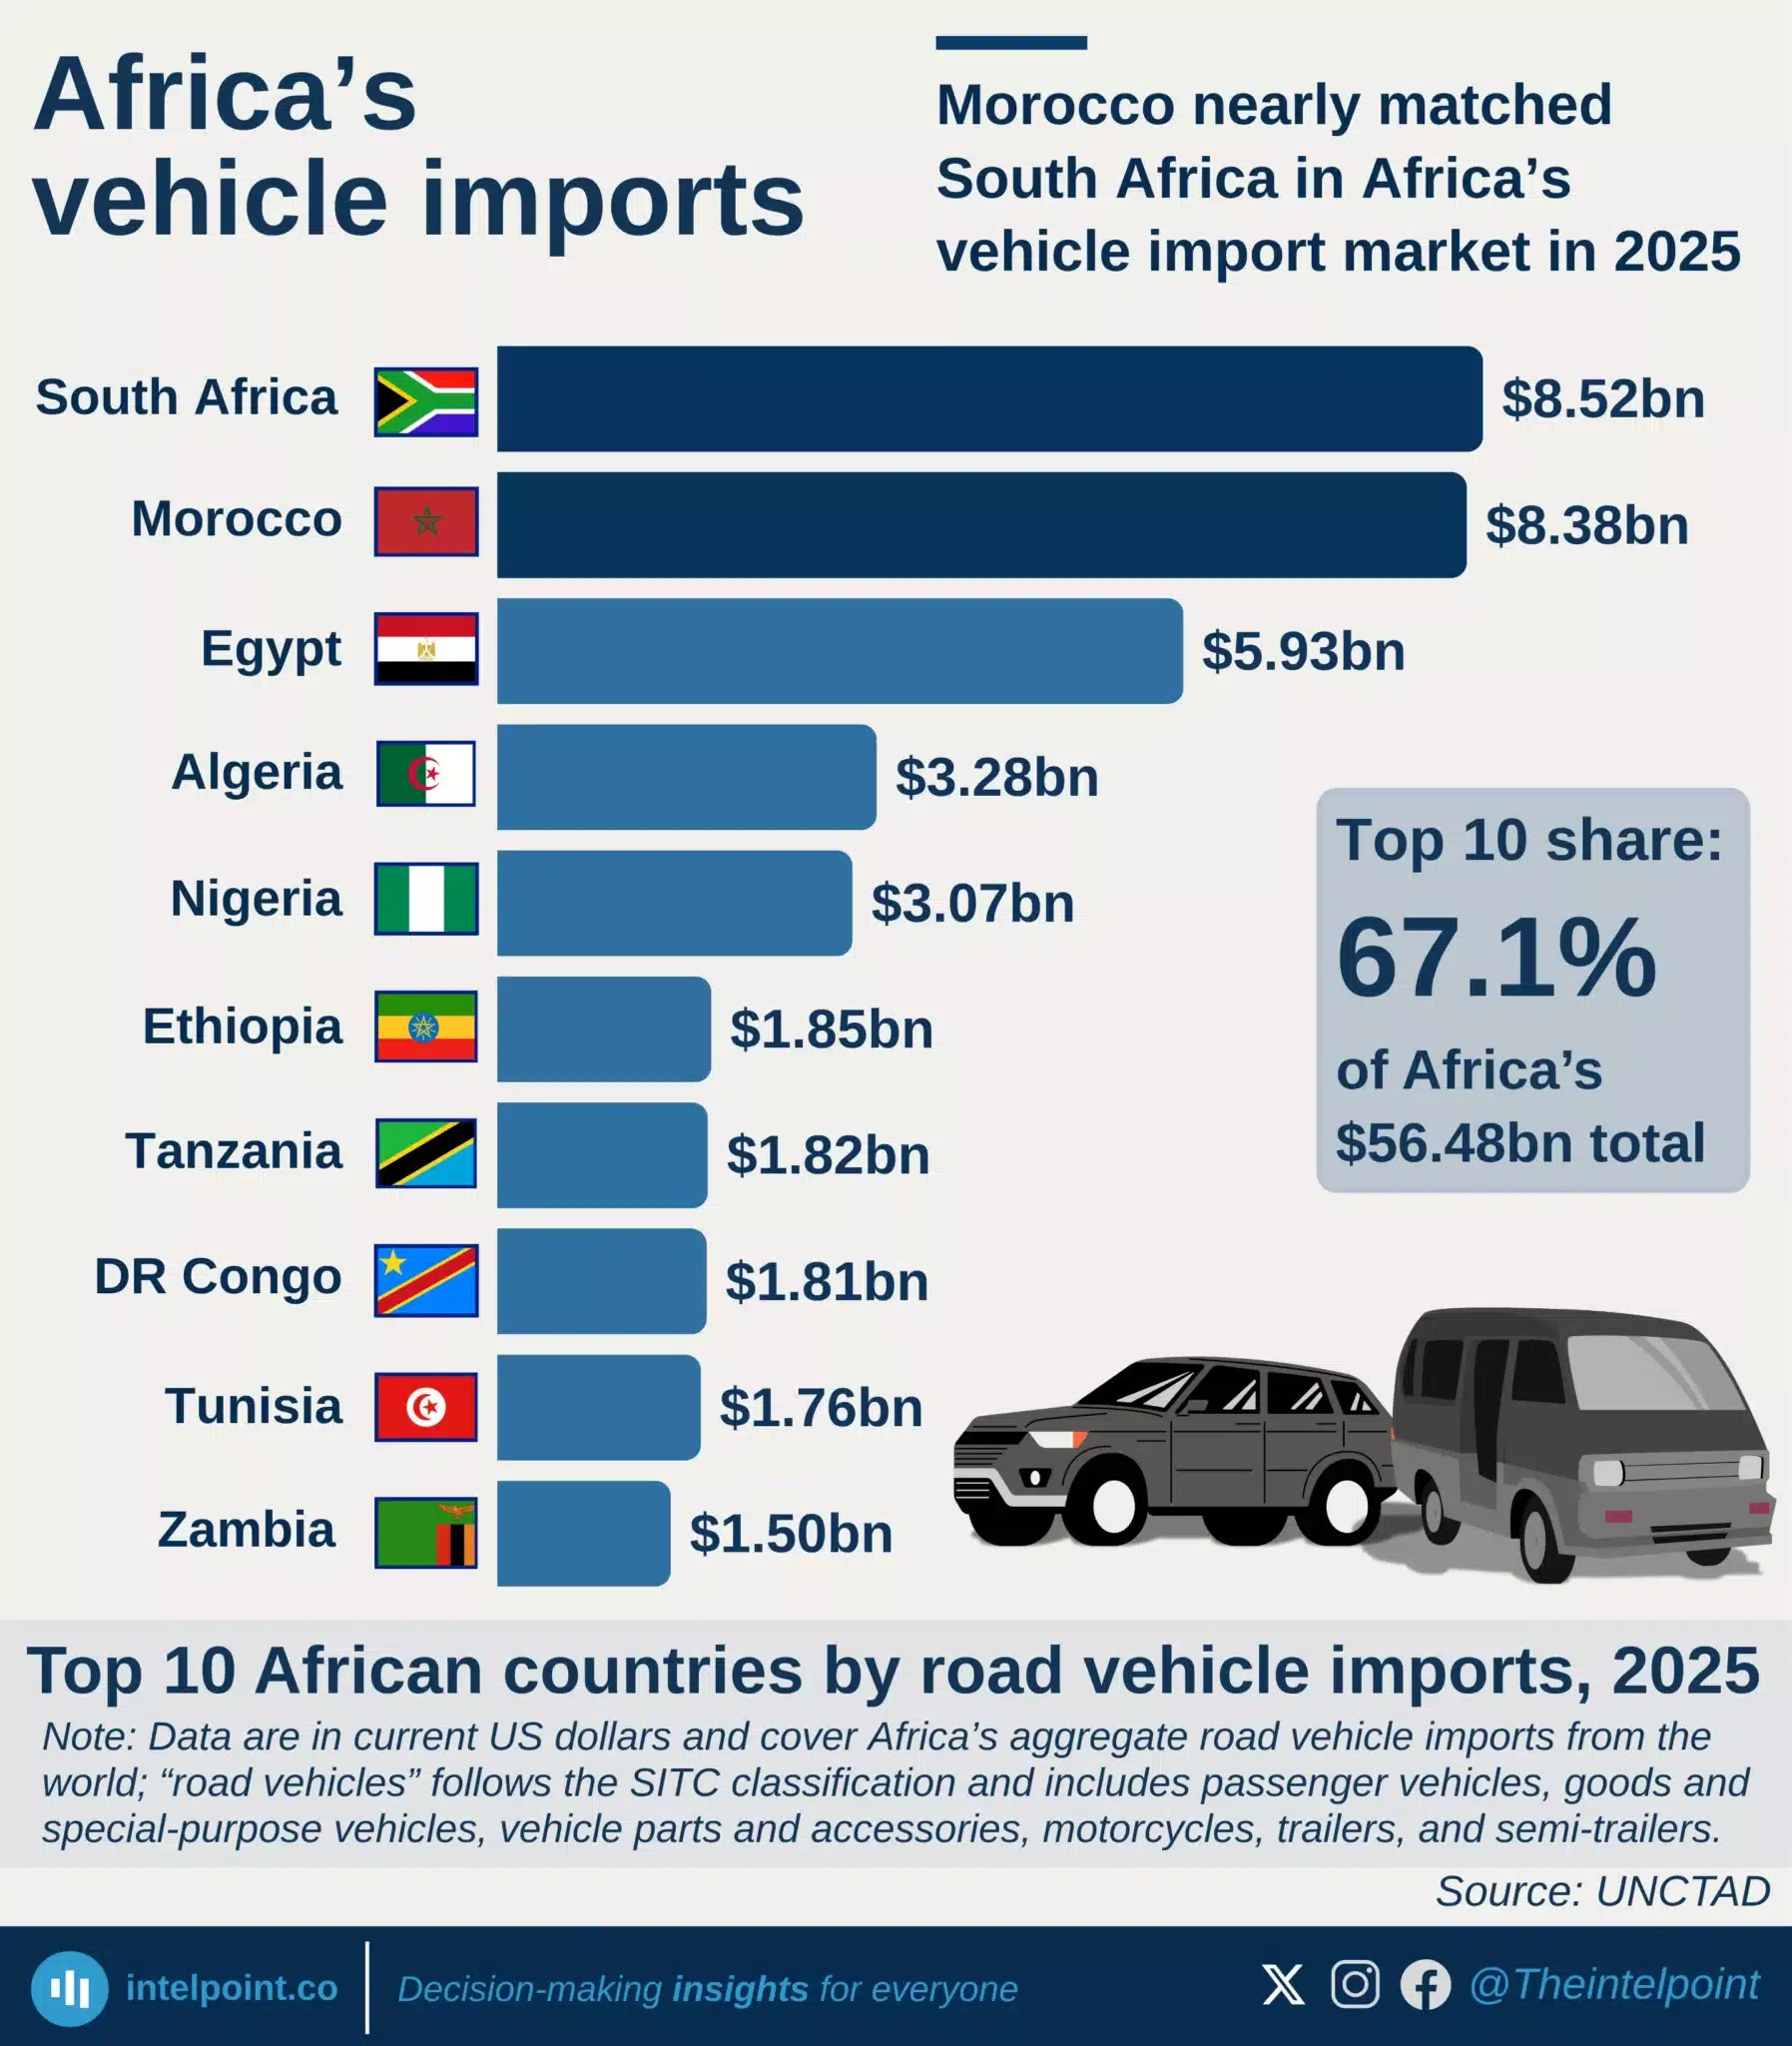
Morocco nearly matched South Africa in Africa’s vehicle import market in 2025
  • South Africa led with $8.52 billion, only $140 million ahead of Morocco.
  • Morocco’s imports have grown steadily, while South Africa’s 2025 figure was a recovery toward its 2012 peak.
  • Egypt ranked third, followed by Algeria and Nigeria.
  • The top 10 markets accounted for 67.1% of Africa’s $56.48 billion total.
  • Road vehicle imports include vehicles, parts, motorcycles, trailers, and semi-trailers.

Africa’s merchandise exports to China in 2025
  • Africa exported a record $86.2bn worth of goods to China in 2025.
  • China received about 12.5% of Africa’s total merchandise exports.
  • Annual exports remained below $10bn until 2004, before accelerating sharply.
  • Export values have remained relatively high since 2021 despite earlier downturns.
  • The trade relationship remains heavily commodity-led, with limited manufactured exports.

Africa’s export map changed, but only three economies escaped heavy reliance on one buyer
  • Only 3 of 52 African economies met the export-market diversification test in 2025.
  • Nigeria recorded the largest and most sustained shift, with its top-buyer share falling from 43.1% to 9.9%.
  • Madagascar’s top-market share dropped from 40.0% to 14.9% and has remained below 20% since 2021.
  • Libya narrowly qualified at 19.5%, after remaining above the threshold in 2024.
  • The test measures reduced dependence on one export destination, not greater product diversification.

South Africa, Egypt and Morocco accounted for nearly 40% ($313b) of Africa’s merchandise imports in 2025
  • Africa imported merchandise worth $788.9 billion in 2025, representing about 3% of global merchandise imports.
  • South Africa was Africa’s largest merchandise importer, with imports valued at $128.1 billion.
  • Egypt ranked second at $97.5 billion, followed by Morocco at $87.4 billion.
  • The three largest importers accounted for $313 billion, or 39.7% of Africa’s total merchandise imports.
  • South Africa alone accounted for about 16.2% of the continental total.
  • The five largest importers, including Algeria and Nigeria, were responsible for $404.6 billion, or 51.3% of Africa’s imports.
  • Nigeria ranked fifth, with merchandise imports valued at $41.5 billion.

Africa has never sold more than 20% of its goods exports within the continent in three decades
  • Only 16.9% of Africa’s merchandise exports were sold to other African countries in 2024.
  • Africa had the second-lowest intra-continental export share, ahead only of Oceania’s 4.8%.
  • Europe recorded the highest share at 65.6%, followed by Asia at 58.4% and the Americas at 54.0%.
  • Europe’s intra-continental export share was nearly four times Africa’s.
  • Africa’s share increased from 12.1% in 1995 to 16.9% in 2024, a rise of 4.8 percentage points.
  • Despite this long-term improvement, Africa remained below its 2015 peak of 18.8%.
  • Africa has not crossed the 20% mark at any point in the three decades covered.

South Africa accounted for nearly $1 in every $6 Africa earned from merchandise exports in 2025
  • Africa’s merchandise exports reached $689.2 billion in 2025.
  • Exports grew by 9.7%, the fastest rate outside Asia.
  • Africa accounted for just 2.6% of global merchandise exports.
  • South Africa led with $116.4 billion, followed by Nigeria and Egypt.
  • The top 15 economies generated 79.3% of Africa’s exports.

POPULAR TOPICS
SIGN UP TO OUR NEWSLETTER
Get periodic updates about the African startup space, access to our reports, among others.
Subscribe Here
Subscription Form

A product of Techpoint Africa. All rights reserved