Bite-sized Insights about
 
Providing you with data-based insights about things happening around you.
Popular Insights
  • Global inflows of foreign direct investment fell by 12% in 2022, and Africa saw a 44% decline from $80 billion in 2021 to $45 billion. According to UNCTAD data, only two of Africa's five major regions — North and East Africa — saw a rise in FDI in 2022.
    See more

    In Q2 2023, Nigeria collected 10% more VAT than in the first quarter, 30% more than in Q2 2022, 53% more than in Q2 2021, and 555% more than 40 quarters ago in Q2 2013. Do you see VAT collections reaching one trillion naira soon?

    See more
  • A Trend of Adult literacy rates of African countries

    Between 2018 and 2021, adult literacy rates across African nations exhibited significant disparities. Seychelles and South Africa led with literacy rates of 96% and 95%, respectively, indicating a high proportion of literate adults. Conversely, Chad had the lowest literacy rate during this period.

    These statistics underscore the uneven progress in educational attainment across Africa, highlighting the need for targeted interventions to improve literacy in lower-performing nations.

    See more

    Inflation rate in Nigeria increased to 31.7% in February 2024. Nigeria has the 13th highest inflation rate out of 186 countries and territories as of February 2024.

    The data showcases Argentina leading with 276%, followed by Lebanon and Syria. Seven of the top fifteen are African.

    See more
  • Nigeria was the seventh most populous nation in the world in 2020, with 206.1 million people. Projected to reach a population of 401.3 million by 2050, Nigeria will rank third after India (1st) and China (2nd). According to Institut national d'études démographiques' projections, Nigeria, Ethiopia, DR Congo, Egypt, Tanzania, and Kenya will be among the world’s top 20 most populous countries by 2050.
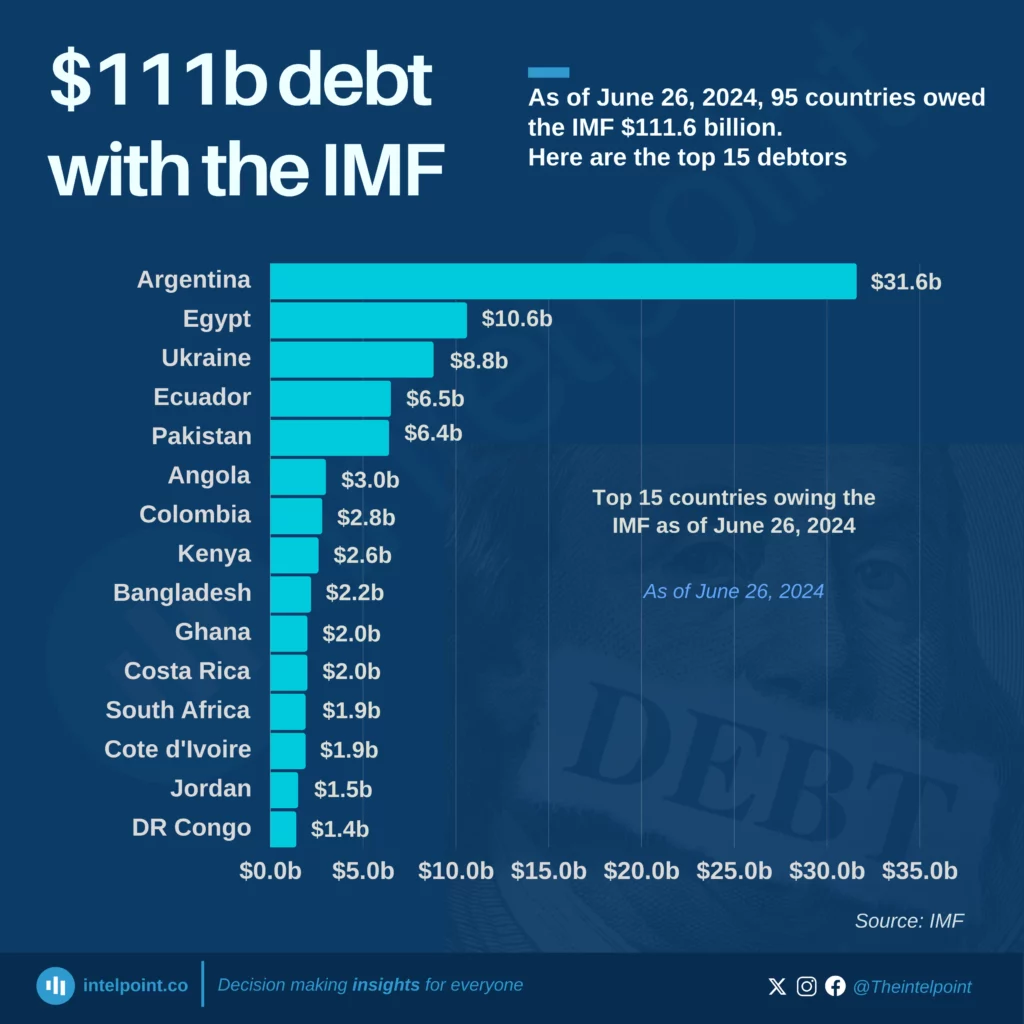
    See more
    Top ten African countries by estimated number of films produced annually

    The Nigerian movie industry, mainly financed via public or private funding and international grants, produces the most films in Africa, yearly. Nigeria produced more than double the number of films that the Ghanaian and Kenyan movie industries produce annually.

    See more

    • The GDP contribution from the telecom sector increased from 14.13% in Q1 2023 to 16.36% in Q2 2024.
    • The highest contribution (16.36%) was seen in Q2 2024.
    • The telecom sector contributes significantly to GDP, maintaining values above 10% quarterly from Q1 2020 to Q3 2024.
    • The second quarter consistently contributed more to Nigeria’s GDP throughout the observed timeframe.
    • The first and second quarters of 2024 showed an improvement in the sector's contribution to GDP compared to the previous years.
    See more
  • Only 10% of Nigerians earn above ₦100,000, according to the Nigerian Financial Services Market Report. This aligns with most reports about Nigeria, and it's in sharp contrast to the narratives online.
    See more
  • A Trend of Adult literacy rates of African countries

    Between 2018 and 2021, adult literacy rates across African nations exhibited significant disparities. Seychelles and South Africa led with literacy rates of 96% and 95%, respectively, indicating a high proportion of literate adults. Conversely, Chad had the lowest literacy rate during this period.

    These statistics underscore the uneven progress in educational attainment across Africa, highlighting the need for targeted interventions to improve literacy in lower-performing nations.

    See more

Other Insights
  • MTN dominates submarine fibre optic deployment among GSM operators in Nigeria, increasing its network from 1,500 km in 2018 to 17,984 km in 2022
  • Glo had the earliest and largest submarine fibre deployment, peaking at 19,200 km in 2012, but later scaled down to 9,800 km from 2014 onwards
  • Airtel has not invested in submarine fibre, with its network remaining below 25 km throughout the period
  • 9mobile has not deployed any submarine fibre cable since 2012
See more
  • Airtel has shown the most aggressive fibre optic expansion, increasing from 4,632 km in 2012 to 16,112 km in 2022
  • Glo initially led with 16,224 km in 2012, but its fibre optic deployment later declined and stabilised around 13,000 km from 2018 to 2022
  • Between 2019 and 2022, MTN's deployment remained unchanged at 14,612 km
  • 9mobile's fibre deployment peaked in 2018 at 4,650 km and remained unchanged till 2022
See more
  • Dangote Cement has grown its revenue consistently since 2014 and reached a historic ₦3.6 trillion in 2024
  • Revenues have more than tripled between 2020 (₦1.0 trillion) and 2024 (₦3.6 trillion)
  • The year-on-year growth rate shows fluctuations, with declines in some years and sharp rebounds in 2020, 2022, and 2024
  • The highest year-on-year growth occurred in 2024 (62.2%), signalling a particularly strong performance
See more
  • Nigeria’s active mobile GSM lines reached an all-time high of 224 million in 2023, up from 222 million in 2022.
  • The number of active lines has grown steadily from 40 million in 2007, with notable surges in 2012 (110 million), 2018 (172 million), and 2020 (204 million).
  • Growth slowed between 2016 and 2017, where active lines dipped slightly from 154 million to 145 million, before resuming an upward trajectory.
  • With over 220 million active lines, Nigeria remains one of Africa’s largest telecom markets, driven by increasing mobile adoption.
See more
Africa's debt-to-GDP ratio (2024 vs 2028)
  • Unlike other regions, Southern Africa’s debt-to-GDP ratio is expected to increase by 5.8 percentage points, reaching 77.4% by 2028.
  • Northern Africa is set to achieve the largest debt-to-GDP decline of 14.7 percentage points, from 84.2% to 69.5%, indicating significant fiscal adjustments.
  • Central Africa is expected to see a 12 percentage point drop, reducing its debt-to-GDP ratio from 45.8% to 33.8%.
  • West Africa’s debt-to-GDP ratio is projected to fall by 4.3 percentage points, while Eastern Africa is expected to drop by 5.2 percentage points, both showing signs of improved debt management.
  • Even with the projected declines, some regions like Northern Africa (69.5%) and Southern Africa (77.4%) will still have high debt burdens compared to others like Central Africa (33.8%).
  • The declining debt-to-GDP ratios in most regions suggest either economic expansion or strategic debt control, but Southern Africa’s increase indicates potential fiscal stress.
See more
  • Nigeria's largest cement manufacturers each recorded over 50% revenue growth in 2024
  • BUA Cement recorded the largest revenue growth in 2024 (90.5%), nearly doubling its revenue from ₦460 billion in 2023
  • Dangote Cement's revenue exceeded the combined revenue of BUA Cement and Lafarge Africa in both 2023 and 2024
  • Lafarge Africa earned ₦696.8 billion in revenue, the lowest revenue of the three cement majors
See more

Key takeaways:

  • Tecno (23.55%) and Infinix (21.73%) lead the Nigerian mobile market, making up a combined 45.28% of the market share.
  • Samsung (12.36%) is the leading non-Chinese brand, with Apple (9.43%) following closely behind.
  • Xiaomi (7.15%) and Huawei (4.34%) are emerging as significant players in Nigeria's mobile sector.
  • Premium brands such as Samsung (12.36%) and Apple (9.43%) have considerable but smaller market shares compared to their Chinese counterparts.
  • Chinese manufacturers collectively dominate over 60% of the mobile market in Nigeria.
See more

Key takeaways:

  • In February 2025, Samsung and Apple dominate the mobile market in Africa.
  • Samsung leads with a 29.80% share of the continent's mobile market based on usage.
  • Apple ranks second with a 13.27% share, demonstrating resilience in markets sensitive to pricing.
  • Collectively, Chinese manufacturers hold more than 45% of the mobile market in Africa.
  • Brands under Transsion Holdings (Tecno, Infinix, Itel) together represent nearly 25% of the total market share based on usage.
See more

Key Takeaways:

  • In 2023, Kiribati spent the largest % of its GDP on education, amounting to 16.39%.
  • Kiribati, Tuvalu, and Vanuatu each allocated over 10% of their GDP to education.
  • Bolivia and the Solomon Islands each directed around 8.3% of their GDP spending towards education.
  • The top ten countries dedicated approximately 6.6% to 16.4% of their GDP to education.
See more
  • Lagos carried the South-West VAT burden, remitting ₦305.52B (89.6% of the region's total) but receiving only ₦62.59B (20.5% return), making it the highest net contributor in Nigeria.
  • Osun had the most disproportionate gain, remitting a mere ₦590M but receiving ₦7.73B, an astronomical 1,211% return—the highest redistribution gain in the South-West.
  • The entire South-West remitted ₦341.18B but received only ₦106.85B, meaning it got back just ₦0.31 for every ₦1 contributed, highlighting a severe VAT allocation imbalance.
  • Ondo and Ogun remitted only ₦3.3B but received ₦16B combined, far exceeding their generated VAT, while Lagos alone subsidised most of the allocations across the country.
See more
  • The South-East remitted ₦10.94 billion in VAT but received ₦39.15 billion, a 257.7% increase, showing a high reliance on VAT sharing.
  • Abia, the lowest contributor (₦734M), received ₦7.29B, nearly 10× its remittance, making it the biggest relative beneficiary in the region.
  • Anambra, the highest contributor (₦3.56B), received only ₦8.72B, showing a sharing trend where high-contributing states do not necessarily receive the most.
  • Every South-East state received at least 2× what they remitted, with an average allocation of ₦7.83B despite an average contribution of just ₦2.19B.
See more
  • The North-West region received ₦66.55 billion, more than double its remittance (₦28.31B), showing a heavy reliance on federal VAT sharing.
  • Zamfara, the lowest contributor (₦1.45B), received the highest percentage gain (+433%), getting ₦7.72B, while Kano, the highest contributor (₦9.59B), had the smallest relative gain (+41.5%).
  • Kaduna and Katsina, despite remitting ₦3.50B and ₦3.86B, received ₦10.18B and ₦10.01B, respectively, nearly tripling their remittance.
  • Kano remitted 34% of the zone’s VAT but received only 20.4% of the total allocation, reinforcing that VAT is distributed based on equality and not economic strength.
See more
1 25 26 27 28 29 86
Percentage of websites globally that publish their content primarily in each language (as of 2024)
  • English alone accounts for nearly half of all global web content at 49.40%, setting the tone for internet communication.
  • The next three languages—Spanish, German, and Japanese—combined make up just 16.6%, highlighting the wide gap in representation.
  • Despite having a massive native-speaking population, Chinese is used in only 1.20% of websites.
  • Portuguese, spoken across several continents, represents just 3.80% of internet content.
  • Even major European languages like French and Russian contribute less than 5% each to global web content.
Read more
Share of internet users globally who use a health or fitness website or mobile app monthly by age group and gender (as of Q3 2024)
  • Females lead in monthly usage of health/fitness websites/apps globally across all age groups.
  • Average female usage is 24.45%, consistently higher than male usage in each age bracket.
  • Women aged 35–44 are the most engaged, with 28.6% using health or fitness platforms monthly.
  • Male usage peaks early, at 22.1% (ages 25–34), then steadily declines with age.
  • Engagement among women aged 45–64 remains strong, pointing to long-term wellness interest beyond just youth fitness trends.
Read more
Shopping queries with the highest Google search activity (index vs. top query) globally (2024)
  • iPhone was the most searched shopping query globally in 2024.
  • Half of the top 12 search queries were phone-related, showing phones dominated online shopping interest.
  • iPhone (100) and Samsung (88) were highly searched, signalling active consumer comparison between phone models.
  • Nike (84) and Adidas (46) maintained strong brand appeal in fashion and retail.
  • Amazon (52) ranked high despite being a platform, not a specific product.
  • Apple (30) appeared lower in rank than specific Apple products, suggesting searchers prioritised items over brand pages.
  • Laptops (21) remained a significant product category globally, despite mobile dominance.
Read more
Key Takeaways:
  • Africa’s sesame seed oil production grew from 23,706 tonnes in 1961 to 217,048 tonnes in 2022, an overall increase of 815%.
  • The highest production was recorded in 2012, with an output of 375,697 tonnes, which is more than 15 times the 1961 volume.
  • Between 1961 and 2012, production rose by 1,484.8%.
  • The largest single-year increase occurred between 1969 and 1970, when production jumped from 41,456 tonnes to 101,472 tonnes.
  • After reaching its peak in 2012, production experienced notable fluctuations, settling at 217,048 tonnes by 2022.
  • The sharpest annual decline occurred in 2013, with a 38.6% drop following the 2012 peak.
Read more
Key takeaways:
  • Over the past six decades, global wine production has remained relatively stable, averaging around 28 million tonnes annually.
  • Wine production increased from 21.5 million tonnes in 1961 to 27.4 million tonnes in 2022.
  • The highest production was recorded in 1979, reaching 37.5 million tonnes.
  • The second-highest year was 1982, with a production of 37.4 million tonnes.
  • Wine production exceeded 30 million tonnes in ten different years between 1961 and 2022.
  • Between 2000 and 2022, production was consistently stable, averaging about 27 million tonnes.
  • The 2022 production of 27.4 million tonnes represented a 27.3% increase compared to 1961.
Read more
Key Takeaways:
  • African wine production peaked in 1965 at 2.39 million tonnes, the highest level recorded during the entire period.
  • The most dramatic single-year drop occurred between 1965 and 1966, when production fell by 40%, from 2.39 to 1.44 million tonnes.
  • A gradual recovery began in the early 2000s, with production consistently exceeding 1 million tonnes from 2003 onward.
  • The most recent peak occurred in 2021, with production reaching 1.23 million tonnes, a 48.5% decline from the 1965 high.
  • Despite this partial recovery, current production levels remain well below the highs of the 1960s.
  • As of 2022, African wine production stood at 1.16 million tonnes, representing a 43% decrease from 1961.
Read more
1 25 26 27 28 29 171

Can’t find what you’re looking for? Please fill the form below
Contact Form Demo
SIGN UP TO OUR NEWSLETTER
Get periodic updates about the African startup space, access to our reports, among others.
Subscribe Here
Subscription Form

A product of Techpoint Africa. All rights reserved