Bite-sized Insights about
 
Providing you with data-based insights about things happening around you.
Popular Insights
  • Lagos and the FCT attracted 98% of Nigeria’s capital imports in Q1 2023

    In Q1 2023, eight Nigerian states and the Federal Capital Territory (FCT) received $1.13 billion in capital imports. Lagos State secured $705 million (62%) and the FCT attracted $410 million (36%), adding up to 98%.

    See more

    In 1994, the IBM Simon Personal Communicator, paved the way for a digital revolution. Fast forward to 2017, when smartphone shipments peaked at 1.57 billion units. However, the subsequent six-year period witnessed a 25% decline in shipments.

    See more
  • A Trend of Adult literacy rates of African countries

    Between 2018 and 2021, adult literacy rates across African nations exhibited significant disparities. Seychelles and South Africa led with literacy rates of 96% and 95%, respectively, indicating a high proportion of literate adults. Conversely, Chad had the lowest literacy rate during this period.

    These statistics underscore the uneven progress in educational attainment across Africa, highlighting the need for targeted interventions to improve literacy in lower-performing nations.

    See more

    Nigeria was the seventh most populous nation in the world in 2020, with 206.1 million people. Projected to reach a population of 401.3 million by 2050, Nigeria will rank third after India (1st) and China (2nd). According to Institut national d'études démographiques' projections, Nigeria, Ethiopia, DR Congo, Egypt, Tanzania, and Kenya will be among the world’s top 20 most populous countries by 2050.

    See more
  • Inflation rate in Nigeria increased to 31.7% in February 2024. Nigeria has the 13th highest inflation rate out of 186 countries and territories as of February 2024.

    The data showcases Argentina leading with 276%, followed by Lebanon and Syria. Seven of the top fifteen are African.

    See more

    The FAAC's revenue distribution from 2017 to August 2023 highlights the dominance of Delta, Akwa Ibom, Rivers, and Bayelsa states in allocations. Despite Lagos' economic prominence, it ranked fifth. Here is the distribution of revenue among states between 2017 and August 2023.

    See more

  • In 2012, the volume of Point of Sale (POS) transactions in Nigeria was nearly 2.6 million, valued at ₦48 billion. As of 2022, it had grown to nearly four billion transactions worth ₦41 trillion. The volume and value of POS transactions surged between 2020 and 2022.

    See more
  • Only 10% of Nigerians earn above ₦100,000, according to the Nigerian Financial Services Market Report. This aligns with most reports about Nigeria, and it's in sharp contrast to the narratives online.
    See more
  • A Trend of Adult literacy rates of African countries

    Between 2018 and 2021, adult literacy rates across African nations exhibited significant disparities. Seychelles and South Africa led with literacy rates of 96% and 95%, respectively, indicating a high proportion of literate adults. Conversely, Chad had the lowest literacy rate during this period.

    These statistics underscore the uneven progress in educational attainment across Africa, highlighting the need for targeted interventions to improve literacy in lower-performing nations.

    See more

Other Insights

Key Takeaways:

  • In 2023, China imported $1.41 billion worth of mineral fuels and oils from Nigeria, making it the leading import category.
  • The top three import categories (mineral fuels, ores, and salt/earth materials) together made up nearly 89% of the total import value.
  • Nigeria’s exports to China are largely raw materials and natural resources, with minimal contribution from manufactured goods.
  • The top ten product categories accounted for almost 99% of China’s total imports from Nigeria.
  • Agricultural and animal products such as oil seeds, raw hides, and spices also formed part of Nigeria’s export portfolio.
  • China’s total imports from Nigeria were valued at $2.37 billion in 2023.
See more

Key Takeaways:

  • In 2023, China’s exports to Nigeria totaled $20.18 billion, while imports from Nigeria reached only $2.37 billion.
  • China’s trade surplus with Nigeria amounted to approximately $17.8 billion.
  • Chinese exports accounted for 89.5% of the total bilateral trade, with Nigerian exports making up just 10.5%.
  • The trade imbalance underscores Nigeria’s strong dependence on Chinese goods and industrial inputs.
  • For every $1 Nigeria exports to China, it imports $8.50 worth of Chinese products.
See more
Somalia’s official exchange rate (Somali Shilling per US$), 2015 - 2024
  • Somalia’s currency has depreciated by 26.4% between 2015 and 2024.
  • The sharpest yearly depreciation was in 2019, at 4.64%.
  • From 2020 to 2021, the SOS saw its smallest year-on-year shift at 1.08%.
  • Despite fluctuations, every year from 2015 to 2024 recorded a net increase in SOS per US$.
  • 2017 recorded near-stable currency performance with just a 0.16% change from the previous year.
See more

Key Takeaways:

  • Africa's gold production grew steadily from 621.78 tonnes in 2010 to 1,003.98 tonnes in 2023.
  • The continent experienced an overall increase of 61.5% in gold output over the 14 years.
  • The continent saw consistent year-on-year growth, with only minor declines in 2020 and 2022.
  • 2023 marked the highest production level in more than a decade.
  • The average annual growth rate in gold mine production over the period was approximately 4%.
See more

Key Takeaways:

  • Global gold production rose from 2,830.80 tonnes in 2010 to 3,646.07 tonnes in 2023.
  • The most significant year-over-year growth occurred between 2012 and 2013, with an increase of over 178 tonnes.
  • A temporary decline in production was recorded in 2019 and 2020, reflecting pandemic-related disruptions.
  • Production recovered quickly post-pandemic, reaching a record 3,646.07 tonnes by 2023.
  • Over the last fourteen years, gold mine output grew at an average annual rate of approximately 2%.
  • Growth from 2021 to 2023 was more moderate compared to earlier years.
See more
Strongest African currencies by annual average official exchange rate (LCU per US$) in 2024
  • Tunisia held the top spot with the strongest African currency, trading at 3.11 TND per USD in 2024.
  • Libya followed as the second-strongest, with an exchange rate of 4.83 LYD per USD.
  • Morocco maintained a strong regional position, with its dirham trading at 9.94 MAD per USD.
  • Botswana’s pula was relatively stable, exchanging at 13.56 per USD, highlighting Southern Africa’s economic steadiness.
  • Ghana and Seychelles had closely matched exchange rates, trading at 14.48 and 14.53 to the dollar, respectively.
  • South Africa, Lesotho, Namibia, and Eswatini all shared almost identical exchange rates of around 18.32–18.33 per USD, showing tight regional monetary coordination.
See more
Africa's regional economic performance (2024), regional averages
  • Eastern Africa is the continent's fastest-growing region in 2024 with a GDP growth rate of 5.39%, but it also faces the highest inflation at 17.76%.
  • Southern Africa has the lowest inflation (3.48%) but also the highest unemployment by far, at 28.64%.
  • Western Africa combines growth (3.57%) with low unemployment (4.53%), positioning it as a relatively stable economic zone.
  • Central Africa and Northern Africa both lag in GDP growth, at 1.40% and 2.90% respectively, with Central Africa also experiencing moderate inflation and interest rates.
  • Interest rates are highest in Western (10.84%) and Eastern Africa (10.12%), reflecting tighter monetary policies likely aimed at controlling inflation.
  • Northern Africa’s 11.15% unemployment rate suggests underlying labour market issues despite moderate inflation and interest rates.
  • Southern Africa's low interest rate (6.29%) hasn't translated into job creation, indicating that monetary easing alone isn't resolving unemployment challenges.
See more
Share of internet users by type of app usage (worldwide) as of 2024 Q3
  • Chat and Messaging apps lead globally, engaging 94.5% of internet users as of Q3 2024.
  • Social Networks follow closely behind at 94.4%, nearly matching messaging apps in global user engagement.
  • Search Engines and Web Portals still see high use, engaging 82.3% of users.
  • Email services remain highly relevant, used by 75% of internet users globally.
  • Shopping, Auctions, and Classifieds apps are also prominent, used by 74.9% of users.
  • Location-based services like maps and ride-sharing apps engage 55.3%, indicating a strong but more practical use case.
  • Games remain a niche category, with only 32.6% of users engaging with gaming apps compared to much higher engagement with communication or shopping platforms.
See more

Key takeaways:

  • The United States holds the largest national gold reserves in 2024, totalling 8,133.46 tonnes.
  • Western European countries in the top ten list collectively hold 9,892.76 tonnes of gold reserves.
  • China, India, and Japan are the only Asian countries in the top 10, together holding 4,001.71 tonnes.
  • The Russian Federation is the leading gold reserve holder in Central and Eastern Europe, with 2,332.74 tonnes.
  • All countries in the top ten list maintain at least 600 tonnes of gold reserves.
  • The total gold reserve held by the top ten countries amounted to 24,360.67 tonnes.
See more

Key takeaways:

  • China leads all nations with total reserves of $3.46 trillion while holding 5.53% of its share in gold reserves.
  • The top 15 countries collectively hold a total reserve of $10.78 trillion.
  • Despite being the global leader in gold reserves, the United States ranks third in total reserves.
  • The largest share of the United States' total reserves is from its gold reserve holdings of 74.97%.
  • Countries in the top fifteen list hold at least $236.9 billion each in total reserves.
  • The United States, France, and Italy have more than 70% of their total reserve holdings in gold.
See more

Key Takeaways:

  • Ghana led the continent in gold production in 2023, producing 135.11 tonnes, 13.5% of Africa’s total.
  • Four countries (Ghana, Mali, South Africa, and Burkina Faso) each produced over 95 tonnes, together accounting for 443 tonnes or 44.1% of the continent’s output.
  • West African countries dominated the rankings, with eight nations from the region among the top 15 producers.
  • The West African countries in the top 15 combined contributed 525.55 tonnes, more than half (52.3%) of Africa's total gold production.
  • South Africa ranked third in Africa with 104.29 tonnes.
  • Burkina Faso ranked fourth while contributing almost 10% of Africa’s gold production.
See more

Key Takeaways:

  • In 2023, Africa was the world’s leading gold-producing region, with a total output of 1,003.98 tonnes.
  • Asia followed with 661.30 tonnes, representing 18.1% of the world’s gold output.
  • The Commonwealth of Independent States (CIS) produced 570.90 tonnes, making up 15.7% of the global total.
  • North America and Central & South America contributed 485.17 tonnes and 542.13 tonnes, respectively.
  • Oceania was a key producer with 343.29 tonnes, or 9.4% of global output.
  • Europe contributed the least, producing only 39.30 tonnes, which is about 1.1% of the total.
  • Altogether, global gold production reached 3,646.07 tonnes in 2023.
See more
1 43 44 45 46 47 115
  • Endeavour Mining leads with a 2,253.0 pence share price — the highest among the largest African firms on the LSE.
  • Investec ranks second at 544.4 pence, showing a wide gap from the leader.
  • Seplat Energy (255.5 pence) is the second-highest in the extractive industry after Endeavour Mining.
  • Airtel Africa (210.0 pence) is the top telecom firm on the list.
  • Guarantee Trust HoldCo has the lowest share price at 5.0 pence.
Read more
  • The combined market cap of the top 10 African firms on the LSE is £29.8B.
  • Airtel Africa leads with £7.32B, the largest market cap among African-listed companies.
  • Endeavour Mining follows with £5.63B, making it the largest extractive industry player on the list.
  • Commercial International Bank is the top financial services firm with £4.27B.
  • Five companies from financial services are in the top 10, collectively representing a major sectoral share.
  • The telecom sector is represented by Airtel Africa and Helios Towers (£1.25B), showing telecom’s increasing investment appeal.
  • Nigeria has two companies — Guarantee Trust HoldCo and Seplat Energy — [each] with over £1B market cap.
Read more
  • In Africa, 275 million people were recorded to be malnourished in 2023.
  • Nigeria led the list of countries in Africa with the highest number of malnourished people (45.40 million), making 16.5% of the total.
  • Nigeria was followed by the Democratic Republic of Congo with 40.7 million, 14.8% of the total.
  • Nigeria, the Democratic Republic of Congo, Ethiopia and Kenya made up almost 50% of the total number of malnourished people in Africa.
Read more
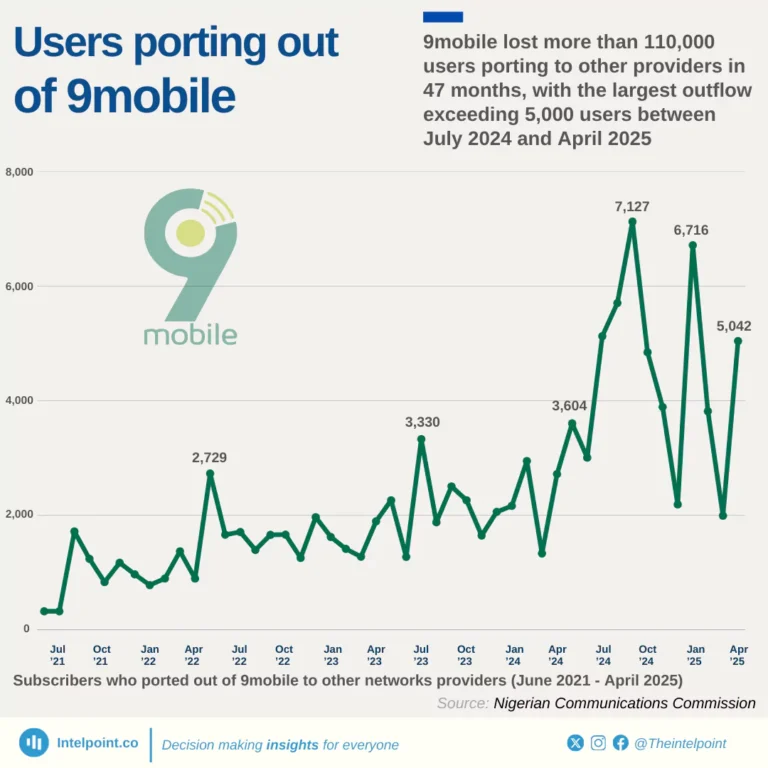
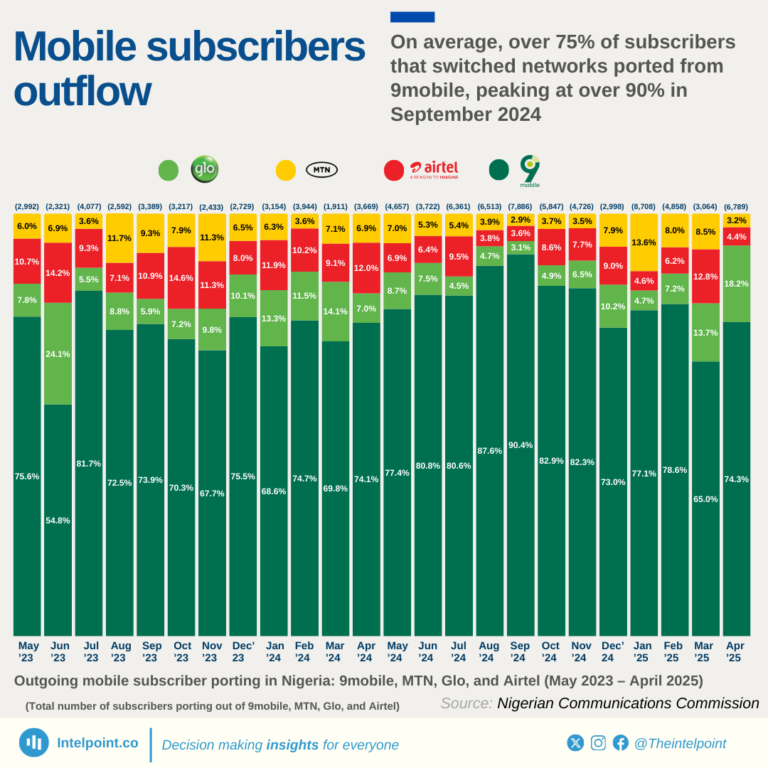
  • From H2 2013 to H1 2020, 9mobile gained more subscribers from other networks than it lost.
  • From H2 2021 onward, more subscribers left 9mobile for other networks than joined.
  • Net half-year losses grew from about 5,143 in H2 2021 to 28,735 in H2 2024.
  • Outgoing ports peaked at 28,885 in H2 2024, the highest half-year total on record.
Read more
  • India produced 25.4 million metric tonnes of ginger since 1961 — more than any other country by far.
  • India’s 2021 harvest of 2.22 million tonnes is the highest single-year output ever recorded.
  • Nigeria is now the second-largest global producer, but its total output (10.1 million tonnes) is less than half of India’s.
  • Global ginger production is highly volatile, with year-on-year changes fluctuating by an average of nearly 10%.
  • Just five countries — India, China, Nigeria, Nepal, and Indonesia — account for the vast majority of global output.
  • Production has expanded over time, but remains concentrated in Asia and parts of Africa.
Read more
  • Angola and Ethiopia account for the highest debt service-to-GDP ratios in Africa, both exceeding 67%.
  • East Africa dominates the high debt-servicing bracket, with five countries among the top ten most burdened.
  • Algeria has the lowest debt service-to-GDP ratio on the continent at just 0.10%.
  • There’s a wide gap between the top and bottom debt service burdens, reflecting divergent fiscal paths across Africa.
  • Low debt servicing doesn’t automatically mean economic strength—it may reflect limited borrowing capacity.
Read more
1 43 44 45 46 47 230

Can’t find what you’re looking for? Please fill the form below
Contact Form Demo
SIGN UP TO OUR NEWSLETTER
Get periodic updates about the African startup space, access to our reports, among others.
Subscribe Here
Subscription Form

A product of Techpoint Africa. All rights reserved