MTN Nigeria has dominated the country's telecommunications market over the years, accounting for the largest market share. All four operators, apart from 9mobile, recorded a significant increase in their subscriber base between May 2014 and March 2024.

The 2024 Global Peace Index reveals a decline in peacefulness in 97 countries, the highest since the index began.
Nigeria is among the nations affected by regional conflicts and rising violence. With a peace index score of 2.91, Nigeria is facing increasing challenges.
A deteriorating peace score impacts foreign investment and economic stability. Global economic losses due to violence reached $19.1 trillion in 2023.

Between 2018 and 2021, adult literacy rates across African nations exhibited significant disparities. Seychelles and South Africa led with literacy rates of 96% and 95%, respectively, indicating a high proportion of literate adults. Conversely, Chad had the lowest literacy rate during this period.
These statistics underscore the uneven progress in educational attainment across Africa, highlighting the need for targeted interventions to improve literacy in lower-performing nations.
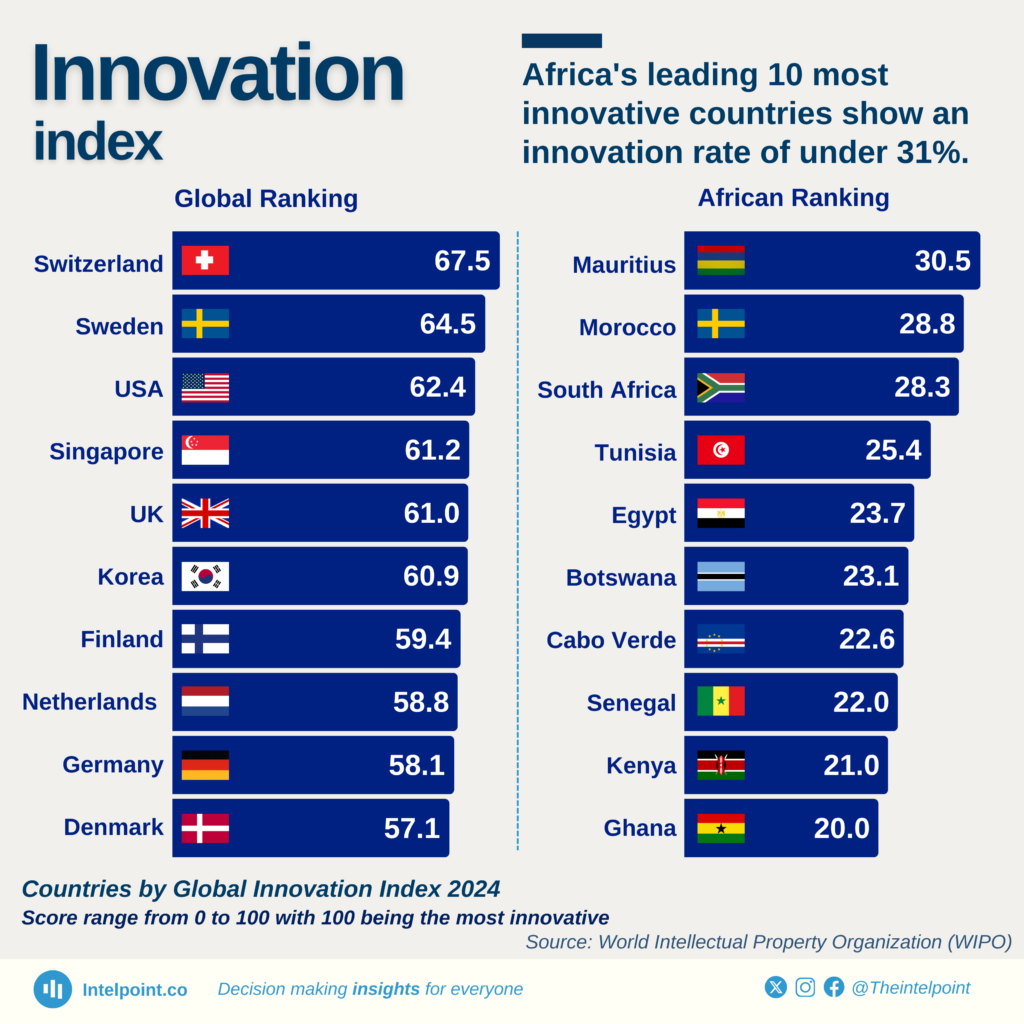
The Global Innovation Index 2024 reveals a striking contrast in innovation performance between countries globally and across Africa. Switzerland leads the global rankings with an impressive score of 67.5, followed by Sweden (64.5) and the USA (62.4), highlighting their sustained investments in research, development, and technological advancement.
In Africa, Mauritius takes the top spot with a score of 30.5, followed closely by Morocco (28.8) and South Africa (28.3). However, even Africa's most innovative nations achieve less than half the score of global leaders, indicating a significant innovation gap.
Nigeria ranks 15th in the African ranking and 113th globally, out of 133 countries, with a score of 17.1.
The 2024 Global Peace Index reveals a decline in peacefulness in 97 countries, the highest since the index began.
Nigeria is among the nations affected by regional conflicts and rising violence. With a peace index score of 2.91, Nigeria is facing increasing challenges.
A deteriorating peace score impacts foreign investment and economic stability. Global economic losses due to violence reached $19.1 trillion in 2023.
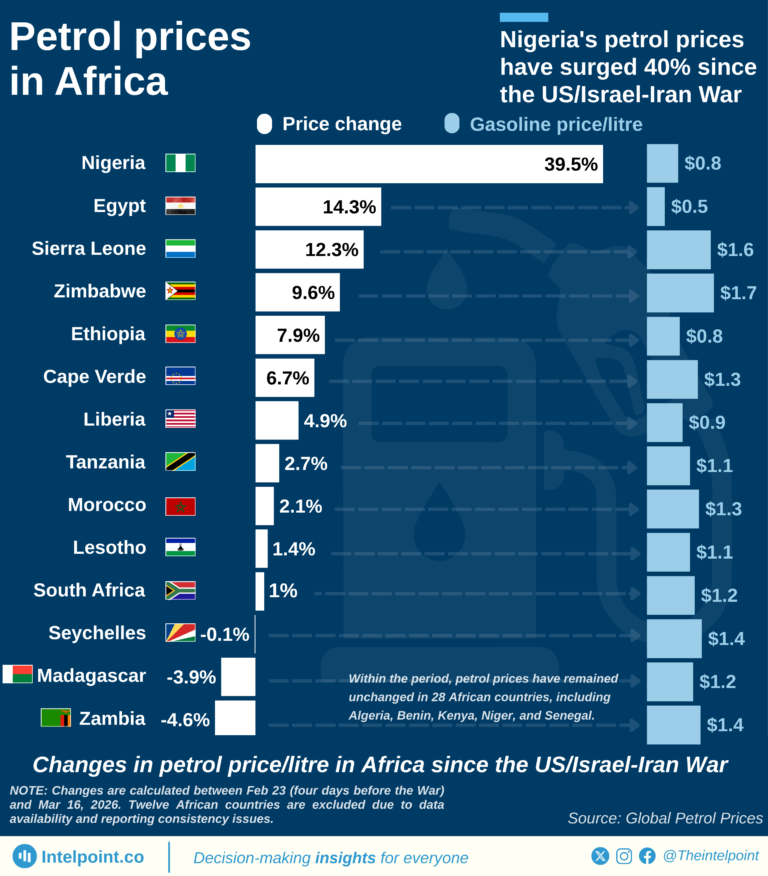
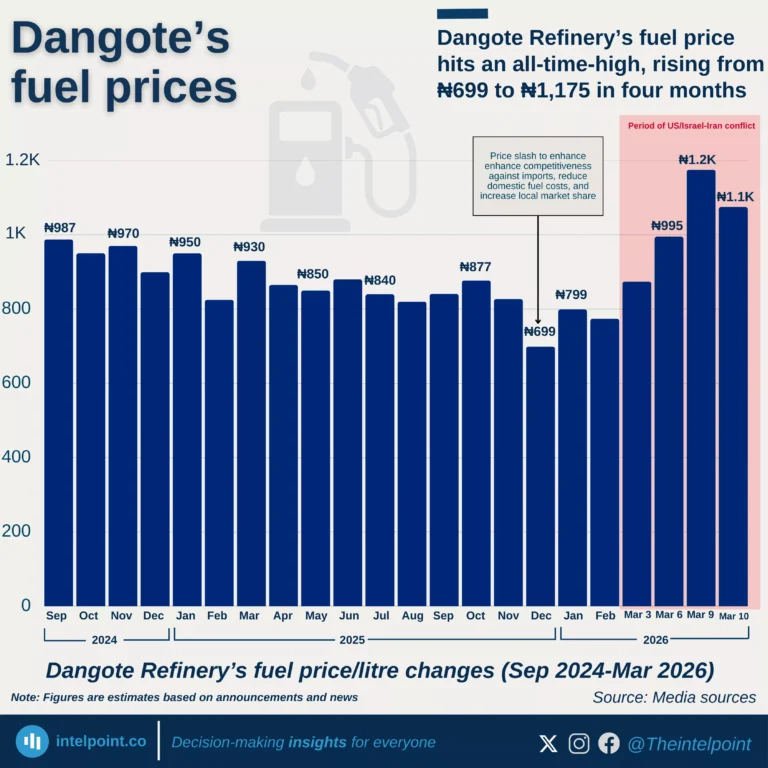
Fuel prices from Dangote Refinery reached an all-time high of ₦1,175 per litre in March 2026.
The lowest recorded price in the period was ₦699 per litre in December 2025, showing a wide price swing.
The jump from ₦699 to ₦1,175 happened in roughly four months.