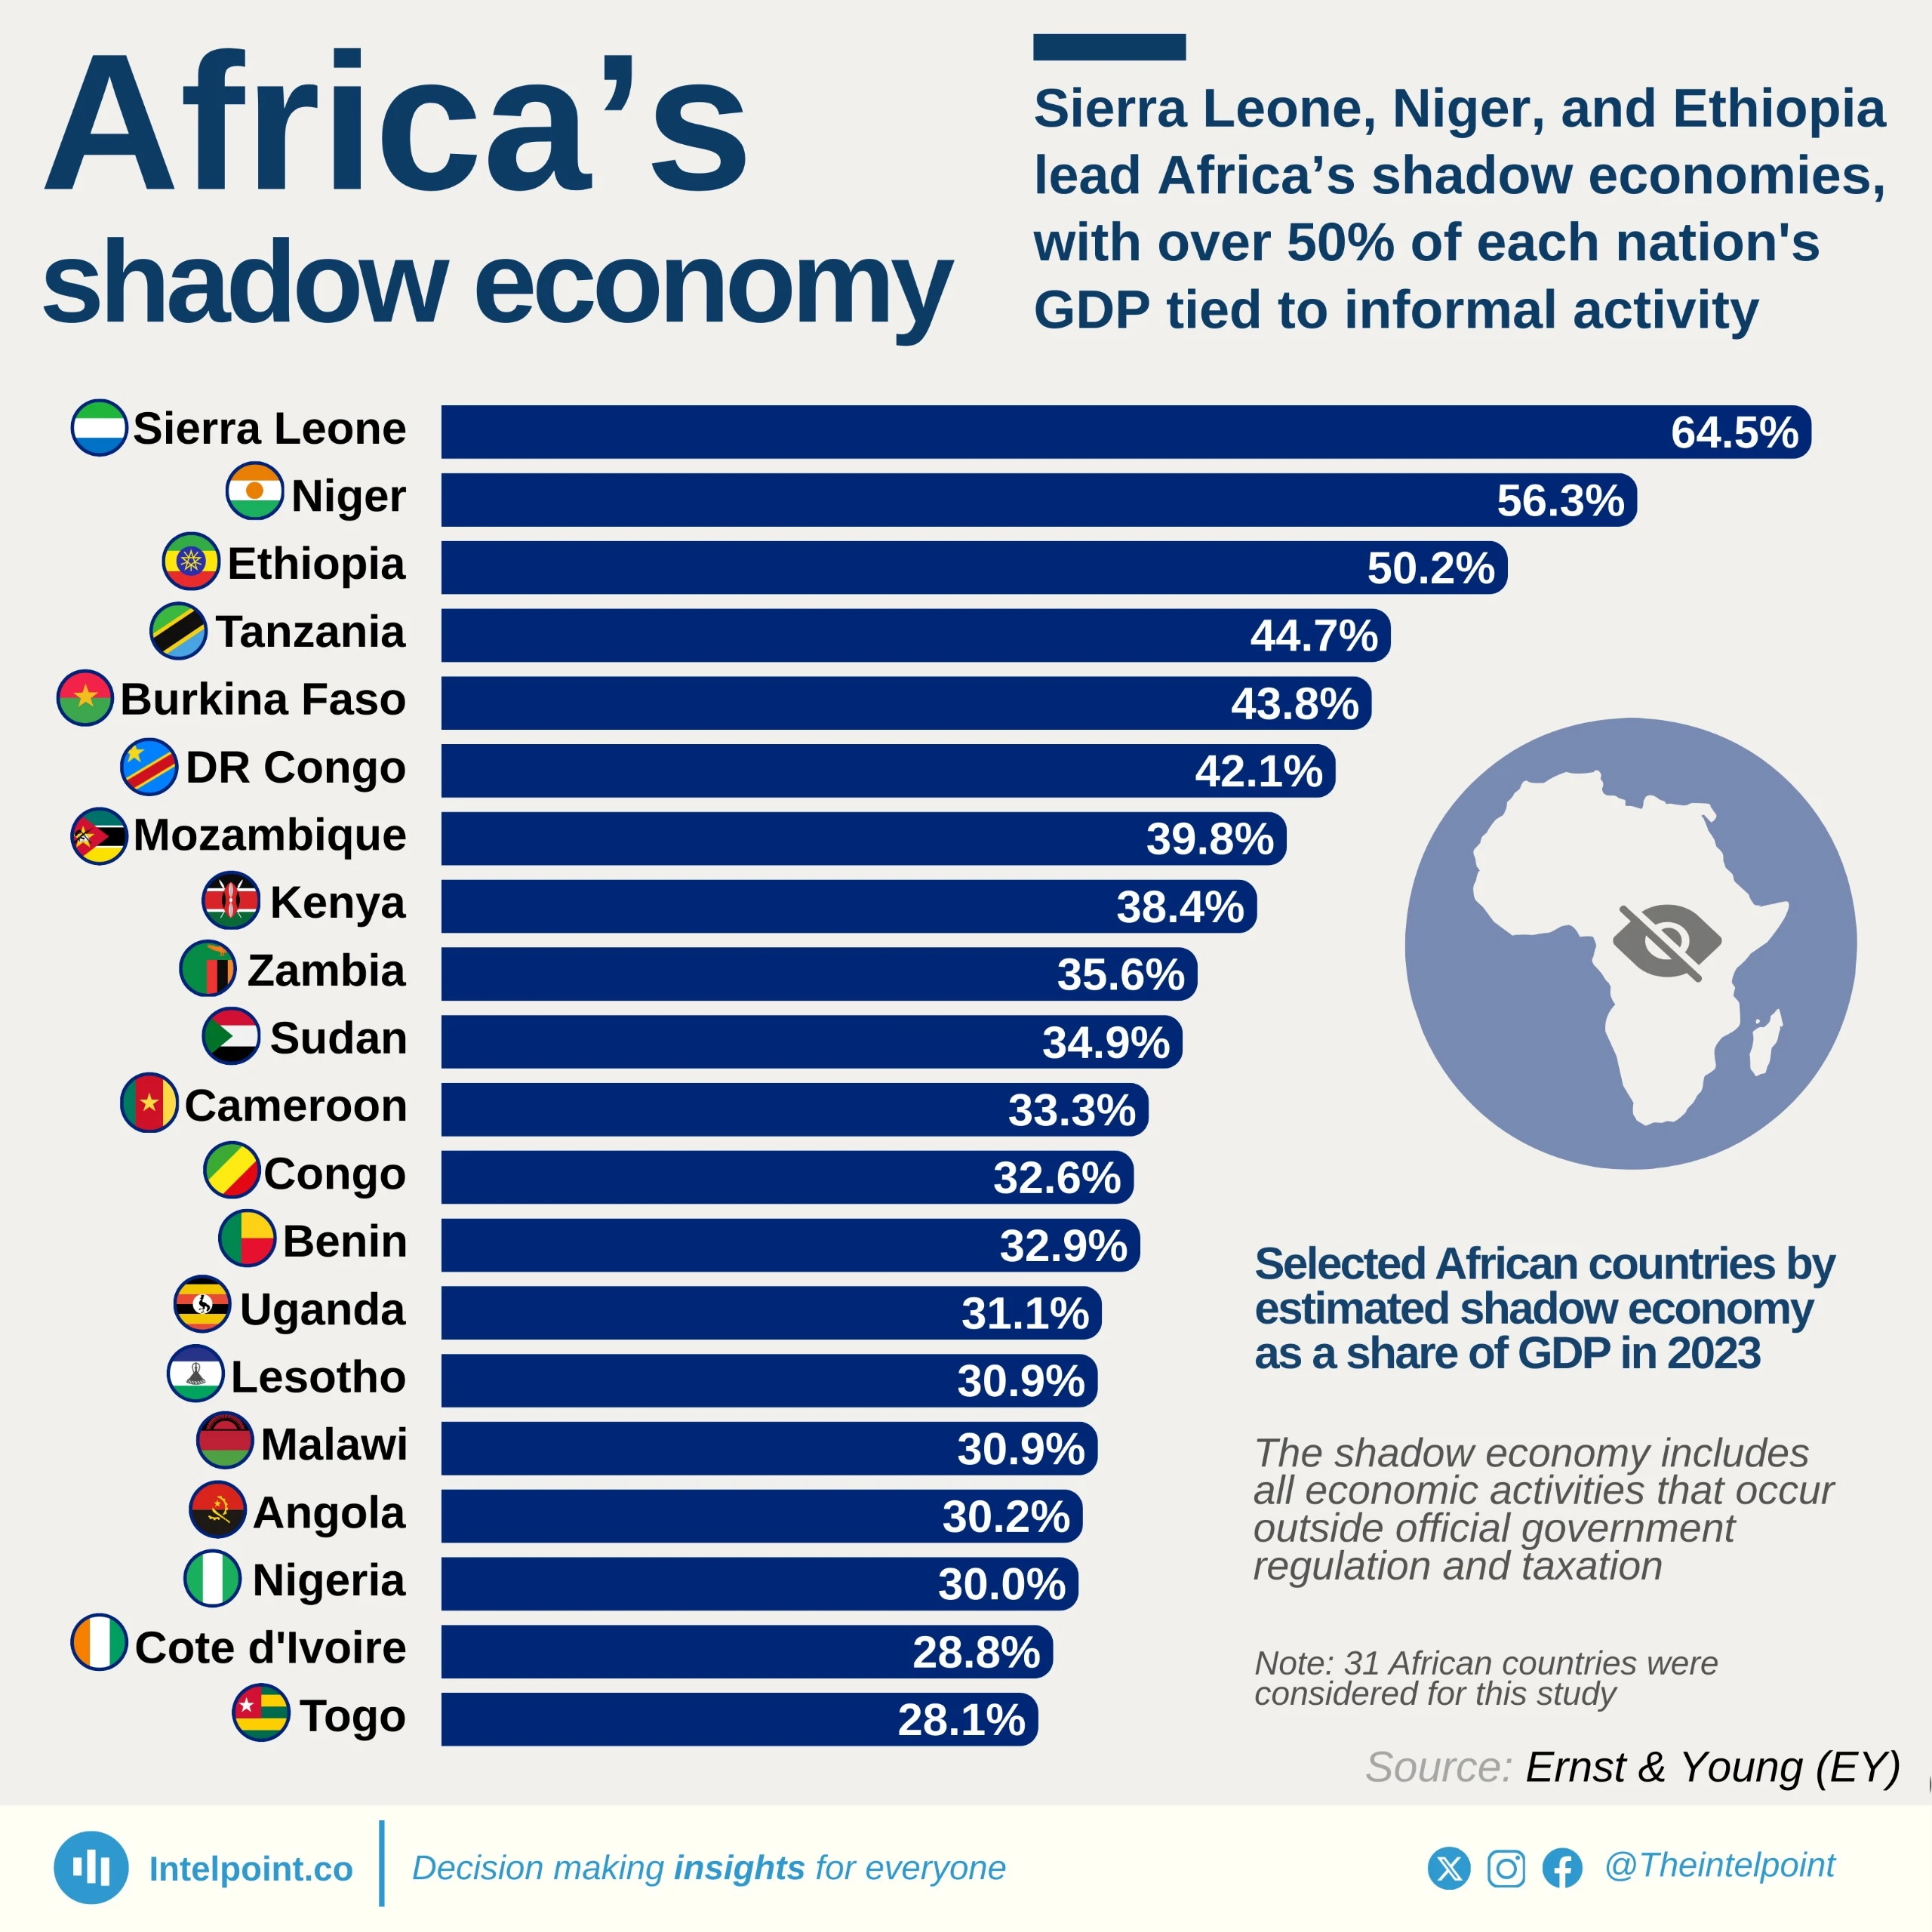
Sierra Leone, Niger, and Ethiopia lead Africa’s shadow economies, with over 50% of each nation's GDP tied to informal activity

Key Takeaways

  • Estimates place Sierra Leone at the top, with about 64.5% of its GDP tied to the shadow economy.
  • Niger (56.3%) and Ethiopia (50.2%) are the only other nations where over half of economic activity is informal.
  • Even larger economies like Nigeria (30.0%) are estimated to have nearly a third of their GDP in unrecorded transactions.
  • Across the listed countries, estimates range from 28.1% to 64.5%, revealing deep but varied informality in African economies.

The shadow economy, also called the informal or underground economy, encompasses legal economic activities that remain unregistered, untaxed, and outside official statistics. These include informal trade, unlicensed businesses, and cash-based services, and in many African countries, they form a critical part of livelihoods.

According to estimates from Ernst & Young, Sierra Leone has the largest shadow economy in Africa, at 64.5% of GDP, followed by Niger (56.3%) and Ethiopia (50.2%), where more than half of all economic activity is informal. The report notes that these high percentages are driven by various factors, including the effectiveness of government institutions, the legal framework, and the tax burden.

Even Nigeria, Africa’s fourth largest economy, is estimated to have 30.0% of its GDP occurring off the books. At the lower end of the provided list, Togo (28.1%) still shows significant informality. While such economies can foster resilience and entrepreneurship in regions with limited formal employment, they also represent lost tax revenue, weaker regulation, and economic blind spots. The report's findings highlight a strong link between lower-income economies and larger shadow economies.
Source:

Ernst & Young (EY)

Period:

2023
HTML code to embed chart
Want a bespoke report?
Reach out
Tags
Related Insights

Kenya and Nigeria accounted for nearly half ($2.45bn) of Africa’s top 10 outward FDI in 2025
  • Kenya led Africa’s outward FDI in 2025, recording $1.26bn.
  • Nigeria followed closely with $1.19bn, after a 191% increase.
  • Together, Kenya and Nigeria accounted for $2.45bn of the top 10 total.
  • Morocco and Egypt completed the top four, with $812.8m and $695.9m.
  • Angola recorded the fastest growth among the top 10, rising 278%.
  • Africa’s total outflow was lower because negative outflows offset gains elsewhere.

Nigeria’s FDI inflow crossed $4bn for the first time since 2014
  • Nigeria’s FDI inflows rose to $4.01 billion in 2025, the highest level since 2014.
  • The 2025 figure represents a 148% increase from the revised $1.61 billion recorded in 2024.
  • Despite the rebound, Nigeria remains far below its 2011 peak of $8.91 billion.
  • Nigeria’s strongest FDI period was 2005 to 2014, when inflows stayed above $4 billion every year.

Nigeria’s FDI inflows rose to 4th in Africa after a 148% increase, while Egypt remained the continent’s top destination
Egypt remained Africa’s top FDI destination with $15.45bn. Nigeria ranked 4th after FDI inflows rose 148% to $4.01bn. Guinea had the biggest top-10 jump, rising 454% to $7.76bn. Africa’s top 10 accounted for 73% of total FDI inflows.

Nigeria’s external debt service crossed $5bn in 2025 after payments in 2018–2025 dwarfed the previous decade
  • Nigeria’s external debt service entered a heavier phase in 2018.
  • External debt service crossed $5bn in 2025.
  • Nigeria paid about $22.2bn from 2018 to 2025.
  • That was about 6x the $3.7bn paid from 2008 to 2017.
  • The 2006 spike reflects one-off debt settlement payments.

Nigeria collected ₦34.6 trillion in company income tax over 11 years
  • Nigeria collected ₦34.62 trillion in company income tax across 45 quarters from Q1 2015 to Q1 2026.
  • Average quarterly collection stood at about ₦769 billion over the period.
  • CIT collections stayed below ₦1 trillion in every quarter until Q2 2023.
  • Since Q2 2024, collections have remained above ₦1 trillion for eight straight quarters.
  • The highest quarterly collection was ₦2.96 trillion in Q3 2025.
  • Annual CIT collections rose sharply from ₦2.82 trillion in 2022 to ₦9.21 trillion in 2025.
  • The recent surge is nominal and likely reflects stronger collections, inflation, naira depreciation, and higher naira-value foreign CIT receipts.

Nigeria’s food inflation has risen every month since January 2026, climbing 8.07 percentage points to 16.96% in May
  • Nigeria’s year-on-year food inflation rose for the fourth consecutive month, from 8.89% in January 2026 to 16.96% in May.
  • The rate increased by 8.07 percentage points within the first five months of 2026.
  • May’s 16.96% rate means food prices were, on average, 16.96% higher than they were in May 2025.
  • Food inflation rose from 12.12% in February to 14.31% in March and 16.06% in April before reaching 16.96% in May.
  • Food inflation exceeded Nigeria’s 15.93% headline inflation rate in May, showing that food was a major source of renewed pressure on household expenses.

POPULAR TOPICS
SIGN UP TO OUR NEWSLETTER
Get periodic updates about the African startup space, access to our reports, among others.
Subscribe Here
Subscription Form

A product of Techpoint Africa. All rights reserved