The top 3 countries accounted for nearly half of the US' agricultural exports in 2024, valued at $83.35 billion

Key takeaways:

  • Mexico ranked as the leading destination for the US' agricultural exports in 2024, with a total value of $30.32 billion (17.2% of total agricultural exports).
  • North American neighbours, Mexico and Canada, collectively accounted for 33.3% of total US agricultural exports.
  • China was the third-largest market, importing $24.65 billion (14%) of the US' agricultural products.
  • Asian markets, including China, Japan, South Korea, Taiwan, the Philippines, and Vietnam, collectively absorbed 31.7% of the US' agricultural exports.
  • The top three markets (Mexico, Canada, and China) made up 47.3% of the US' total agricultural export value.
  • The top 10 markets accounted for 74.8% of the US' agricultural exports, totalling $131.85 billion.

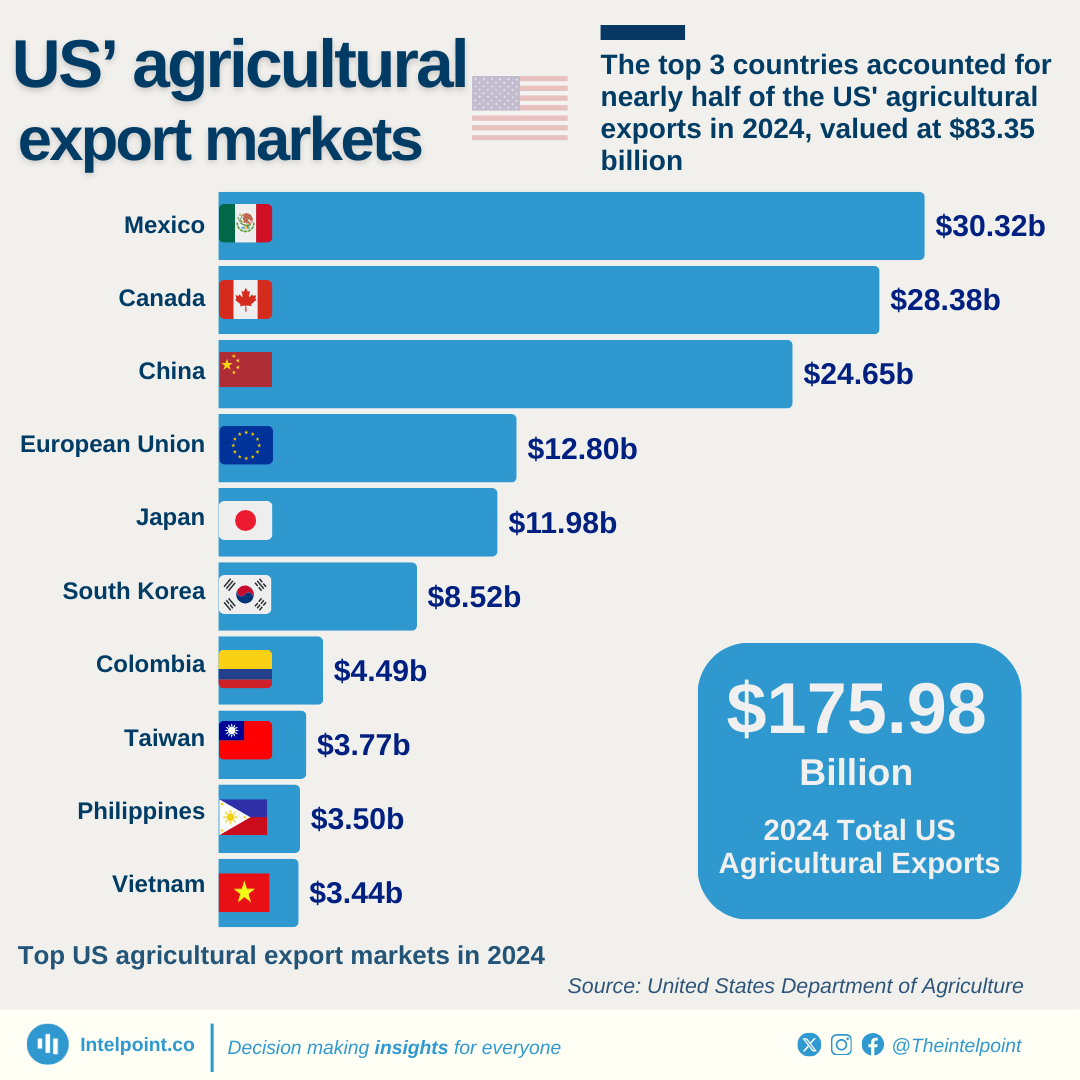
In 2024, the United States exported approximately $176 billion in agricultural goods worldwide. Mexico, Canada, and China emerged as the top markets, collectively accounting for nearly half (47.3%) of total exports. Mexico led the list at $30.32 billion, followed by Canada at $28.38 billion and China at $24.65 billion.

The European Union and Japan completed the top five, importing $12.8 billion (7.3%) and $11.98 billion (6.8%), respectively. Asian markets featured prominently, with six countries among the top 10 destinations collectively receiving nearly one-third of all US agricultural exports.

Source:

United States Department of Agriculture

Period:

2024
HTML code to embed chart
Want a bespoke report?
Reach out
Tags
Related Insights

Morocco leads Africa in digital trade surpluses, with $26 billion 20-year cumulative gain
  • Morocco achieved the highest cumulative surplus in Africa’s digital trade at $26.4 billion between 2005 and 2024.
  • Mauritius and Tunisia followed distantly with surpluses of $8.7 billion and $4.4 billion, respectively.
  • Nigeria and Angola recorded the deepest deficits, each exceeding $90 billion cumulatively.
  • Africa’s overall digital trade balance remained negative, averaging a -$618 million deficit in 2024.
  • Smaller economies like Kenya and Togo managed modest but consistent surpluses over the years.

In 2024, Asia and Europe together accounted for 63% of the world's copper export value
  • Asia leads global copper exports with 31.6% of total export value.
  • Europe follows closely at 31.4%, making the two regions nearly equal in contribution.
  • Combined, Asia and Europe control 63% of the global copper export market.
  • Africa ranks third globally, contributing 15.3% to copper exports.
  • Oceania plays the smallest role, with just 2% of the total export value.

Just 10 countries in Africa control 98% of the continent’s copper export value
  • The DR Congo is Africa’s copper giant, exporting $19.8 billion in 2024 (56.7% of the total).
  • Zambia follows with $7.6 billion, representing 21.7% of exports.
  • Together, the DR Congo and Zambia control almost 80% of Africa’s copper trade.
  • Tanzania is the third-largest exporter with $2.2 billion (6.3%).
  • Despite 52 African countries exporting copper, 42 of them collectively make up only 2% of the total value.

South Africa’s digital service imports still outweighed exports as of 2024, even after 300% growth since 2005
  • South Africa’s digital service imports consistently overshadowed export earnings, despite exports growing by over 300% since 2005.
  • South Africa exported $76.418 billion in digital services between 2005 and 2024.
  • Imports during the same period reached $113.67 billion.
  • The result was a trade deficit of $37.252 billion in over 20 years.
  • Exports rose from just $1.71 billion in 2005 to $7.05 billion in 2024.

Ghana recorded $53.00B in digital services imports against $49.1B in exports in 20 years
  • Ghana exported $49.11 billion in digital services between 2005 and 2024.
  • Digital services imports recorded during the same period was $53.00 billion.
  • Ghana recorded a $3.9 billion trade deficit across the two decades.
  • Exports grew from just $78 million in 2005 to $5.18 billion in 2024.

Since 2005, Egypt’s digital service imports have consistently exceeded exports, creating a $56b deficit
  • Egypt spends twice as much on digital services imports than it earns from exports, with $8.31b on imports and $4.03b from exports recorded in 2024.
  • Egypt exported $46.007 billion in digital services between 2005 and 2024.
  • Imports during the same period reached $101.98 billion.
  • The result was a trade deficit of $55.973 billion in over 20 years.
  • Export earnings rose from just $1.91 billion in 2005 to $4.03 billion in 2024.

POPULAR TOPICS
SIGN UP TO OUR NEWSLETTER
Get periodic updates about the African startup space, access to our reports, among others.
Subscribe Here
Subscription Form

A product of Techpoint Africa. All rights reserved