Lagos leads VAT remittance with ₦305B, over 53% of total and more than 3x Rivers'

Key Takeaways

  • Lagos State contributed ₦305B in VAT, making up over 53% of the national total and more than three times that of any other state.
  • Rivers (₦90B) and Oyo (₦27B) followed Lagos as the second and third highest contributors, highlighting a steep drop after the top state.
  • Only a few states, including Bayelsa, Kano, Kwara, and Edo, remitted above ₦5B, showing a highly uneven distribution of VAT contributions.
  • Over 8 states, such as Kebbi, Osun, Imo, and Zamfara, contributed less than ₦2B each, indicating minimal VAT activity in many parts of the country.

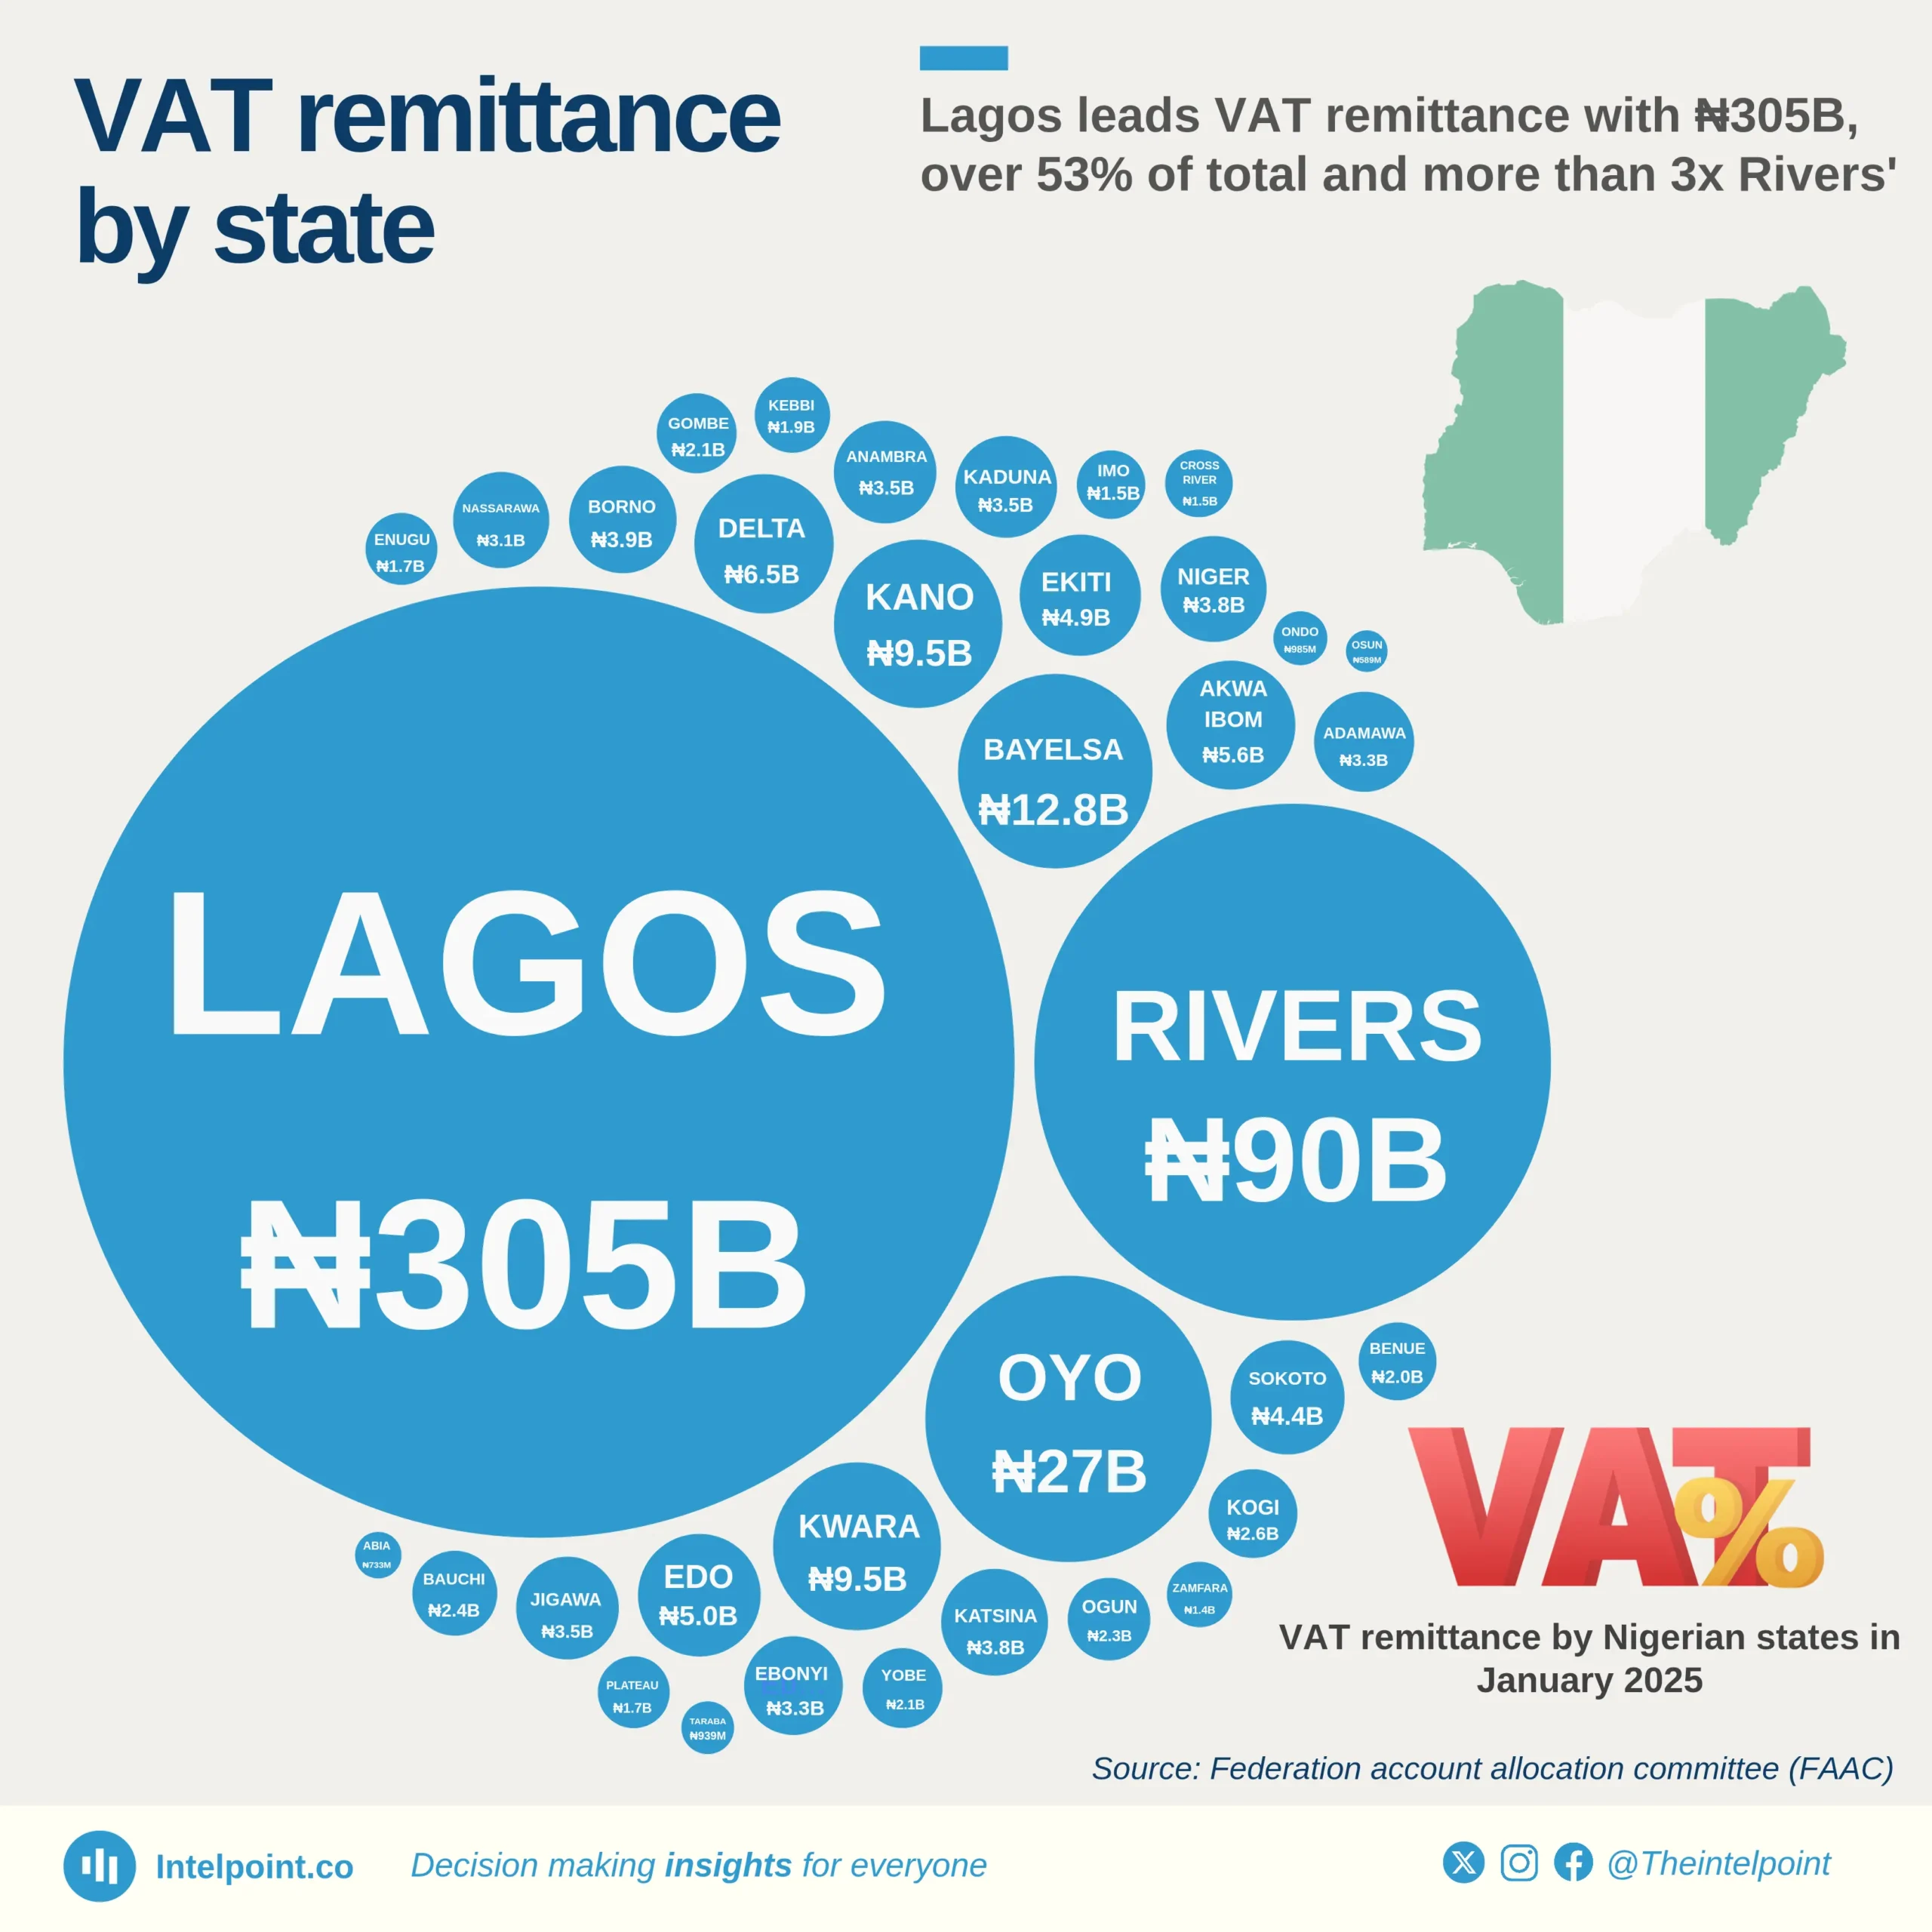
In January 2025, Lagos State remitted a staggering ₦305 billion in VAT, over 53% of the national total and more than three times the ₦90 billion contributed by Rivers, the second‑highest state. Oyo was the third-highest contributor with ₦27 billion. These three states together generated nearly three‑quarters of Nigeria’s entire VAT yield, underscoring their outsized economic weight. Mid‑tier contributors such as Bayelsa (₦12.8 billion), Kano and Kwara (₦9.5 billion each), and Edo (₦5 billion) remitted less than half of Oyo’s contribution, revealing a steep drop‑off.

At the bottom tier, more than eight states each contributed under ₦2 billion, including Kebbi (₦1.9 billion), Ondo (₦0.9 billion), Imo (₦1.5 billion), Taraba (₦0.9 billion), and Zamfara (₦1.4 billion). Together, they accounted for only a few percent of the total, highlighting profound regional disparities in VAT collection.

Source:

Federal account allocation committee (FAAC)

Period:

January 2025
HTML code to embed chart
Want a bespoke report?
Reach out
Tags
Related Insights

Trade and agriculture led Nigeria’s ₦51.20 trillion economy in Q2 2025, as oil’s share remained modest
  • Trade contributed 18.28%, making it the largest sector in Q2 2025's GDP.
  • Crop production followed with 17.8%, underscoring agriculture’s central role.
  • Oil and gas added just 4.05%, highlighting its shrinking share compared to non-oil sectors.
  • Real estate and telecoms reinforced the growing strength of services in the Nigerian economy.

After years of volatility, Nigeria’s crude oil production has increased in four consecutive quarters, rising to 1.68 mbpd in Q2 2025
  • Production dipped sharply in 2022, with the steepest quarterly decline of –16.08% in Q3, before recovering at year-end.
  • 2023 marked a rebound year, highlighted by strong quarterly growth of 18.85% in Q3, lifting production back above 1.5 mbpd.
  • 2024 showed relative stability, with modest fluctuations; production only briefly fell below 1.5 mbpd before gradually recovering.
  • By Q2 2025, output hit 1.68 mbpd, the highest in the series, supported by consistent growth in three straight quarters.

Nigerian nationals received 880 H-1B visas in FY 2024, with the highest number of approvals recorded in December 2023
  • Nigeria received a total of 880 H-1B visas in FY 2024, averaging about 73 per month.
  • December 2023 was the peak month, with 118 issuances, while June 2024 recorded the lowest at just 46.
  • Issuances fluctuated throughout the year, reflecting no clear upward trend but significant month-to-month volatility.
  • Despite peaks and dips, overall activity remained steady, with most months ranging between 60–90 approvals.

Nigeria’s H-1B visa approvals hit a record 880 in 2024 following the decline during the COVID-19 pandemic
  • 2024 recorded the highest number of H1-B issuances to Nigerians at 880, nearly double 2022’s level.
  • Issuances dropped sharply to 231 in 2020 and 197 in 2021, marking the lowest levels in nearly two decades.
  • Between 2006 (483) and 2017 (354), there was a gradual decline in approvals before a steeper fall in 2020.
  • From 2021 to 2024, issuances surged by more than 340%, suggesting strong demand for U.S. tech and professional opportunities among Nigerians.

Manufactured goods drove imports as oil products pushed total to ₦15.29 trillion in Q2 2025
  • ₦7.88 trillion worth of manufactured goods made up 51.6% of imports, underscoring Nigeria’s dependence on foreign industrial products.
  • Other petroleum oil products accounted for ₦2.79 trillion (18.2%) of imports, showing continued reliance on external energy supplies despite Nigeria’s oil-rich status.
  • ₦1.72 trillion in raw material imports (11.3%) highlights the gap in local processing capacity.
  • Solid minerals (₦70.9 bn, 0.46%) and energy goods (₦150 mn, almost 0%) show almost no role in imports.

Nigeria’s foreign trade hit ₦38 trillion in Q2 2025, driven by strong export growth
  • Total trade in Q2 2025 was valued at ₦38.04tn.
  • Imports accounted for ₦15.29tn, led by manufactured goods and petroleum products.
  • Exports reached ₦22.75tn, boosted mainly by crude oil.
  • The trade gap favoured Nigeria with a surplus of ₦7.46tn.

POPULAR TOPICS
SIGN UP TO OUR NEWSLETTER
Get periodic updates about the African startup space, access to our reports, among others.
Subscribe Here
Subscription Form

A product of Techpoint Africa. All rights reserved