Lagos generated ₦819.6 billion in VAT in Q1 2025, nearly triple Rivers and more than 10 times any other state

Key takeaways

  • Lagos led the nation with ₦819.62B VAT, over 45% of the total generated by all 36 states combined.
  • Rivers followed distantly with ₦278.23B, around 34% of Lagos’s VAT haul.
  • Only five states (Lagos, Rivers, Oyo, Bayelsa, Kano) generated over ₦21B in Q1 2025.
  • 22 states generated below ₦10B, with 13 of them earning less than ₦6B in VAT.
  • Northern states like Katsina (₦5.96B), Yobe (₦5.81B), and Kebbi (₦5.13B) trail significantly in VAT contributions.
  • Abia, Cross River, Imo, and Taraba sit at the bottom, each with under ₦3B in VAT returns.

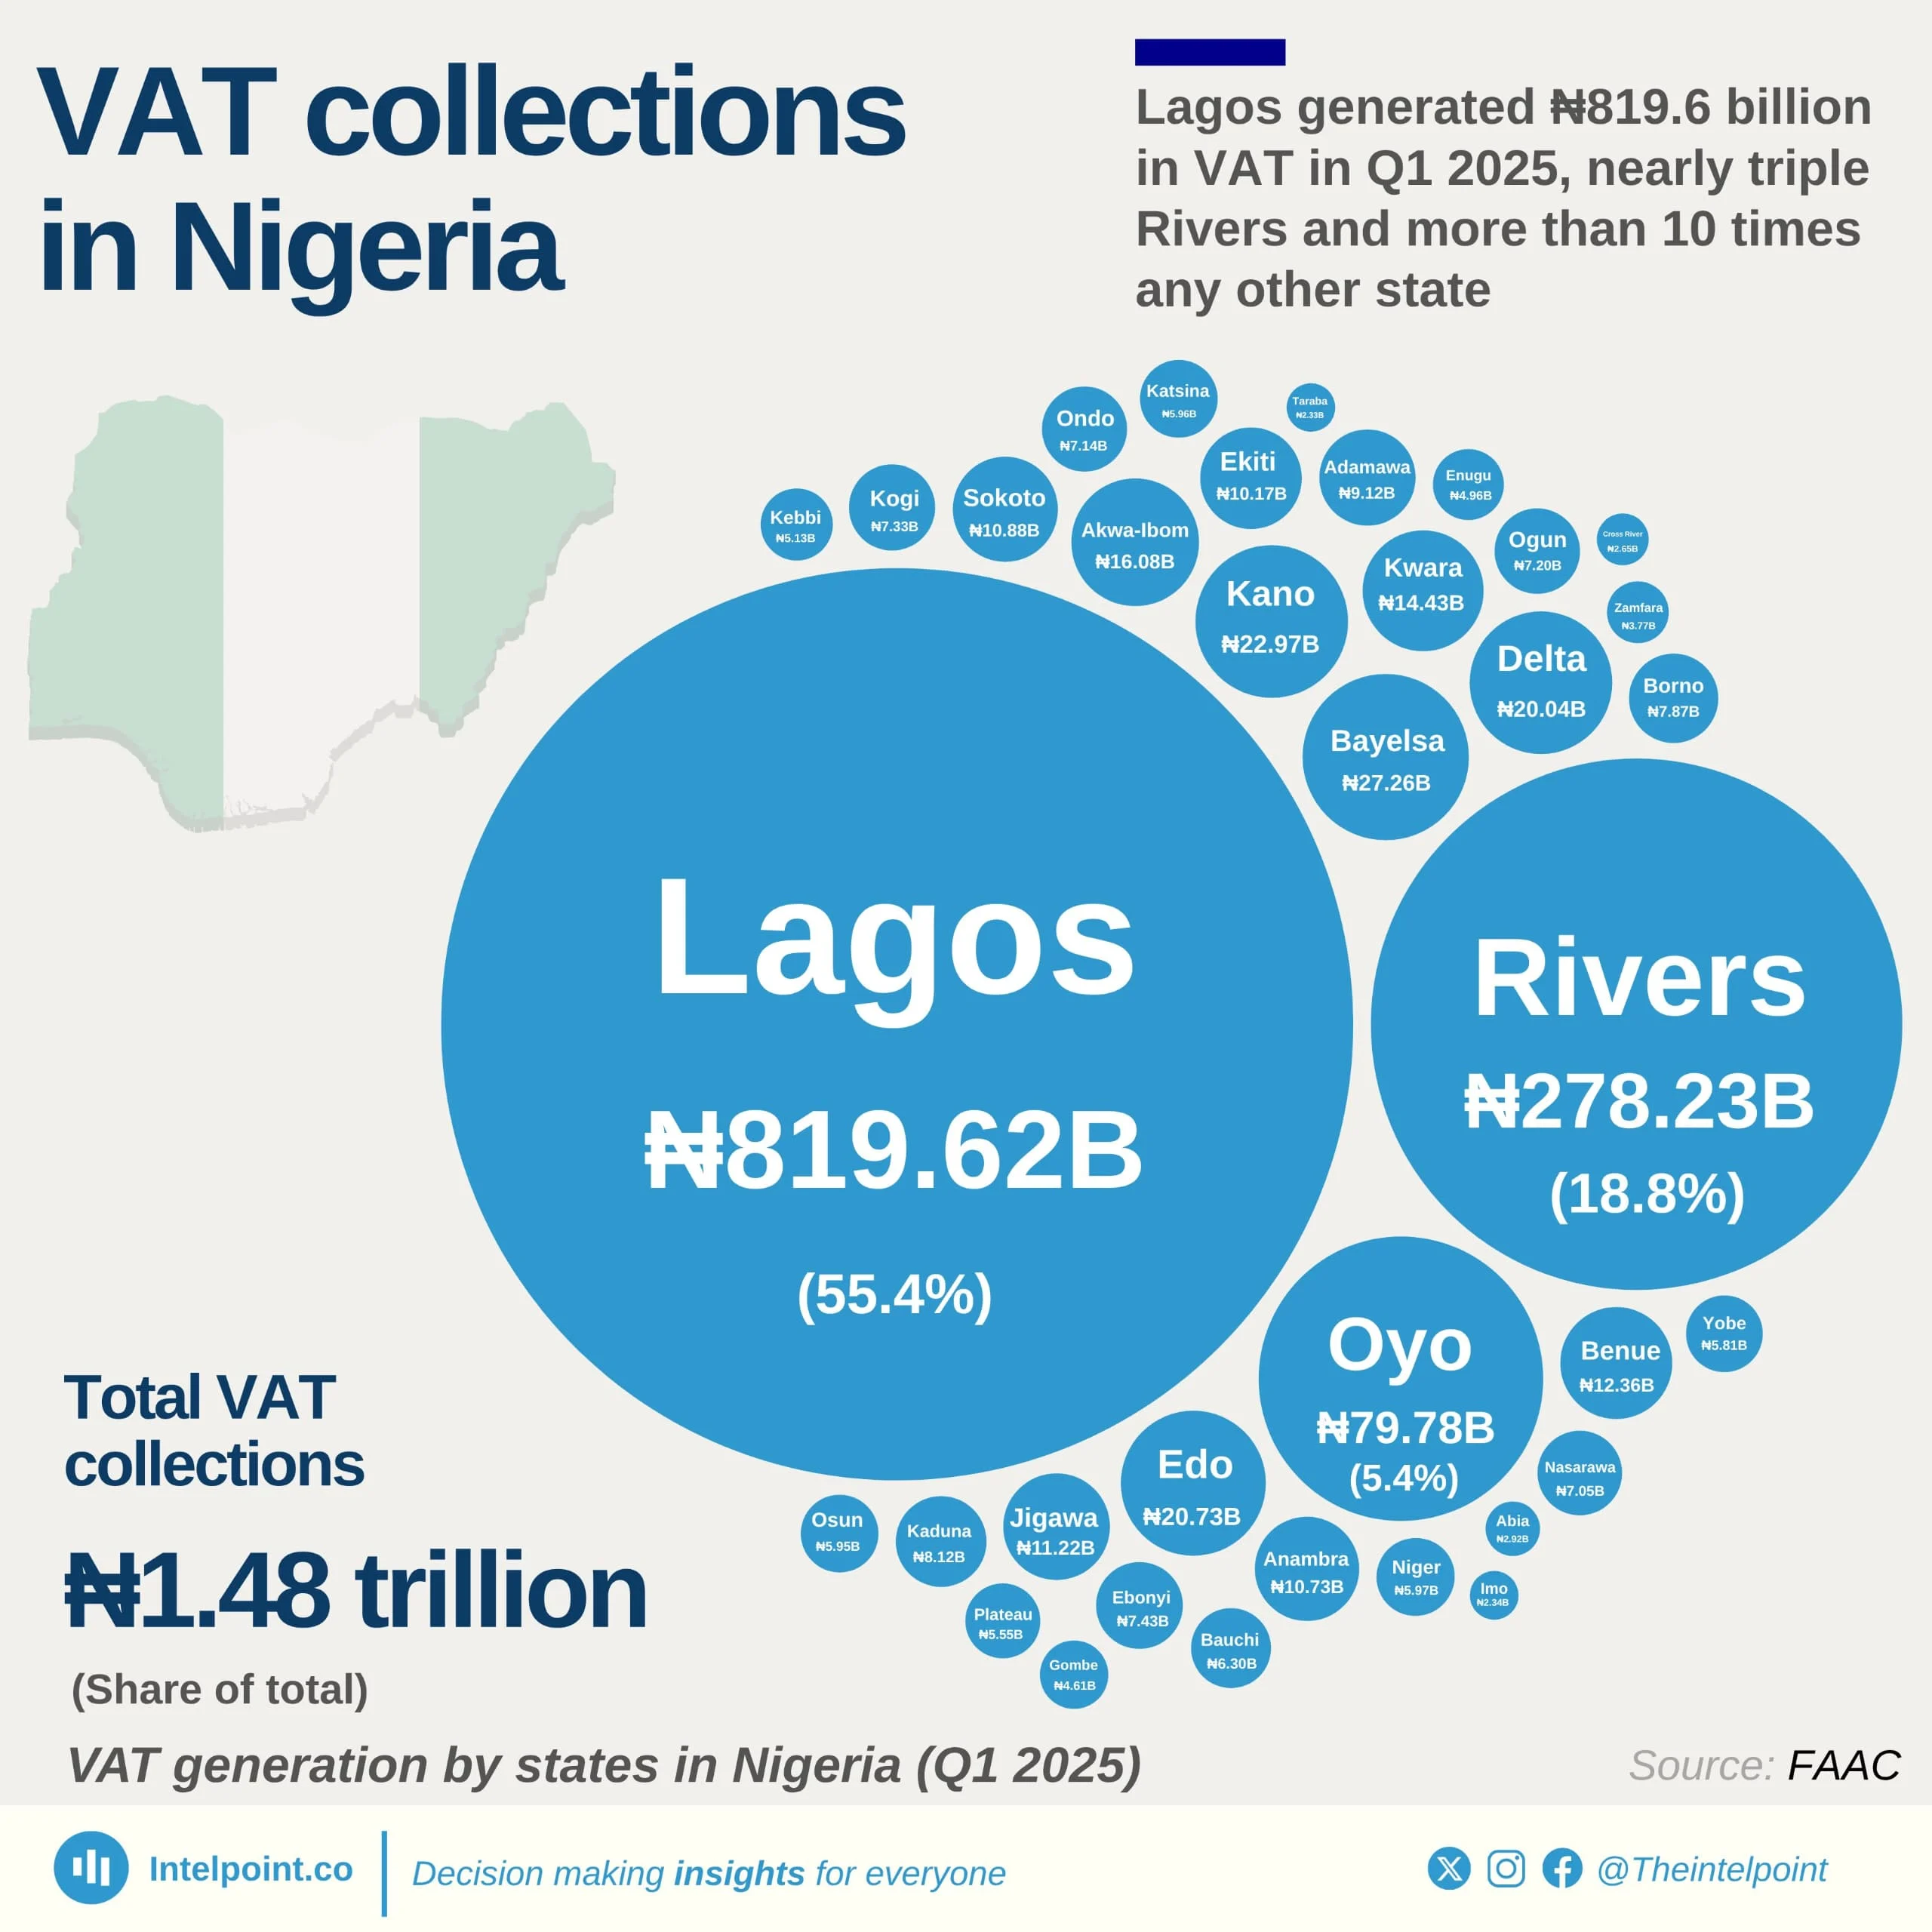
In Q1 2025, Lagos State reinforced its reputation as Nigeria’s VAT powerhouse, contributing ₦819.62 billion in Value Added Tax. This figure alone accounts for a substantial portion of the country’s total state-level VAT, surpassing the next state, Rivers, by a margin of over ₦540 billion. Rivers recorded ₦278.23 billion, while Oyo ranked a distant third with ₦79.78 billion. Together, the top three states contributed more than ₦1.17 trillion, underscoring the strong economic activity concentrated in Nigeria’s urban and commercial hubs.

Below the top performers, VAT contributions declined sharply. Bayelsa (₦27.26B), Kano (₦22.97B), and Edo (₦20.73B) are among the few to exceed ₦20 billion. In contrast, 22 states generated less than ₦10B in VAT, with the lowest figures coming from Abia (₦2.92B), Cross River (₦2.65B), Imo (₦2.34B), and Taraba (₦2.33B). These disparities highlight deep regional imbalances in economic activity, tax compliance, and business footprints across Nigeria.

Notably, 6 of the bottom 10 states in VAT collection are from Northern Nigeria, suggesting that commercial activities remain heavily tilted toward the South. As Lagos continues to dominate VAT collections year after year, the need for broader economic diversification and regional development becomes even more urgent.

Source:

Federation Account Allocation Committee (FAAC)

Period:

Q1 2025
HTML code to embed chart
Want a bespoke report?
Reach out
Tags
Related Insights

Trade and agriculture led Nigeria’s ₦51.20 trillion economy in Q2 2025, as oil’s share remained modest
  • Trade contributed 18.28%, making it the largest sector in Q2 2025's GDP.
  • Crop production followed with 17.8%, underscoring agriculture’s central role.
  • Oil and gas added just 4.05%, highlighting its shrinking share compared to non-oil sectors.
  • Real estate and telecoms reinforced the growing strength of services in the Nigerian economy.

After years of volatility, Nigeria’s crude oil production has increased in four consecutive quarters, rising to 1.68 mbpd in Q2 2025
  • Production dipped sharply in 2022, with the steepest quarterly decline of –16.08% in Q3, before recovering at year-end.
  • 2023 marked a rebound year, highlighted by strong quarterly growth of 18.85% in Q3, lifting production back above 1.5 mbpd.
  • 2024 showed relative stability, with modest fluctuations; production only briefly fell below 1.5 mbpd before gradually recovering.
  • By Q2 2025, output hit 1.68 mbpd, the highest in the series, supported by consistent growth in three straight quarters.

Nigerian nationals received 880 H-1B visas in FY 2024, with the highest number of approvals recorded in December 2023
  • Nigeria received a total of 880 H-1B visas in FY 2024, averaging about 73 per month.
  • December 2023 was the peak month, with 118 issuances, while June 2024 recorded the lowest at just 46.
  • Issuances fluctuated throughout the year, reflecting no clear upward trend but significant month-to-month volatility.
  • Despite peaks and dips, overall activity remained steady, with most months ranging between 60–90 approvals.

Nigeria’s H-1B visa approvals hit a record 880 in 2024 following the decline during the COVID-19 pandemic
  • 2024 recorded the highest number of H1-B issuances to Nigerians at 880, nearly double 2022’s level.
  • Issuances dropped sharply to 231 in 2020 and 197 in 2021, marking the lowest levels in nearly two decades.
  • Between 2006 (483) and 2017 (354), there was a gradual decline in approvals before a steeper fall in 2020.
  • From 2021 to 2024, issuances surged by more than 340%, suggesting strong demand for U.S. tech and professional opportunities among Nigerians.

Manufactured goods drove imports as oil products pushed total to ₦15.29 trillion in Q2 2025
  • ₦7.88 trillion worth of manufactured goods made up 51.6% of imports, underscoring Nigeria’s dependence on foreign industrial products.
  • Other petroleum oil products accounted for ₦2.79 trillion (18.2%) of imports, showing continued reliance on external energy supplies despite Nigeria’s oil-rich status.
  • ₦1.72 trillion in raw material imports (11.3%) highlights the gap in local processing capacity.
  • Solid minerals (₦70.9 bn, 0.46%) and energy goods (₦150 mn, almost 0%) show almost no role in imports.

Nigeria’s foreign trade hit ₦38 trillion in Q2 2025, driven by strong export growth
  • Total trade in Q2 2025 was valued at ₦38.04tn.
  • Imports accounted for ₦15.29tn, led by manufactured goods and petroleum products.
  • Exports reached ₦22.75tn, boosted mainly by crude oil.
  • The trade gap favoured Nigeria with a surplus of ₦7.46tn.

POPULAR TOPICS
SIGN UP TO OUR NEWSLETTER
Get periodic updates about the African startup space, access to our reports, among others.
Subscribe Here
Subscription Form

A product of Techpoint Africa. All rights reserved