The manufacturing sector leads Nigerian MSME revenues with ₦8.27 million monthly, far outpacing service sectors

Key Takeaways

  • Manufacturing records the highest monthly revenue at ₦8.27m, nearly double that of the next sector.
  • Healthcare (₦5.02m) and Transportation (₦3.70m) follow, reflecting essential service demand.
  • Industries like Marketing & Advertising (₦191k), Food & Beverages (₦320k), and Education (₦440k) earn significantly less on average.
  • The difference between top earners (Manufacturing, Healthcare) and bottom sectors highlights a stark inequality in industry.

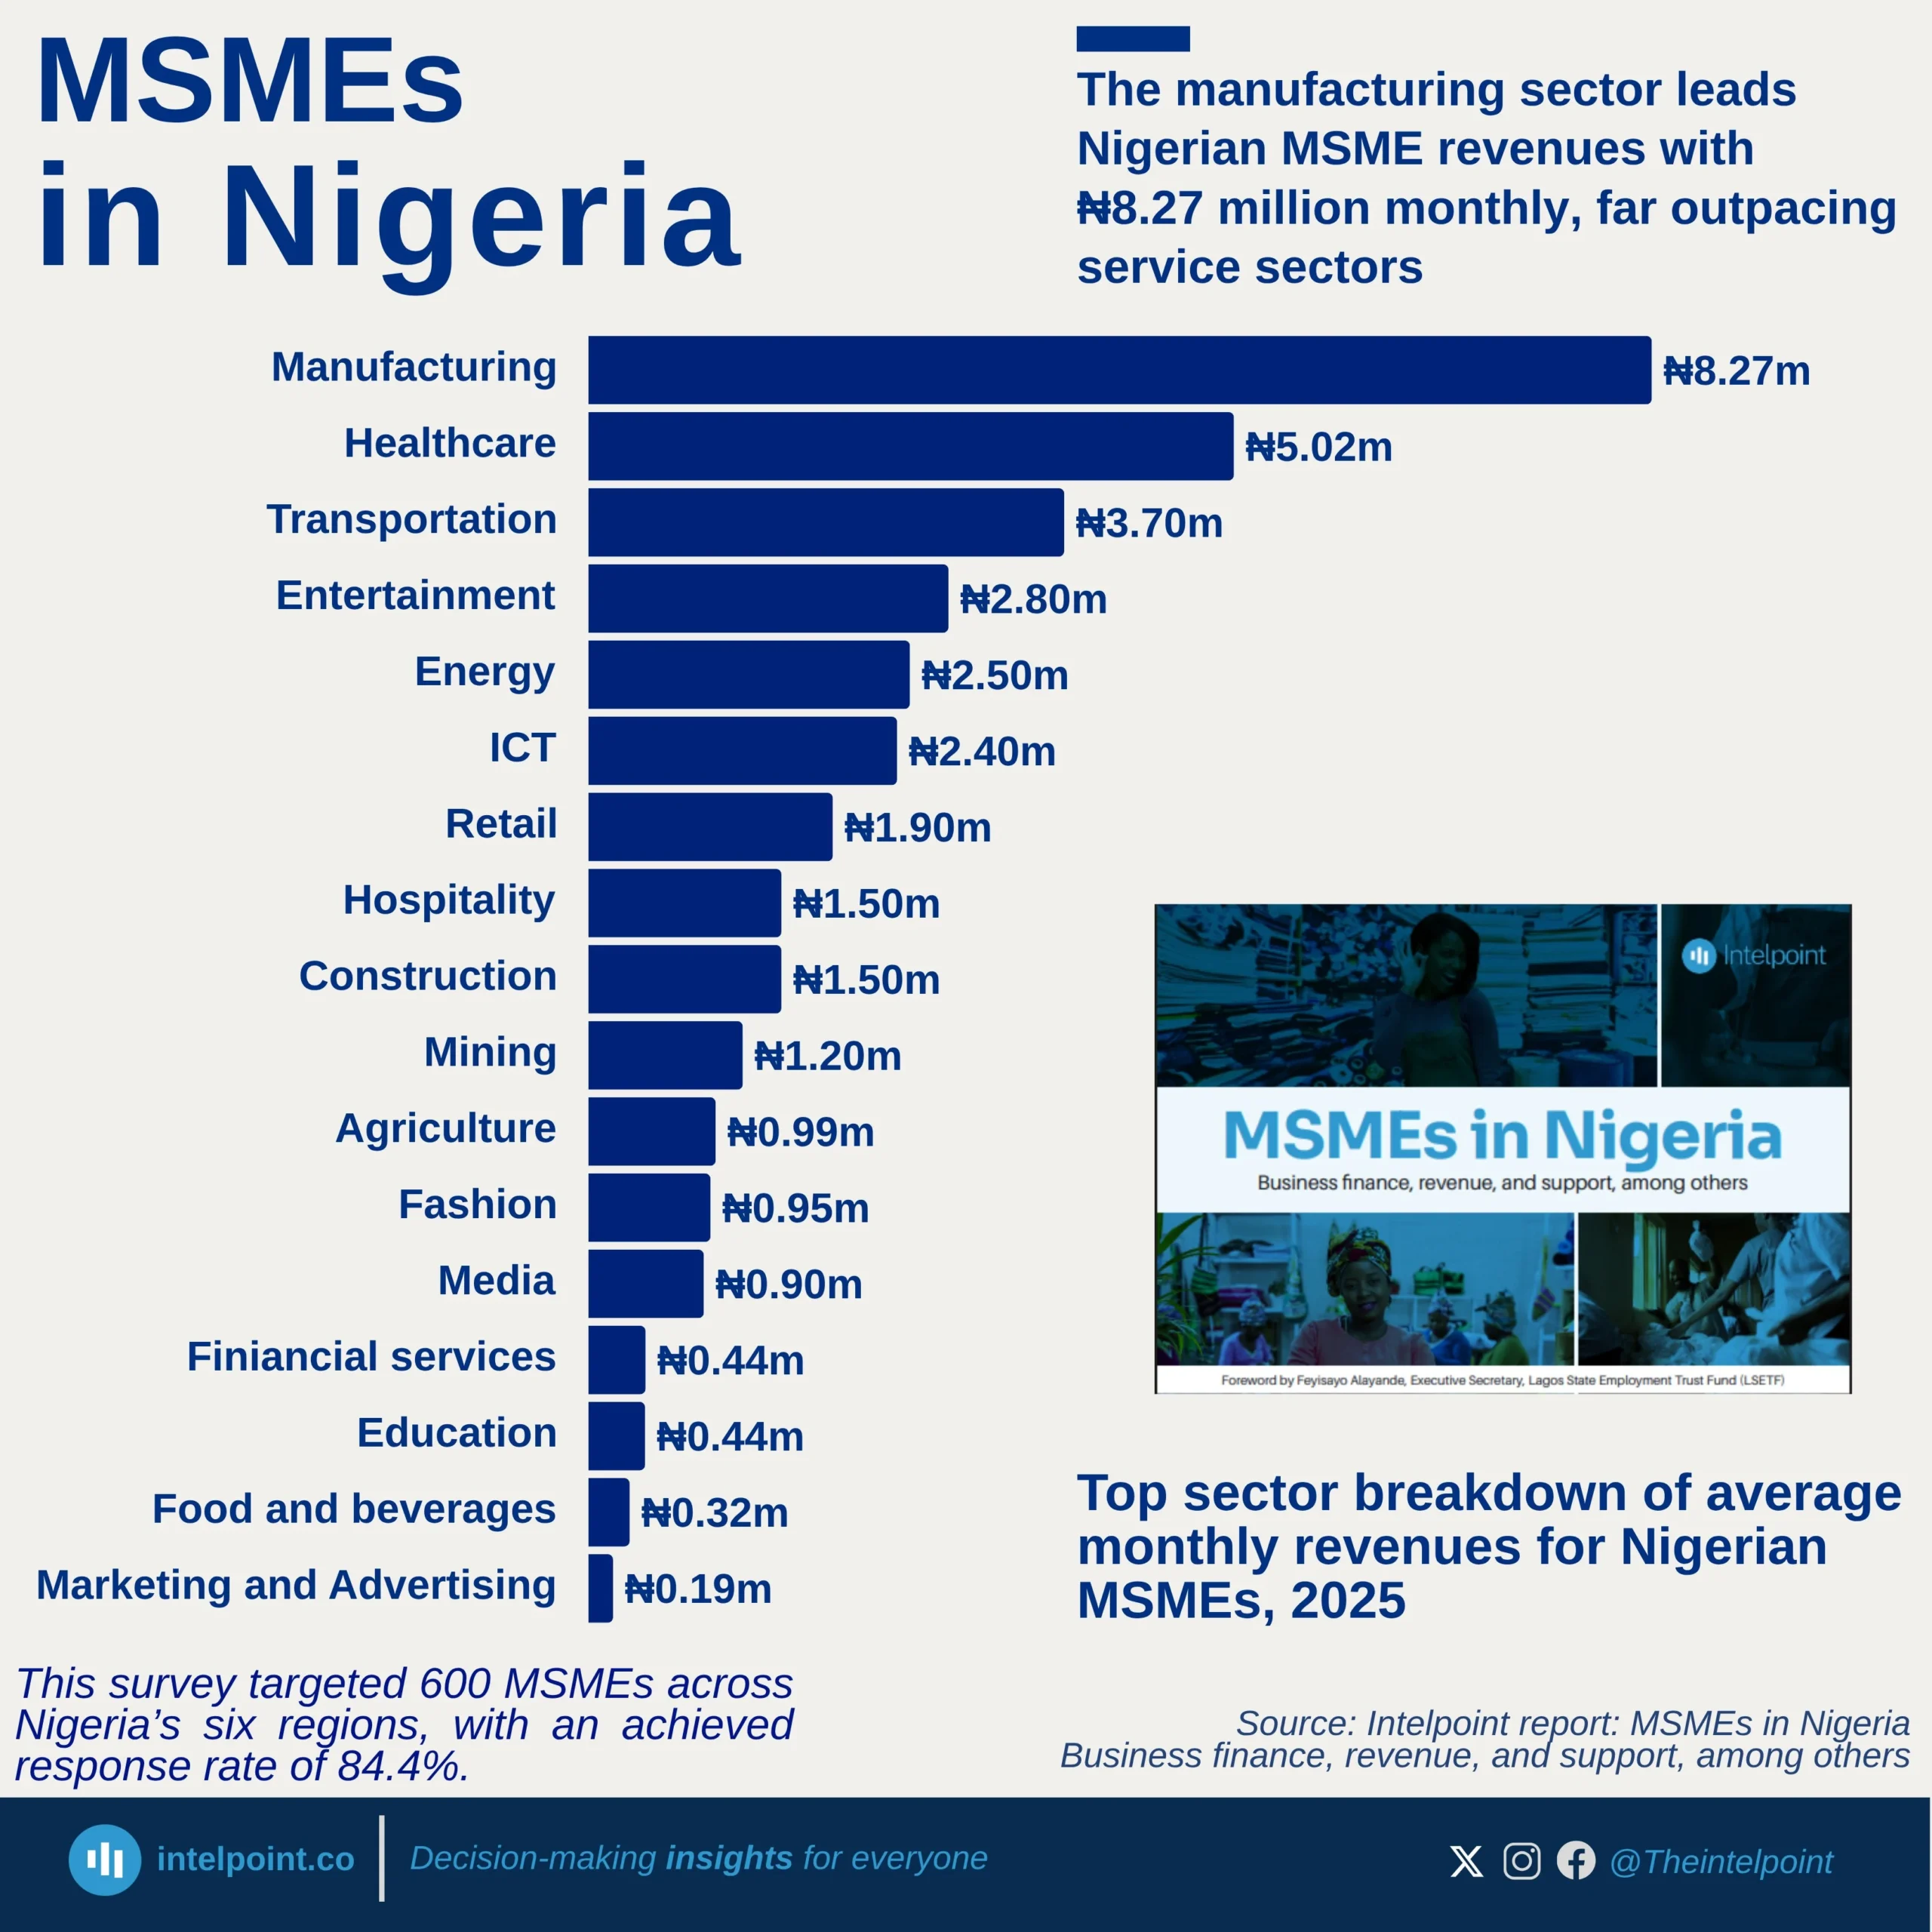
The revenue profile of Nigerian MSMEs by sector shows a clear divide between capital-intensive industries and service-oriented businesses. At the top, Manufacturing dominates with ₦8.27 million in average monthly revenue, reflecting its scale, production capacity, and wider market reach. Essential service sectors such as Healthcare (₦5.02m) and Transportation (₦3.70m) also perform strongly, benefiting from steady demand.

In contrast, MSMEs in softer industries like Marketing & Advertising (₦191k), Food & Beverages (₦320k), and Education (₦440k) earn far lower revenues, often constrained by smaller operating scales and limited capital. The gap between these sectors and the top performers illustrates the uneven playing field in Nigeria’s MSME landscape, where some industries have the infrastructure and demand to scale, while others remain subsistence-level.

Source:

Intelpoint report: MSMEs in Nigeria Business finance, revenue and support, among others

Period:

2025
HTML code to embed chart
Want a bespoke report?
Reach out
Tags
Related Insights

Lagos and Rivers have dominated Nigeria’s revenue rankings since 2008
  • A total of ₦20.45 trillion in Internally Generated Revenue (IGR) has been recorded nationwide since 2008.
  • Lagos State generated ₦1.26 trillion in 2024, maintaining its position as the top revenue-generating state.
  • For five consecutive years, Yobe and Taraba have consistently ranked among the bottom five states in revenue generation.
  • FCT IGR records began in 2018.
  • Enugu State recorded a remarkable 433.03% year-on-year increase in 2024.
  • Ebonyi (–57.27%), Ondo (–24.70%), and Yobe (–0.99%) were the only states that experienced a decline in IGR in 2024.

Borno records lowest domestic debt in North-East Nigeria at ₦22.3 billion in Q2 2025
  • The six North-Eastern states collectively owe around ₦450 billion in domestic debt as of Q2 2025.
  • Borno State maintains the lowest debt in the region at ₦22.3 billion, showing signs of controlled borrowing amid post-conflict rebuilding.
  • Bauchi State has the highest domestic debt burden of ₦143.6 billion, accounting for about 31% of the region’s total.
  • The top three states, Bauchi, Taraba and Gombe, collectively account for more than two-thirds of the zone’s total subnational debt stock.

In just six months, Nigeria spent over $2.3 billion servicing external debts
  • Nigeria paid $816.3 million to the International Monetary Fund, accounting for over 35% of total external debt service payments.
  • Eurobond payments followed closely, with $687.8 million paid, reflecting Nigeria’s heavy reliance on commercial debt instruments.
  • Multilateral lenders like IDA and AfDB collectively received about $463 million, signalling continued exposure to concessional financing.
  • China’s share shrinking: Payments to Chinese lenders (EXIM + CDB) totalled $235.6 million, less than 11% of total outflows, suggesting reduced Chinese debt servicing in H1 2025.

Over 60% of Nigeria’s ₦1.7 trillion domestic debt service in Q2 2025 was spent on Federal Government Bonds
  • FGN bonds dominated: ₦1.07 trillion went to Federal Government Bonds, accounting for about 63% of total domestic debt servicing.
  • Treasury bills followed: Payments on NTBs reached ₦537.9 billion, making up roughly 31% of the total.
  • Sukuk and promissory notes together cost ₦90.8 billion, reflecting Nigeria’s mix of infrastructure and settlement instruments.
  • Green and savings bonds remained minimal, together below ₦5 billion, showing limited traction for retail and sustainability-focused debt.

93% of Nigeria's public debt is owed by the Federal Government
  • The Federal Government’s share of total public debt rose from 79.5% in 2019 to 92.6% in 2025.
  • States’ share has more than halved, from 20.5% to 7.4% in six years.
  • Total public debt grew from $83.9 billion to $99.7 billion, peaking at $113.4 billion in 2023.
  • Nigeria’s debt burden is increasingly concentrated at the centre, amplifying federal repayment risks and reducing fiscal independence for states.

Over 60% of Nigerians use crypto for savings and long-term investing
  • Wealth-building dominates motivation: 45.4% cite “active wealth building” as their primary motive, and an additional 21.8% cite “long-term financial security”.
  • Payments and utility are minor drivers: Only 3.3% report “daily utility” and 2.2% “digital commerce” as their chief motive for using crypto.
  • Hedging and cross-border flows matter: 8.7% use crypto for currency hedging, and 4.1% for cross-border payments, showing a dual role of investment plus international value flows.
  • Nigerian retail users treat crypto like a conventional financial instrument rather than only as a means of payment or speculation.

POPULAR TOPICS
SIGN UP TO OUR NEWSLETTER
Get periodic updates about the African startup space, access to our reports, among others.
Subscribe Here
Subscription Form

A product of Techpoint Africa. All rights reserved