Over 80% of Nigeria’s imports in 2024 came from manufacturing and oil products

Key takeaways:

  • Manufactured goods accounted for 44.2% of Nigeria’s total imports.
  • Petroleum products (excluding crude oil) made up 38% of the import value.
  • Raw materials represented 11% of the total import value.
  • Agricultural imports contributed 6.2% to the overall import value.
  • The total import value stood at ₦60.59 trillion in 2024, from ₦30.86 trillion in 2023.
  • The energy resources sector made a negligible amount in import value, while no record was made for the crude oil sector.

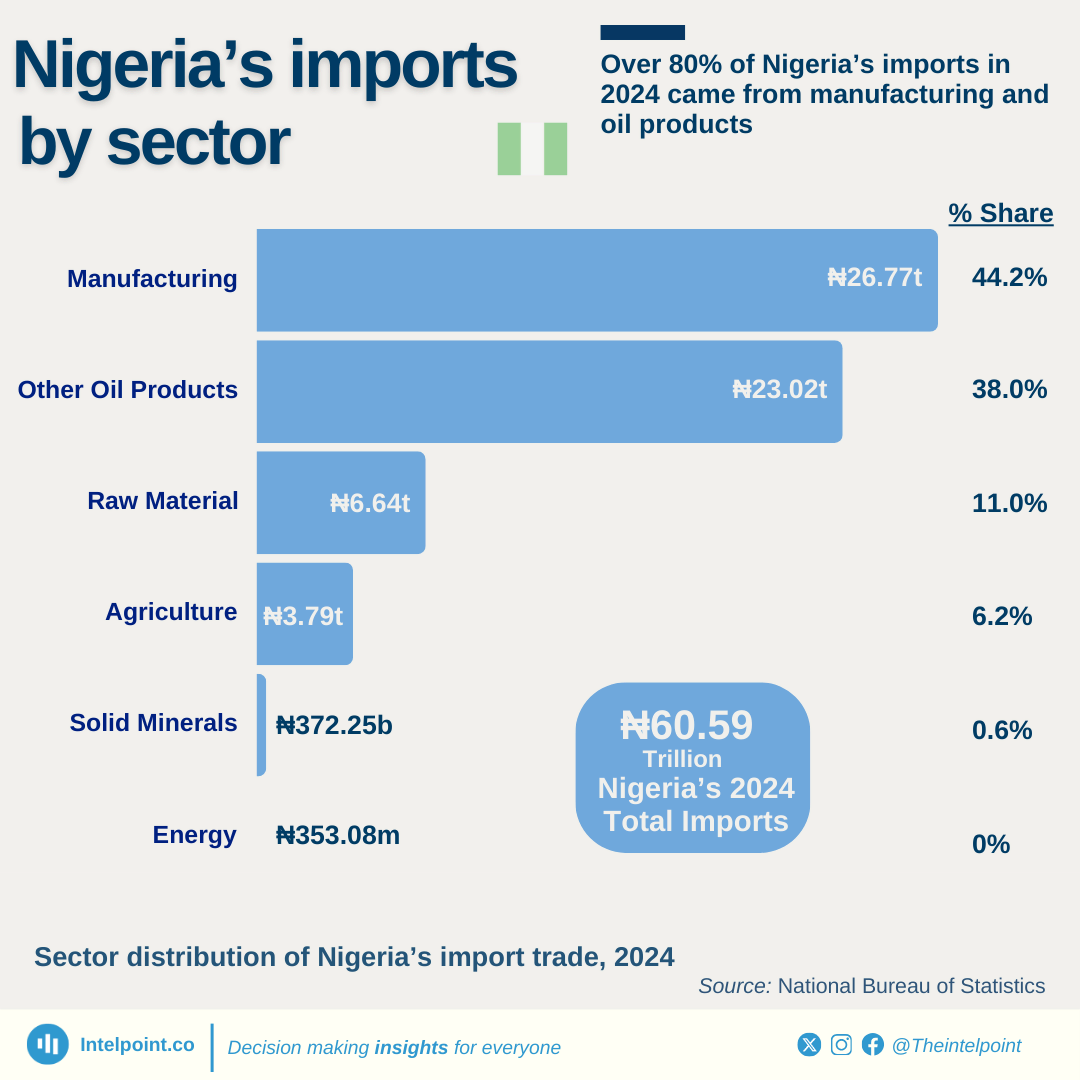
In 2024, Nigeria’s import landscape was predominantly driven by the manufactured goods and refined petroleum products sectors. The manufacturing goods sector tops Nigeria’s imports, accounting for 44.2% of the total ₦60.59 trillion in import value. Petroleum products (excluding crude oil) followed closely, contributing 38%, underscoring the country’s dependence on imported refined fuels despite being a major crude oil producer.


Raw materials accounted for 11% of Nigeria’s total imports, while agricultural products comprised 6.2%, highlighting the country’s reliance on foreign inputs for both industrial and food needs.

Source:

National Bureau of Statistics

Period:

2024
HTML code to embed chart
Want a bespoke report?
Reach out
Tags
Related Insights

Nigeria imported 10x more from Asia than from Africa in 2025
  • Asia is Nigeria’s top import source in 2025.
  • The highest import value from Asia was recorded in Q1 at ₦8.7 trillion.
  • Imports from Europe surged to ₦8.6 trillion in Q2 but declined to ₦6.6 trillion by Q4.
  • Imports from America showed continuous growth, rising from ₦2.9 trillion in Q1 to ₦6.6 trillion in Q4.
  • Imports from Africa remained below ₦1 trillion across most quarters.

China’s exports to Nigeria increased by 40% in 2025
  • China’s exports to Nigeria increased by 40.4%,
  • China's exports moved from ₦ 14.1 trillion in 2024 to ₦ 19.8 trillion in 2025.
  • Growth was consistent across all four quarters.
  • Quarter 2 saw the highest growth at 80%, jumping from ₦3.0tn to ₦5.4tn.
  • Quarter 4 recorded a modest 4.3% rise.

Nigeria’s export mix stayed oil-heavy in 2025, with crude oil above 75% in all quarters
  • Crude oil dominated Nigeria’s exports in all quarters of 2025
  • Q1 recorded the highest oil dependency at 81.5%.
  • Non-oil exports peaked in Q2 at 24.2%, representing the strongest diversification point in 2025.
  • The oil share dropped to its lowest in Q2 (75.8%), but still remained dominant.

In 2025, Nigeria imported crude oil for the first time in the past decade, accounting for 11% of its total crude oil trade
Key takeaways:
  • Nigeria recorded its first crude oil imports in a decade in 2025, marking a structural shift in trade dynamics.
  • Imports accounted for 11% of total crude oil trade in 2025.
  • Total crude oil trade grew sharply from ₦7 trillion in 2016 to ₦53.2 trillion in 2025, indicating long-term expansion.
  • Exports remain dominant, contributing ₦47.4 trillion in 2025 despite the emergence of imports.
  • 2024 was the peak year for crude oil trade at ₦55.3 trillion, followed by a slight decline in 2025.
  • The 2020 dip of ₦9.4 trillion highlights vulnerability to global shocks, likely tied to oil price and demand disruptions.

Nigeria exported ₦47tn in crude, yet spent ₦45tn importing finished goods and refined petroleum
  • Crude oil alone accounts for 55.7% of all exports. Remove it and Nigeria runs a ₦26.7tn trade deficit. The entire surplus rests on one commodity.
  • Nigeria imports ₦31.97tn in manufactured goods but exports only ₦2.50tn, a 12-to-1 ratio that reflects near-total dependence on foreign industrial output.
  • Nigeria exports ₦25.3tn in petroleum products yet imports ₦13.3tn of refined petroleum. Africa's top oil producer still can't fully process its own crude.
  • Despite Nigeria's vast farmland, agri-exports (₦5.07tn) barely exceed agri-imports (₦4.76tn). The sector earns almost nothing net.

Malacca and Hormuz handle about 24% and 22% of global oil supply, respectively
  • The Strait of Malacca is the world’s most important oil chokepoint, carrying about 24–25% of global oil supply in recent years.
  • The Strait of Hormuz moves around 20–23% of global oil supply, making it the second-largest energy transit chokepoint.
  • The Cape of Good Hope carries about 9–10% of global oil flows, and its share tends to increase when other chokepoints face disruptions.
  • The Bab el-Mandeb saw a sharp drop in oil flow share from about 9% in 2023 to around 4% in 2024, reflecting security concerns affecting shipping in the Red Sea corridor.
  • Oil transported through the Suez Canal and the SUMED pipeline system dropped significantly after 2023, falling from about 8.6% to below 5%, showing how quickly routes shift during geopolitical tensions.
  • The Strait of Malacca’s share has remained consistently high and stable, indicating its structural importance to Asian energy demand.
  • Alternative routes like the Cape of Good Hope in South Africa are longer but strategically crucial, especially when Middle Eastern chokepoints become unstable.

POPULAR TOPICS
SIGN UP TO OUR NEWSLETTER
Get periodic updates about the African startup space, access to our reports, among others.
Subscribe Here
Subscription Form

A product of Techpoint Africa. All rights reserved