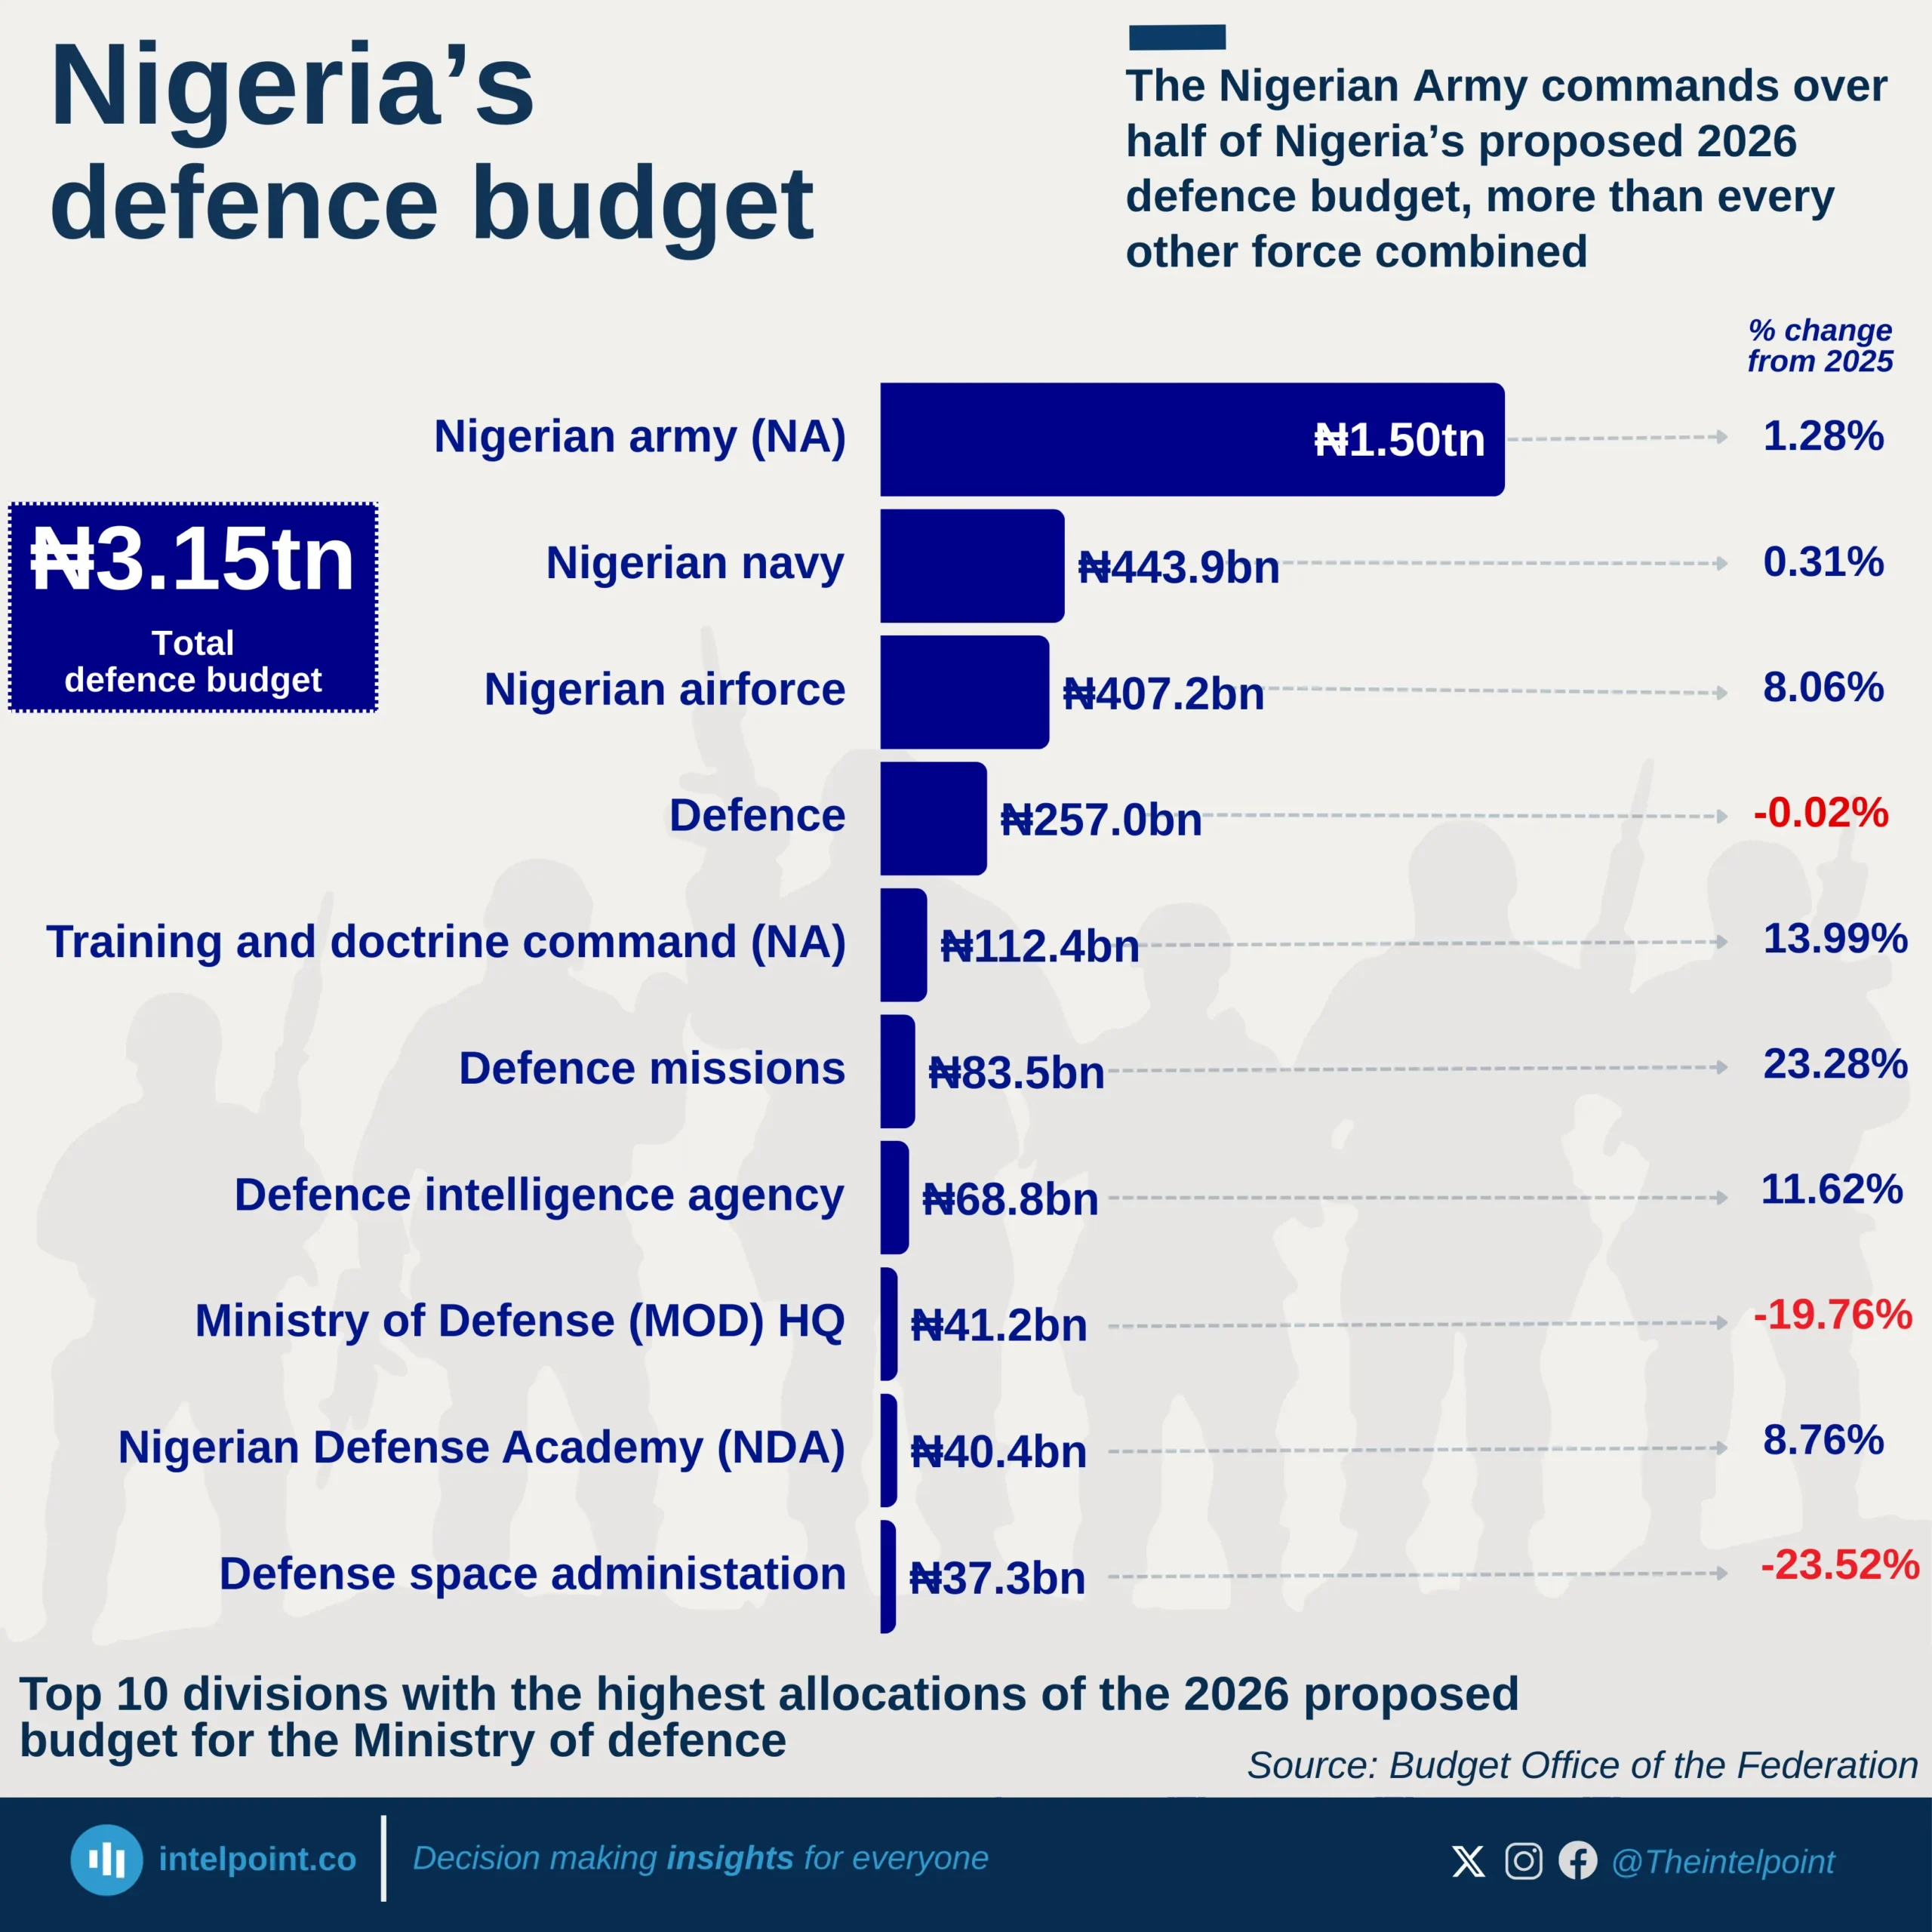
The Army has been allocated ₦1.50tn, more than half of the top-ten defence allocations, making it the backbone of Nigeria’s security spending.
The Navy (₦443.9bn) and Air Force (₦407.2bn) come next, but together they are far behind the Army.
Institutions like the Defence Intelligence Agency, Training and Doctrine Command, and Defence Missions receive meaningful but much smaller funding, reinforcing their support-role status.
The Defence Space Administration (₦37.3bn) is on the table, but its small size shows Nigeria is only cautiously stepping into cyber- and space-based security.
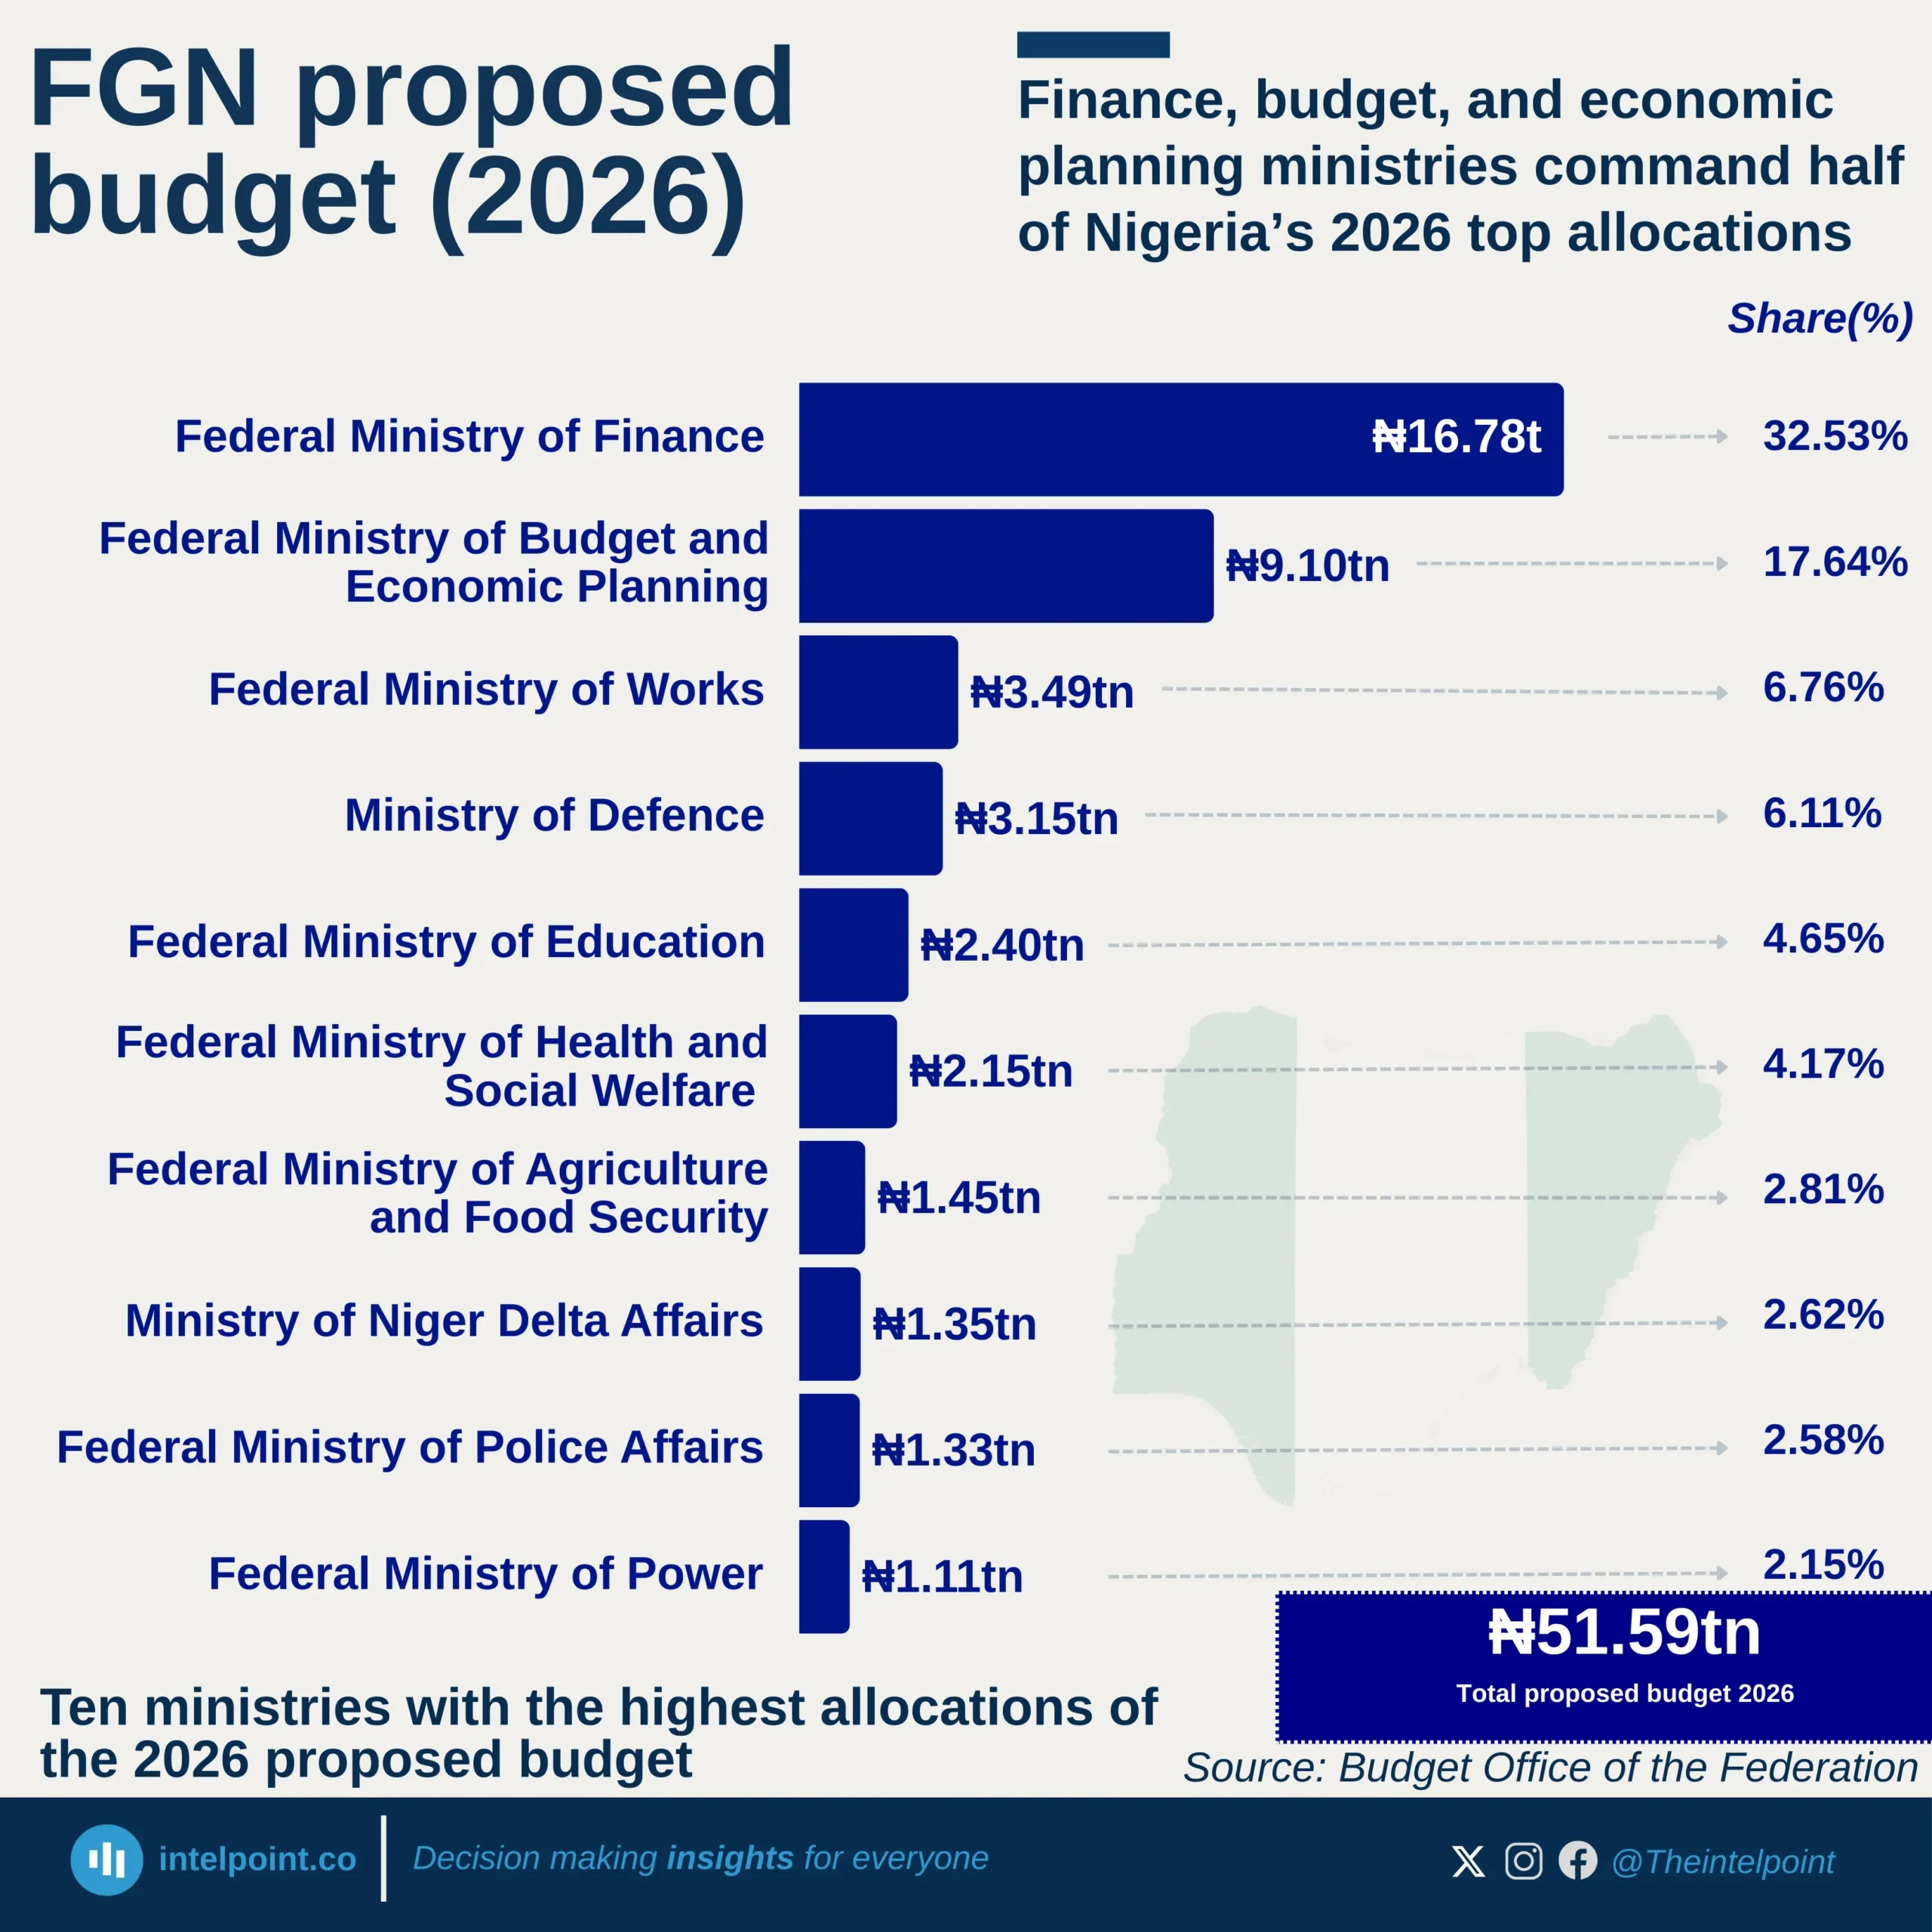
The Federal Ministry of Finance dominates with ₦16.78 trillion, accounting for nearly ₦1 in every ₦3 spent among the top ministries.
Combined, the ministries of Finance and Budget & Economic Planning control more than 50% of the listed allocations, underscoring the government’s focus on fiscal strategy and economic agenda.
The Works and Defence sectors rank third and fourth, reflecting continuous prioritisation of infrastructure development and national security.
Education and Health, while critical, receive smaller shares, signalling potential pressure points in human capital development funding
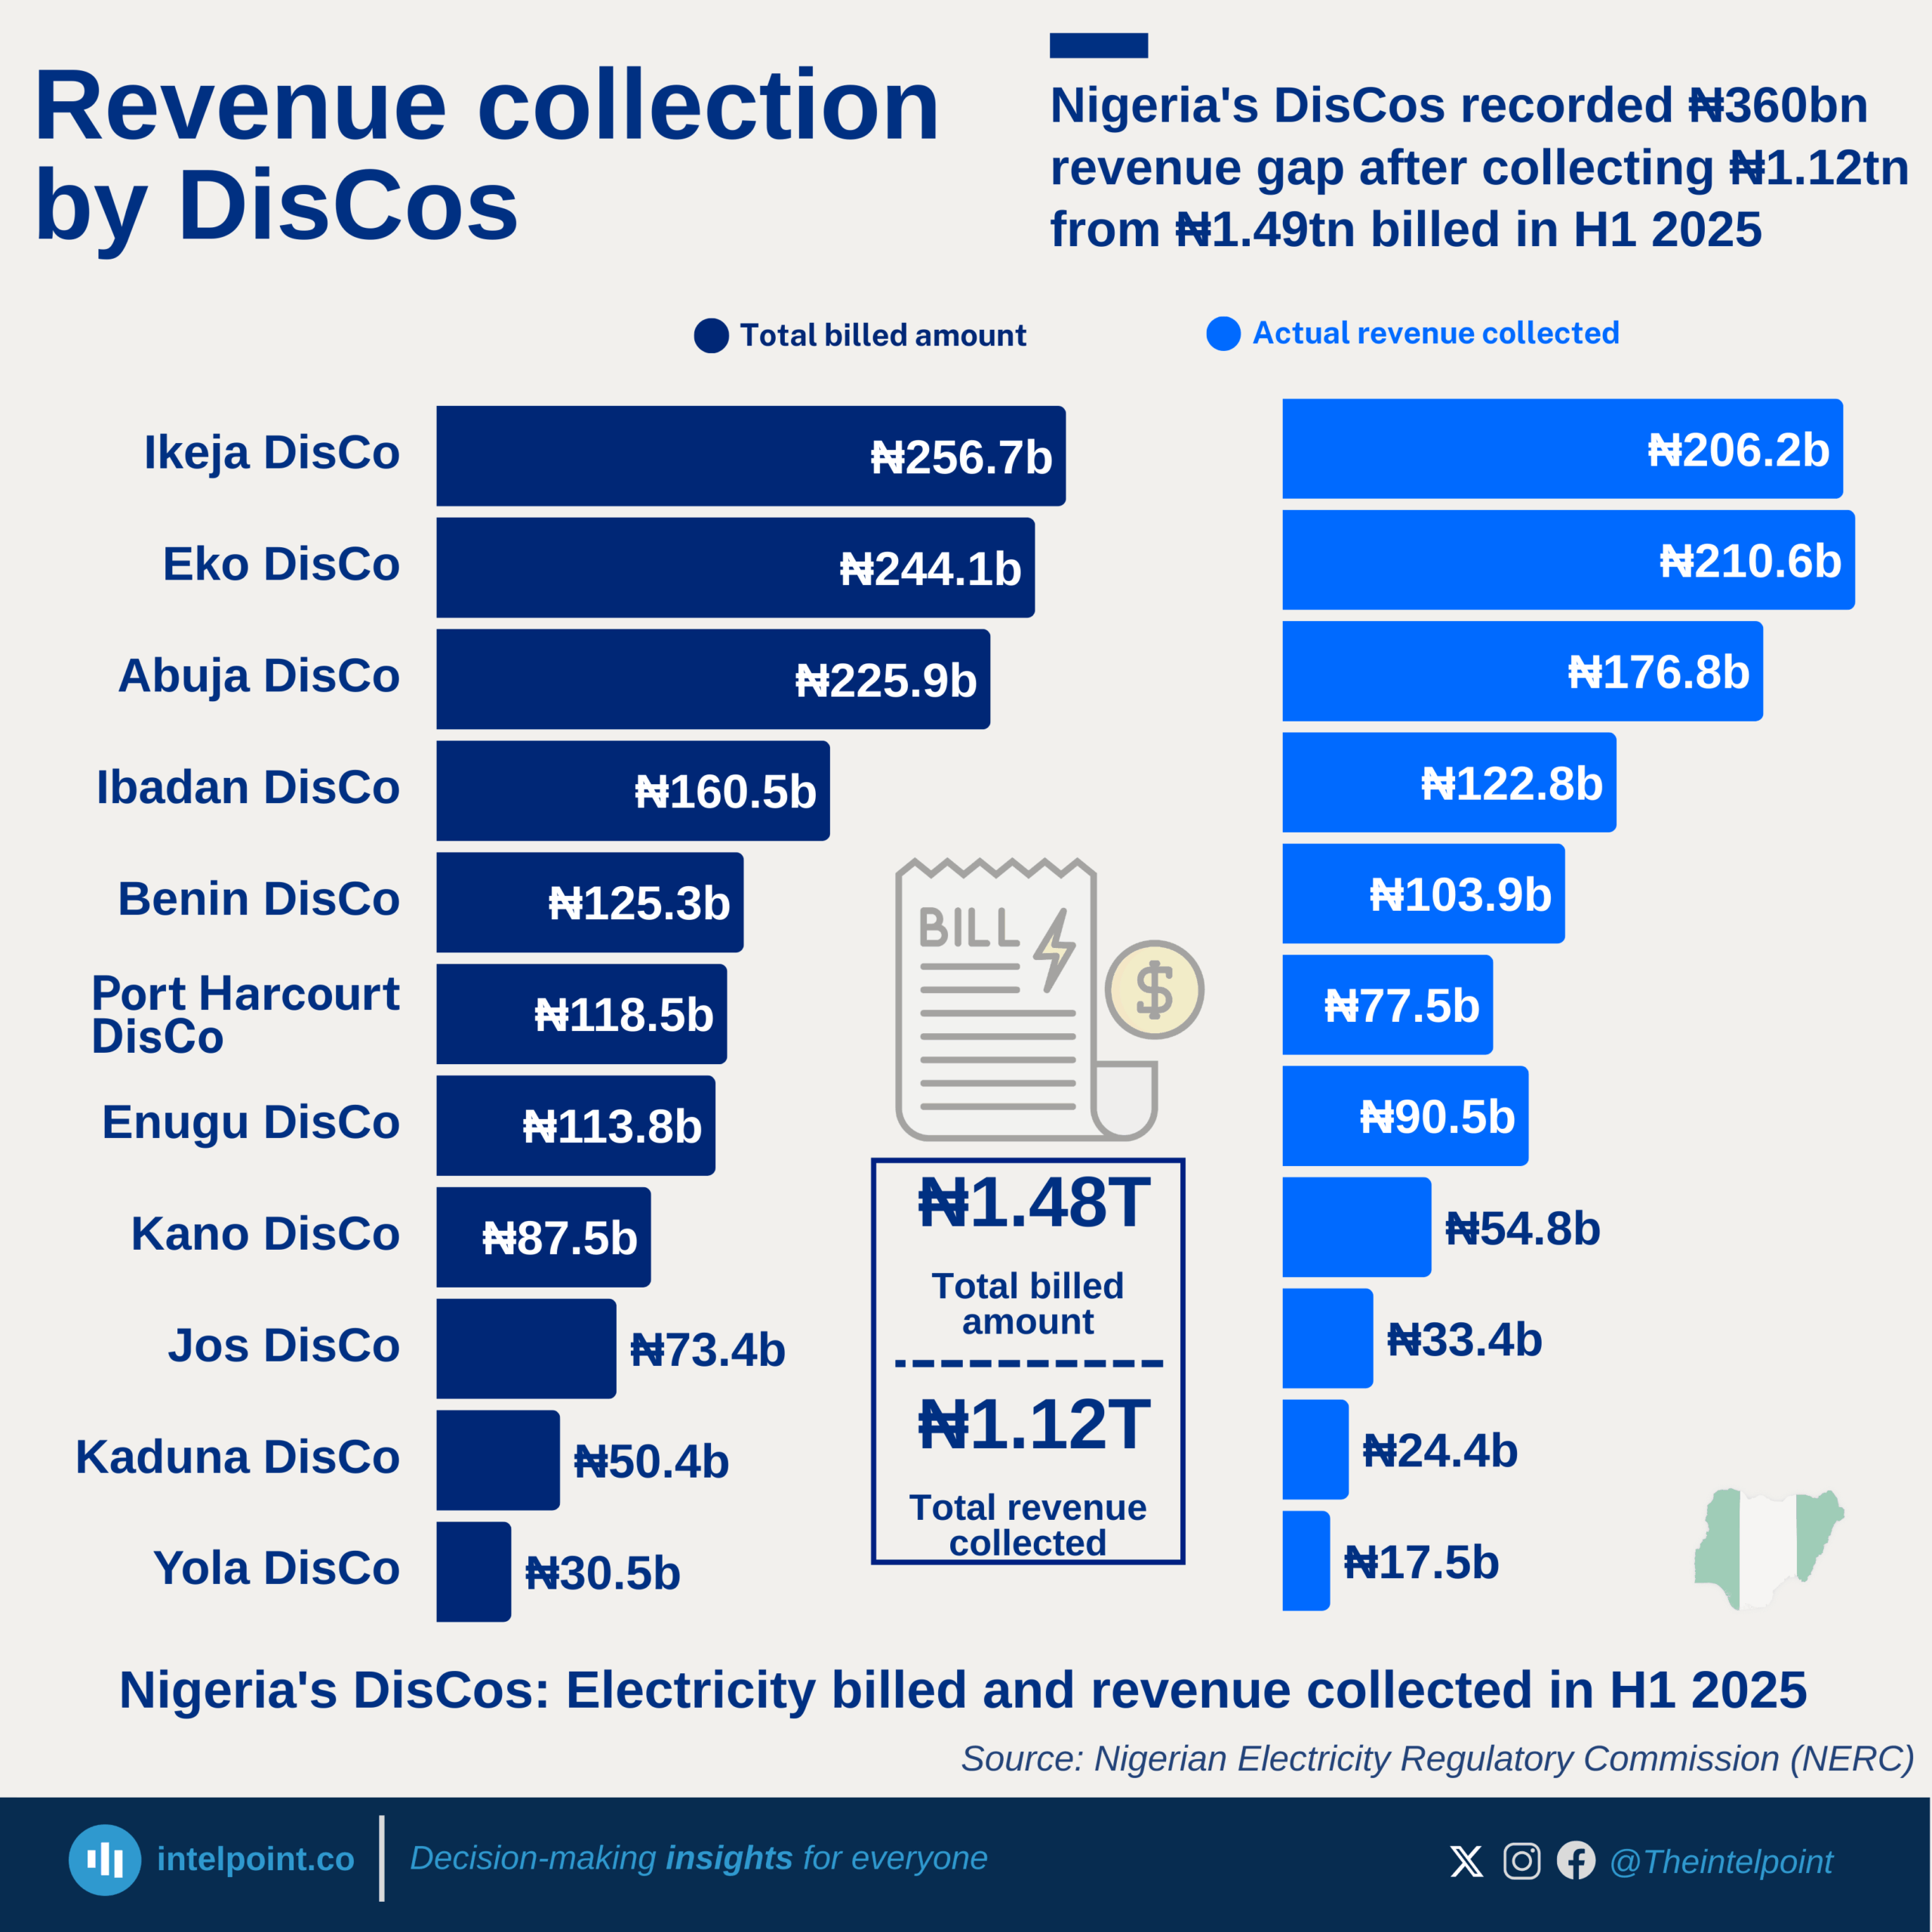
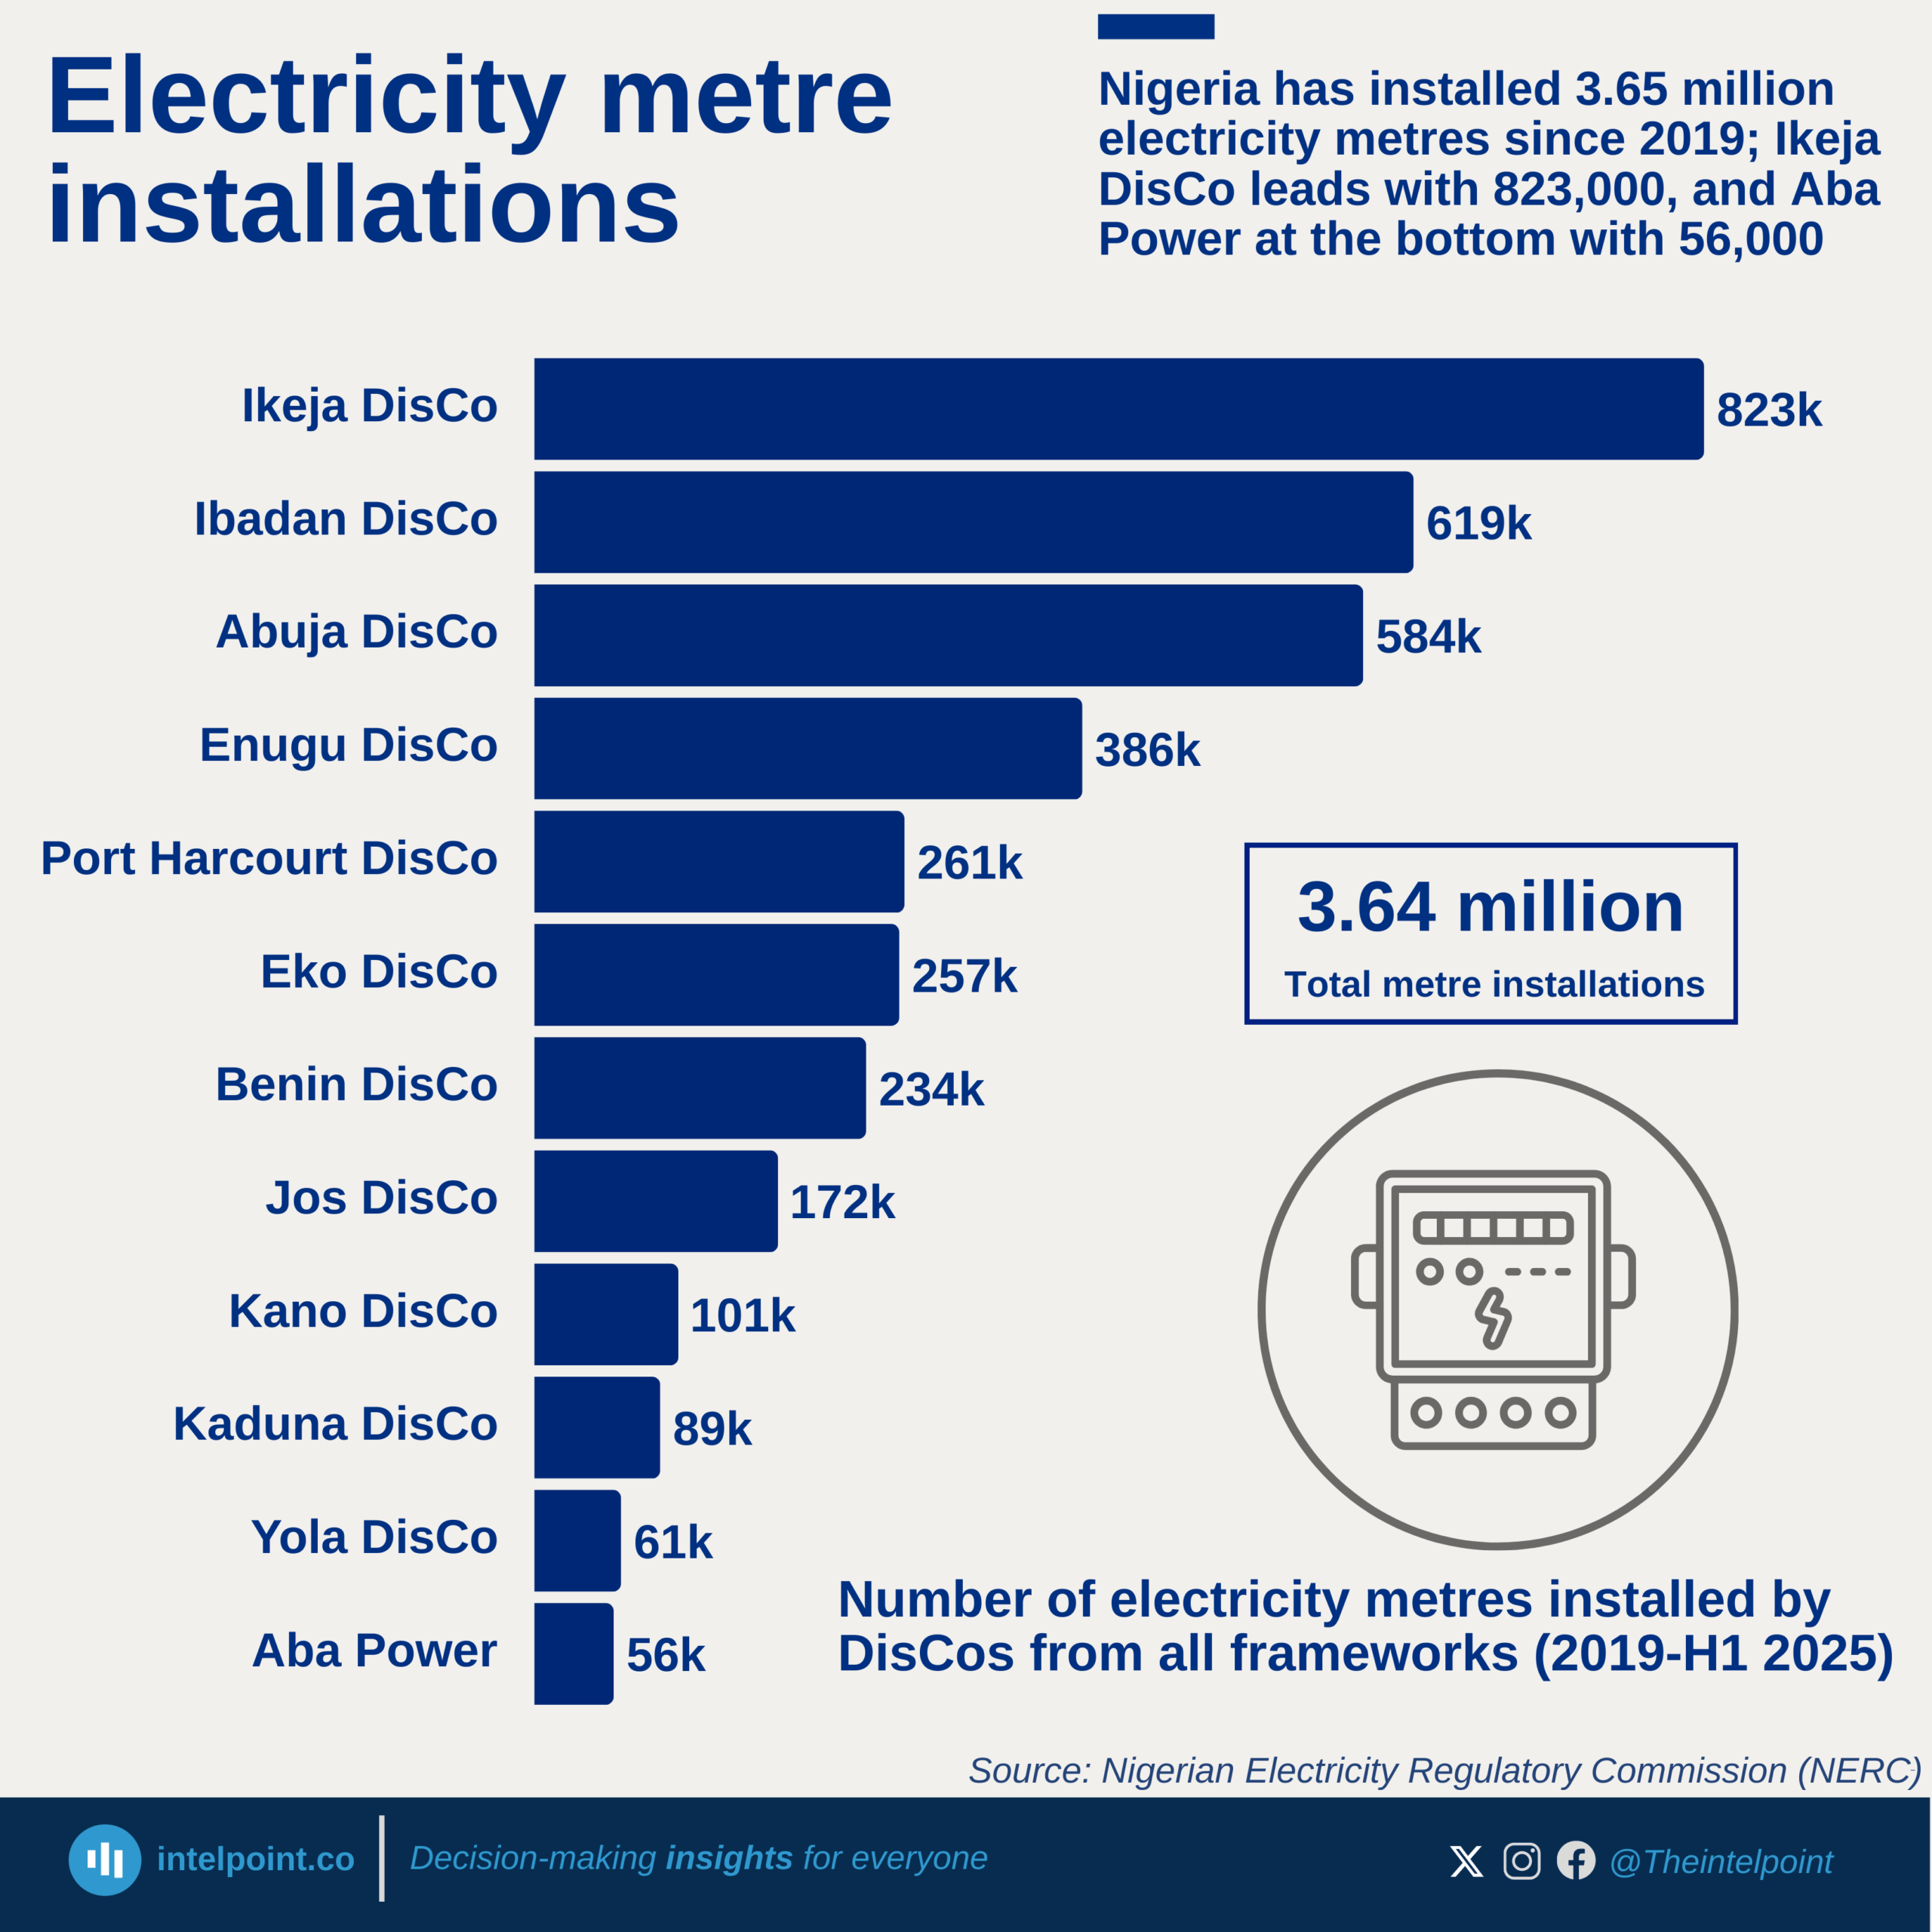
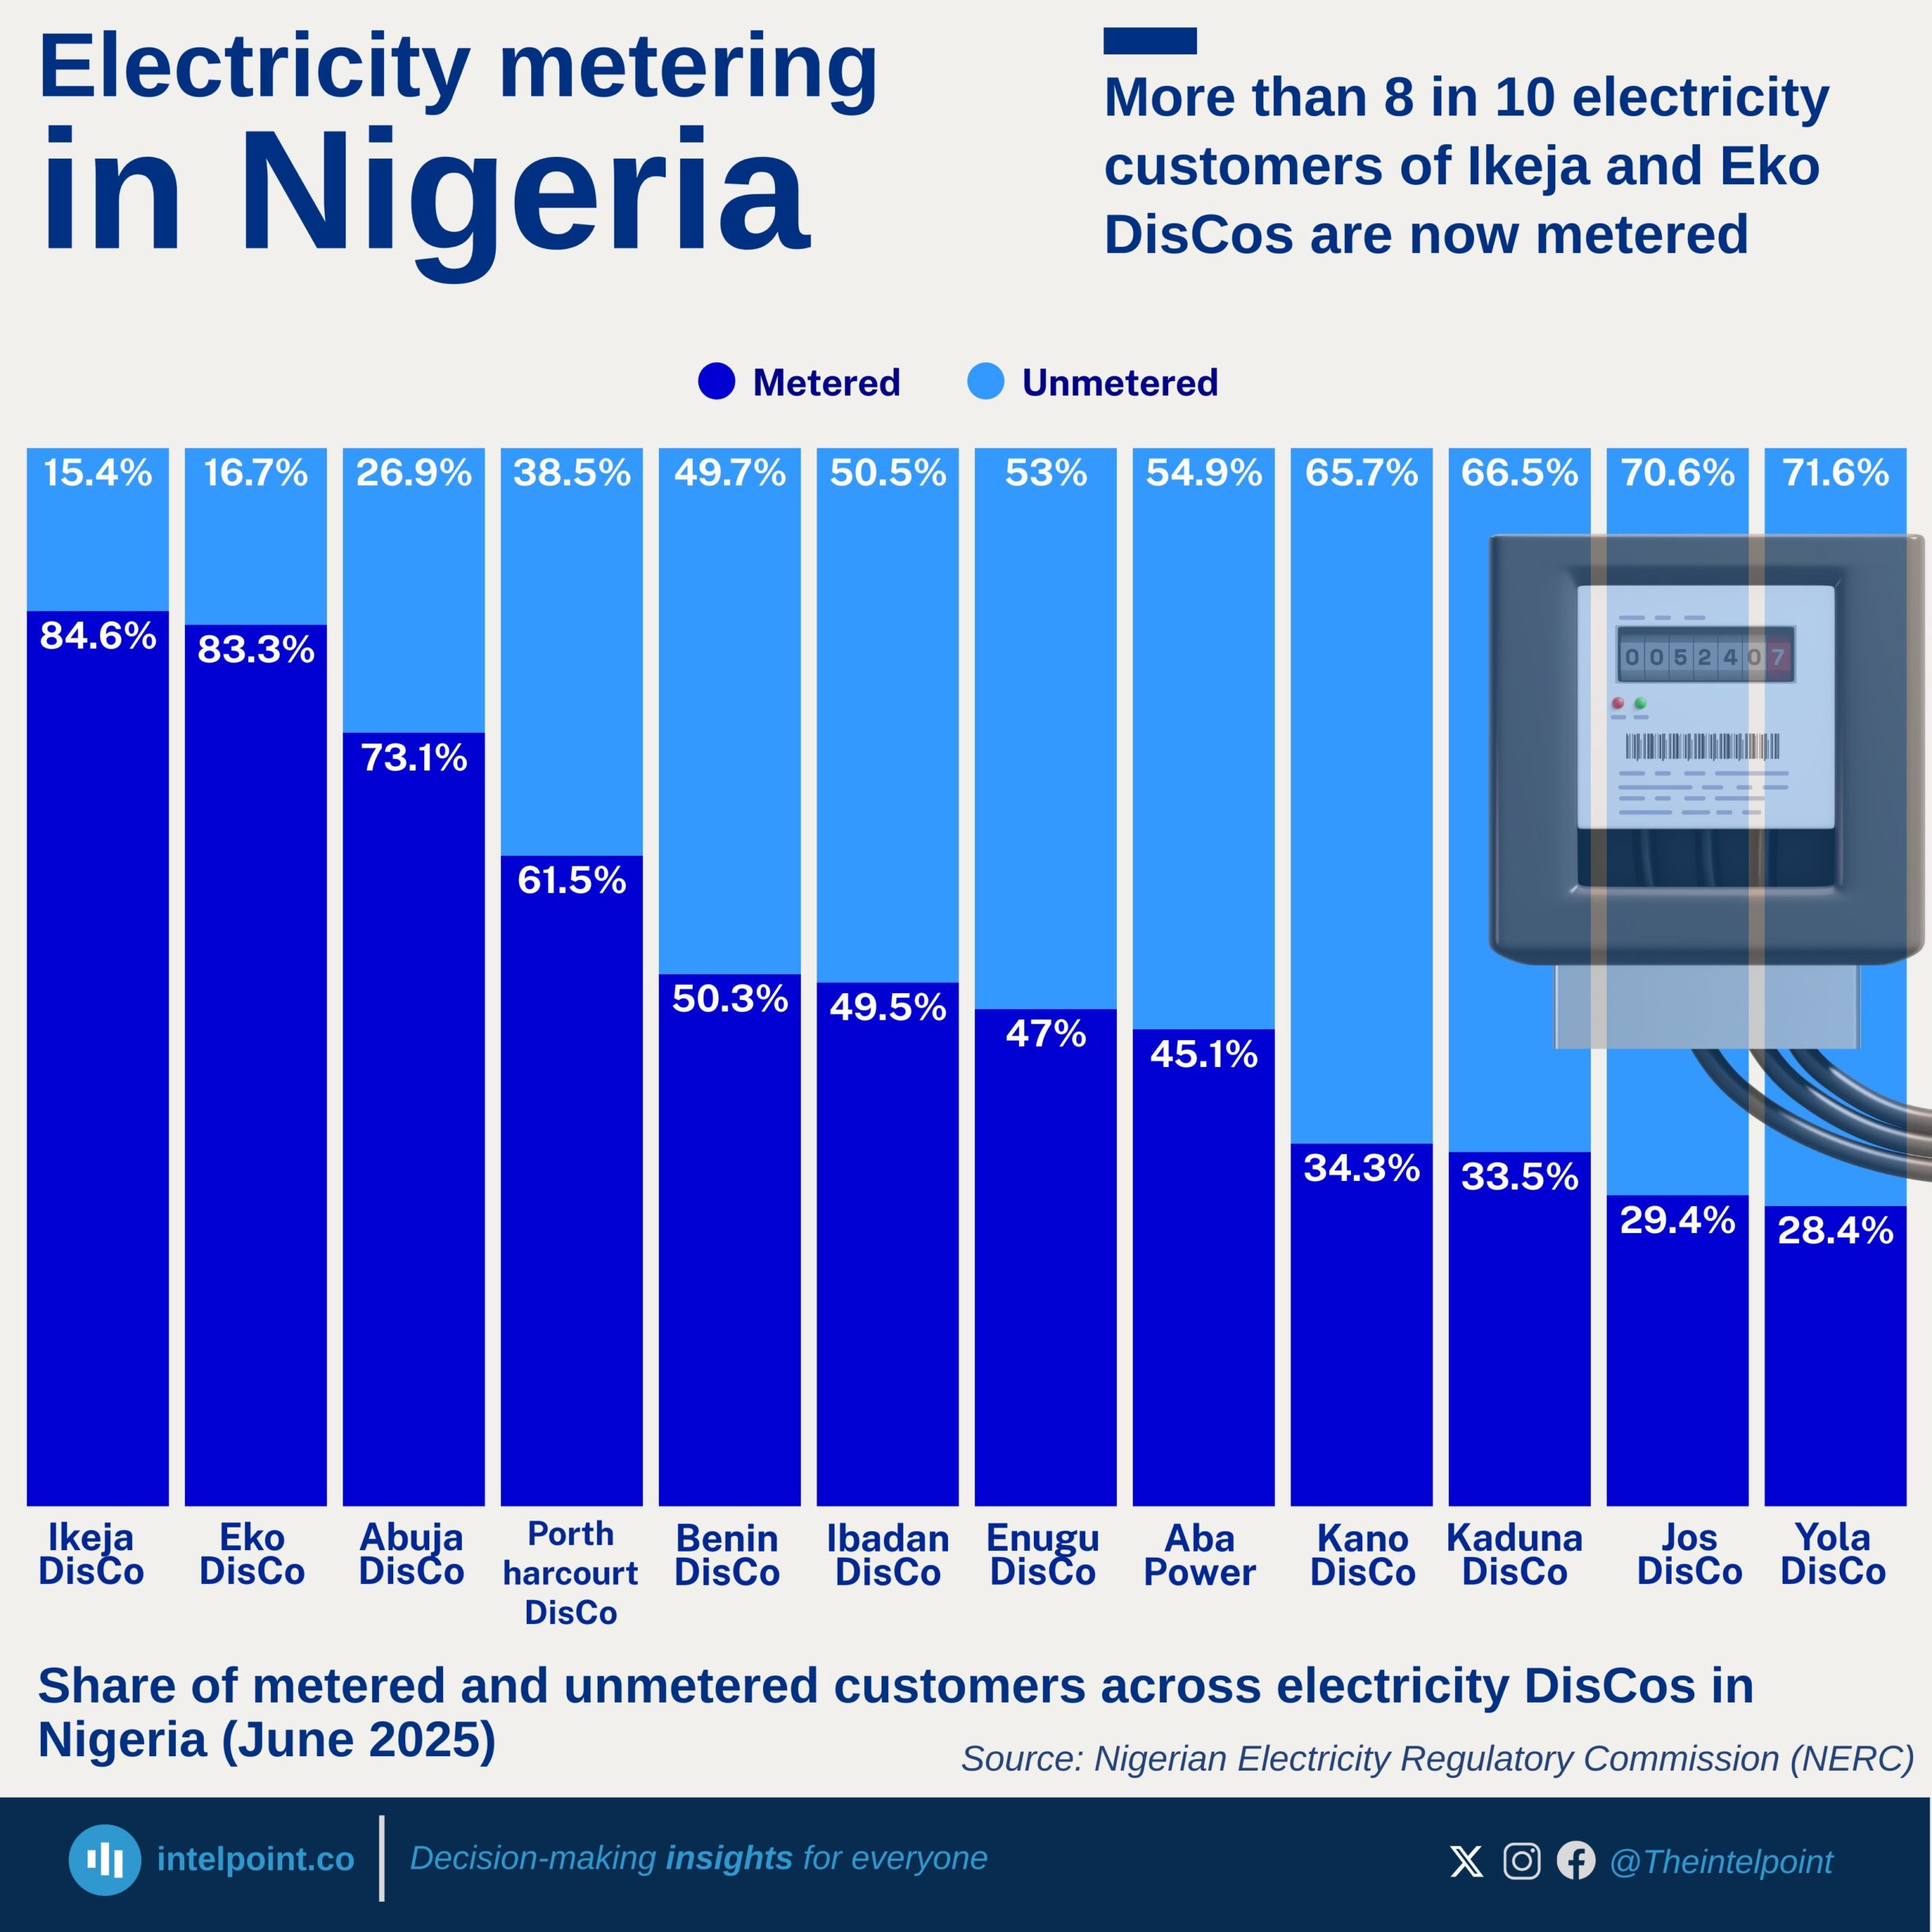
DisCos billed approximately ₦1.49 trillion but collected only ₦1.12 trillion in H1 2025.
Ikeja and Eko DisCos generated the highest revenues, collecting ₦206.22 billion and ₦210.59 billion, respectively.
Revenue collection gaps remain significant, with Jos, Kaduna, and Yola posting the weakest collection performances.
The wide gap between billings and actual collections suggests persistent challenges in customer payment compliance, metering, and distribution efficiency.
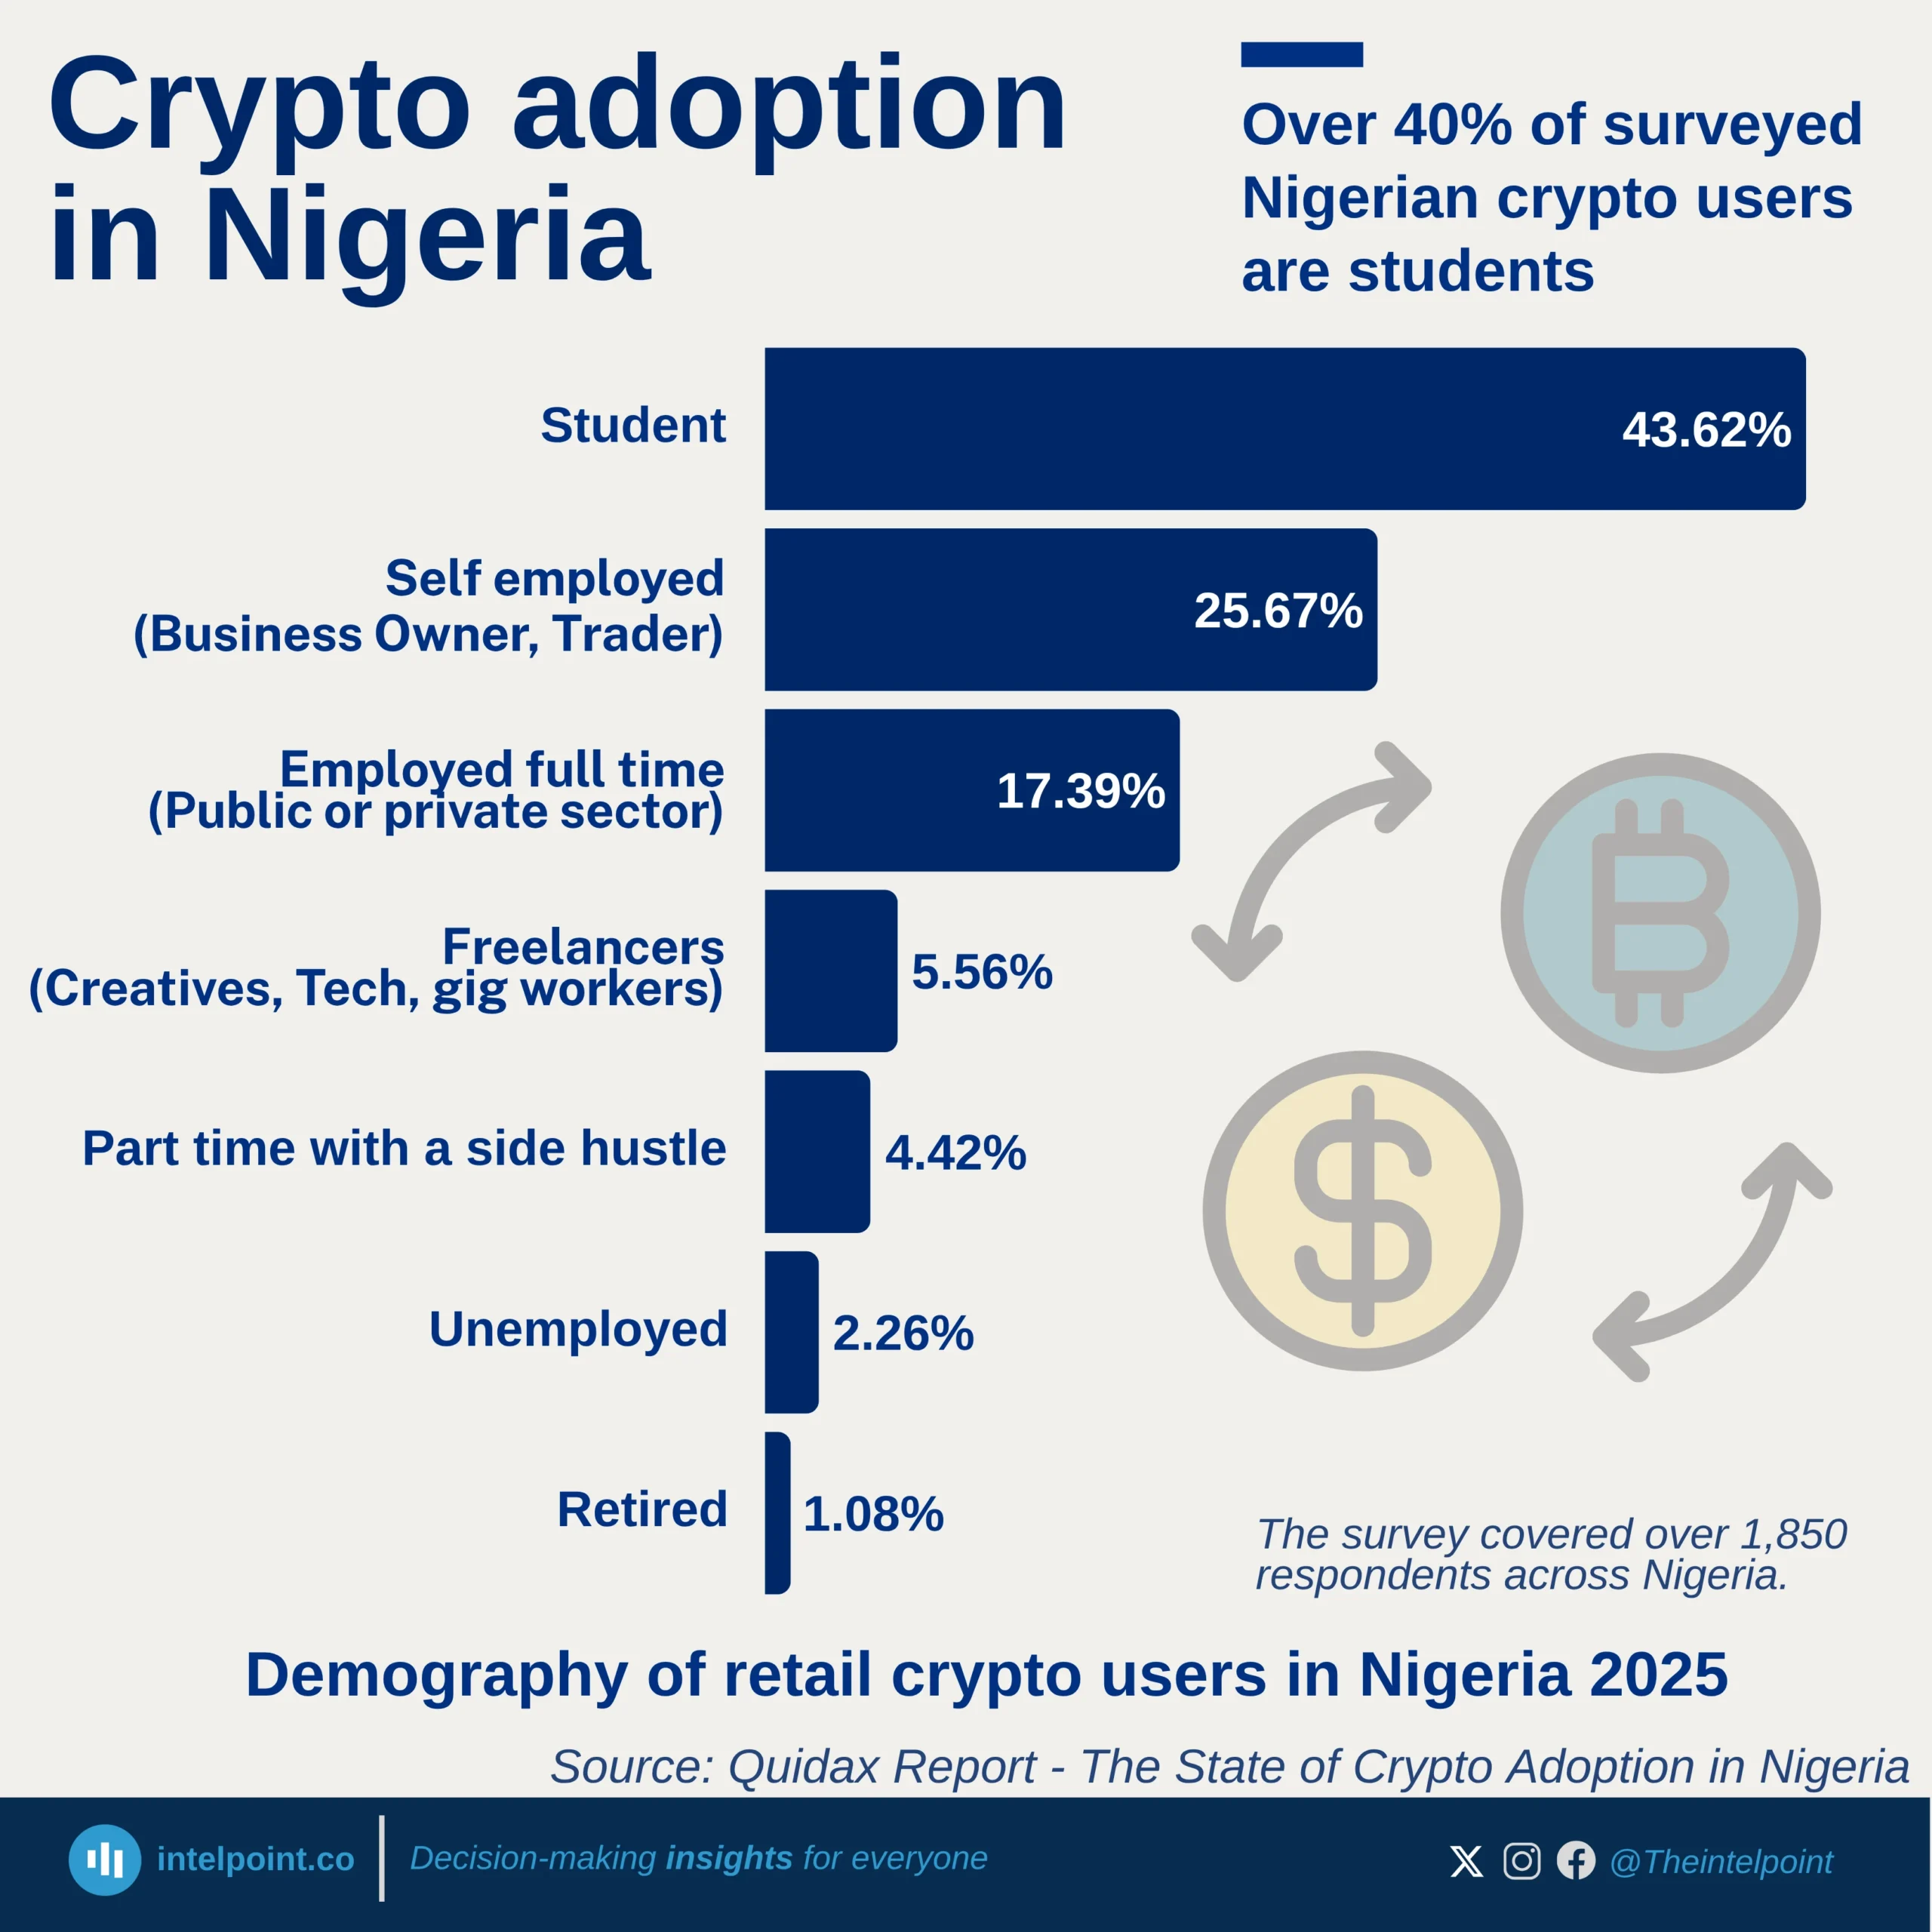
Students are the largest crypto-holding group (43.6%), underscoring the youthful nature of Nigeria’s crypto community and their early adoption of digital finance.
Entrepreneurs follow closely (25.7%), showing strong participation from self-employed Nigerians, traders, business owners, and hustlers who use crypto for investment and business flexibility.
Traditional employees make up 17.4%, indicating growing acceptance of crypto beyond informal or youth circles, even among salary earners.
Freelancers and gig workers (5.6%) also feature, reflecting crypto’s role in global online work and cross-border earnings. Unemployed and retired individuals remain a small minority, under 3.5% combined.
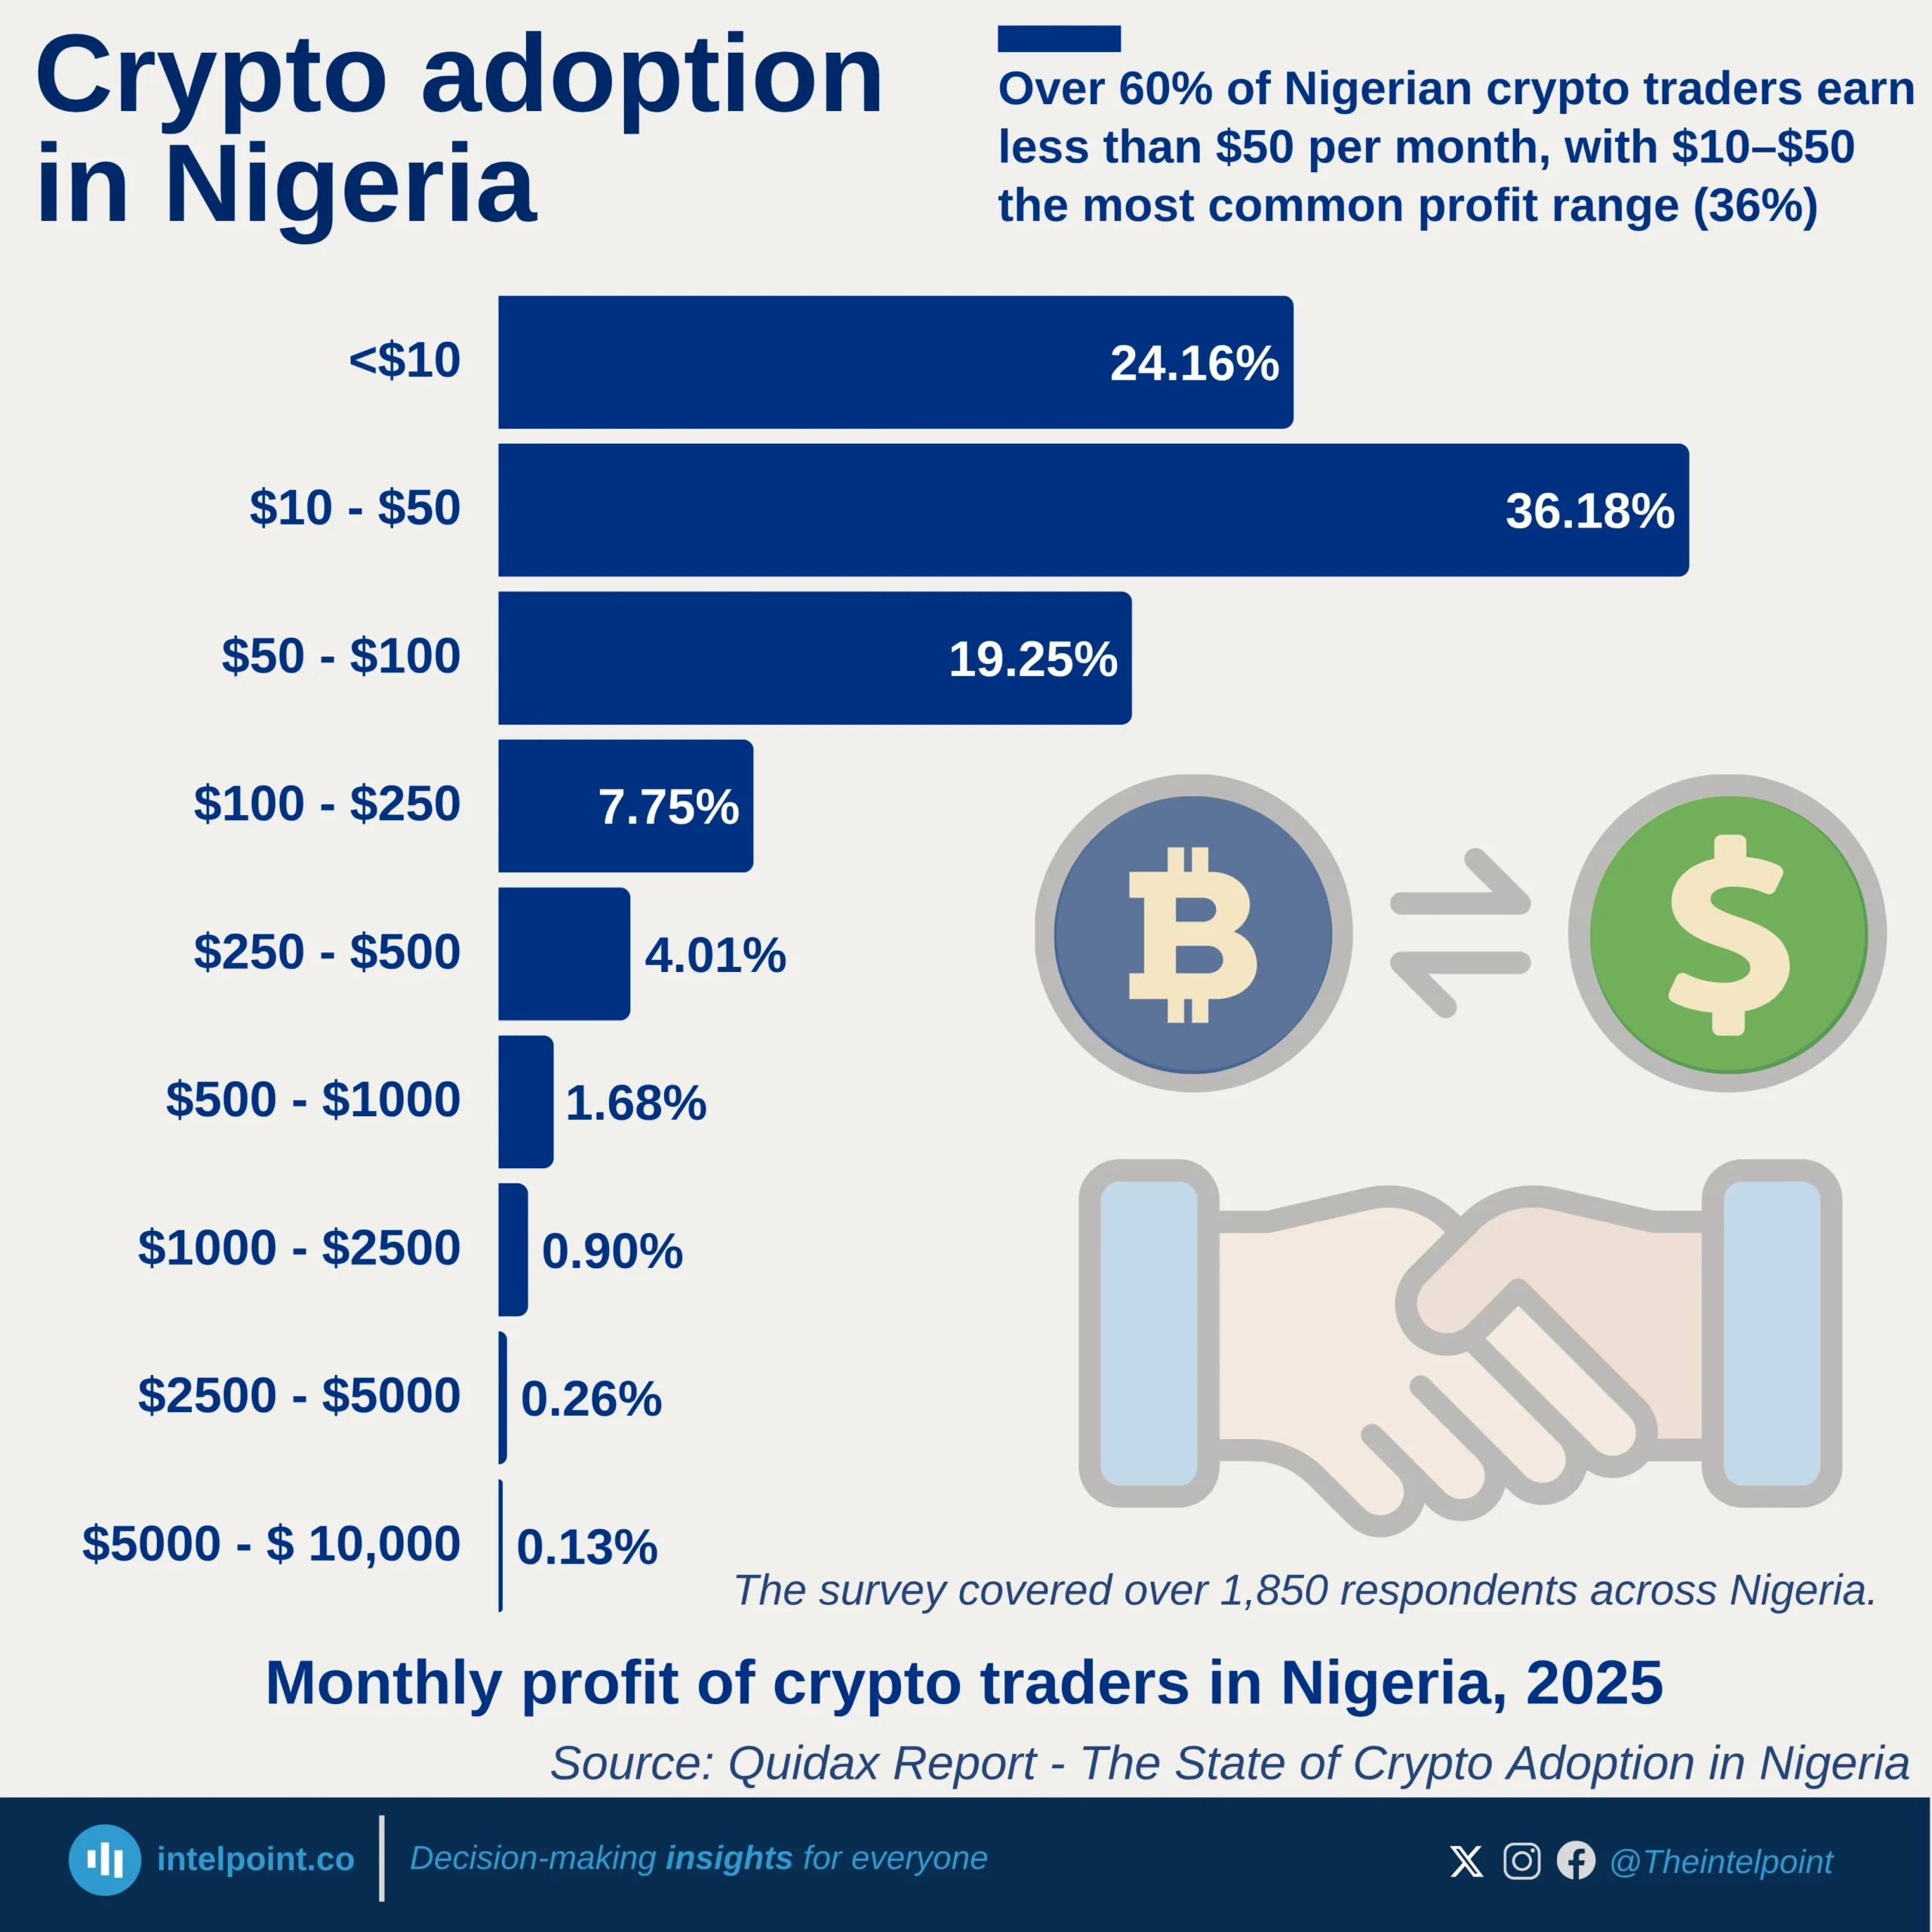
About 60% of users make less than $50 per month, showing crypto activity is mostly at a small, retail scale.
The $10–$50 band (36%) is the single largest group, reflecting frequent, low-value trading or incremental investment returns.
Only about 30% of users earn between $50 and $500, suggesting that consistent moderate returns are less common.
Less than 3% of users earn above $1,000 per month, confirming that the Nigerian crypto market remains largely retail-driven rather than dominated by professional or institutional traders.
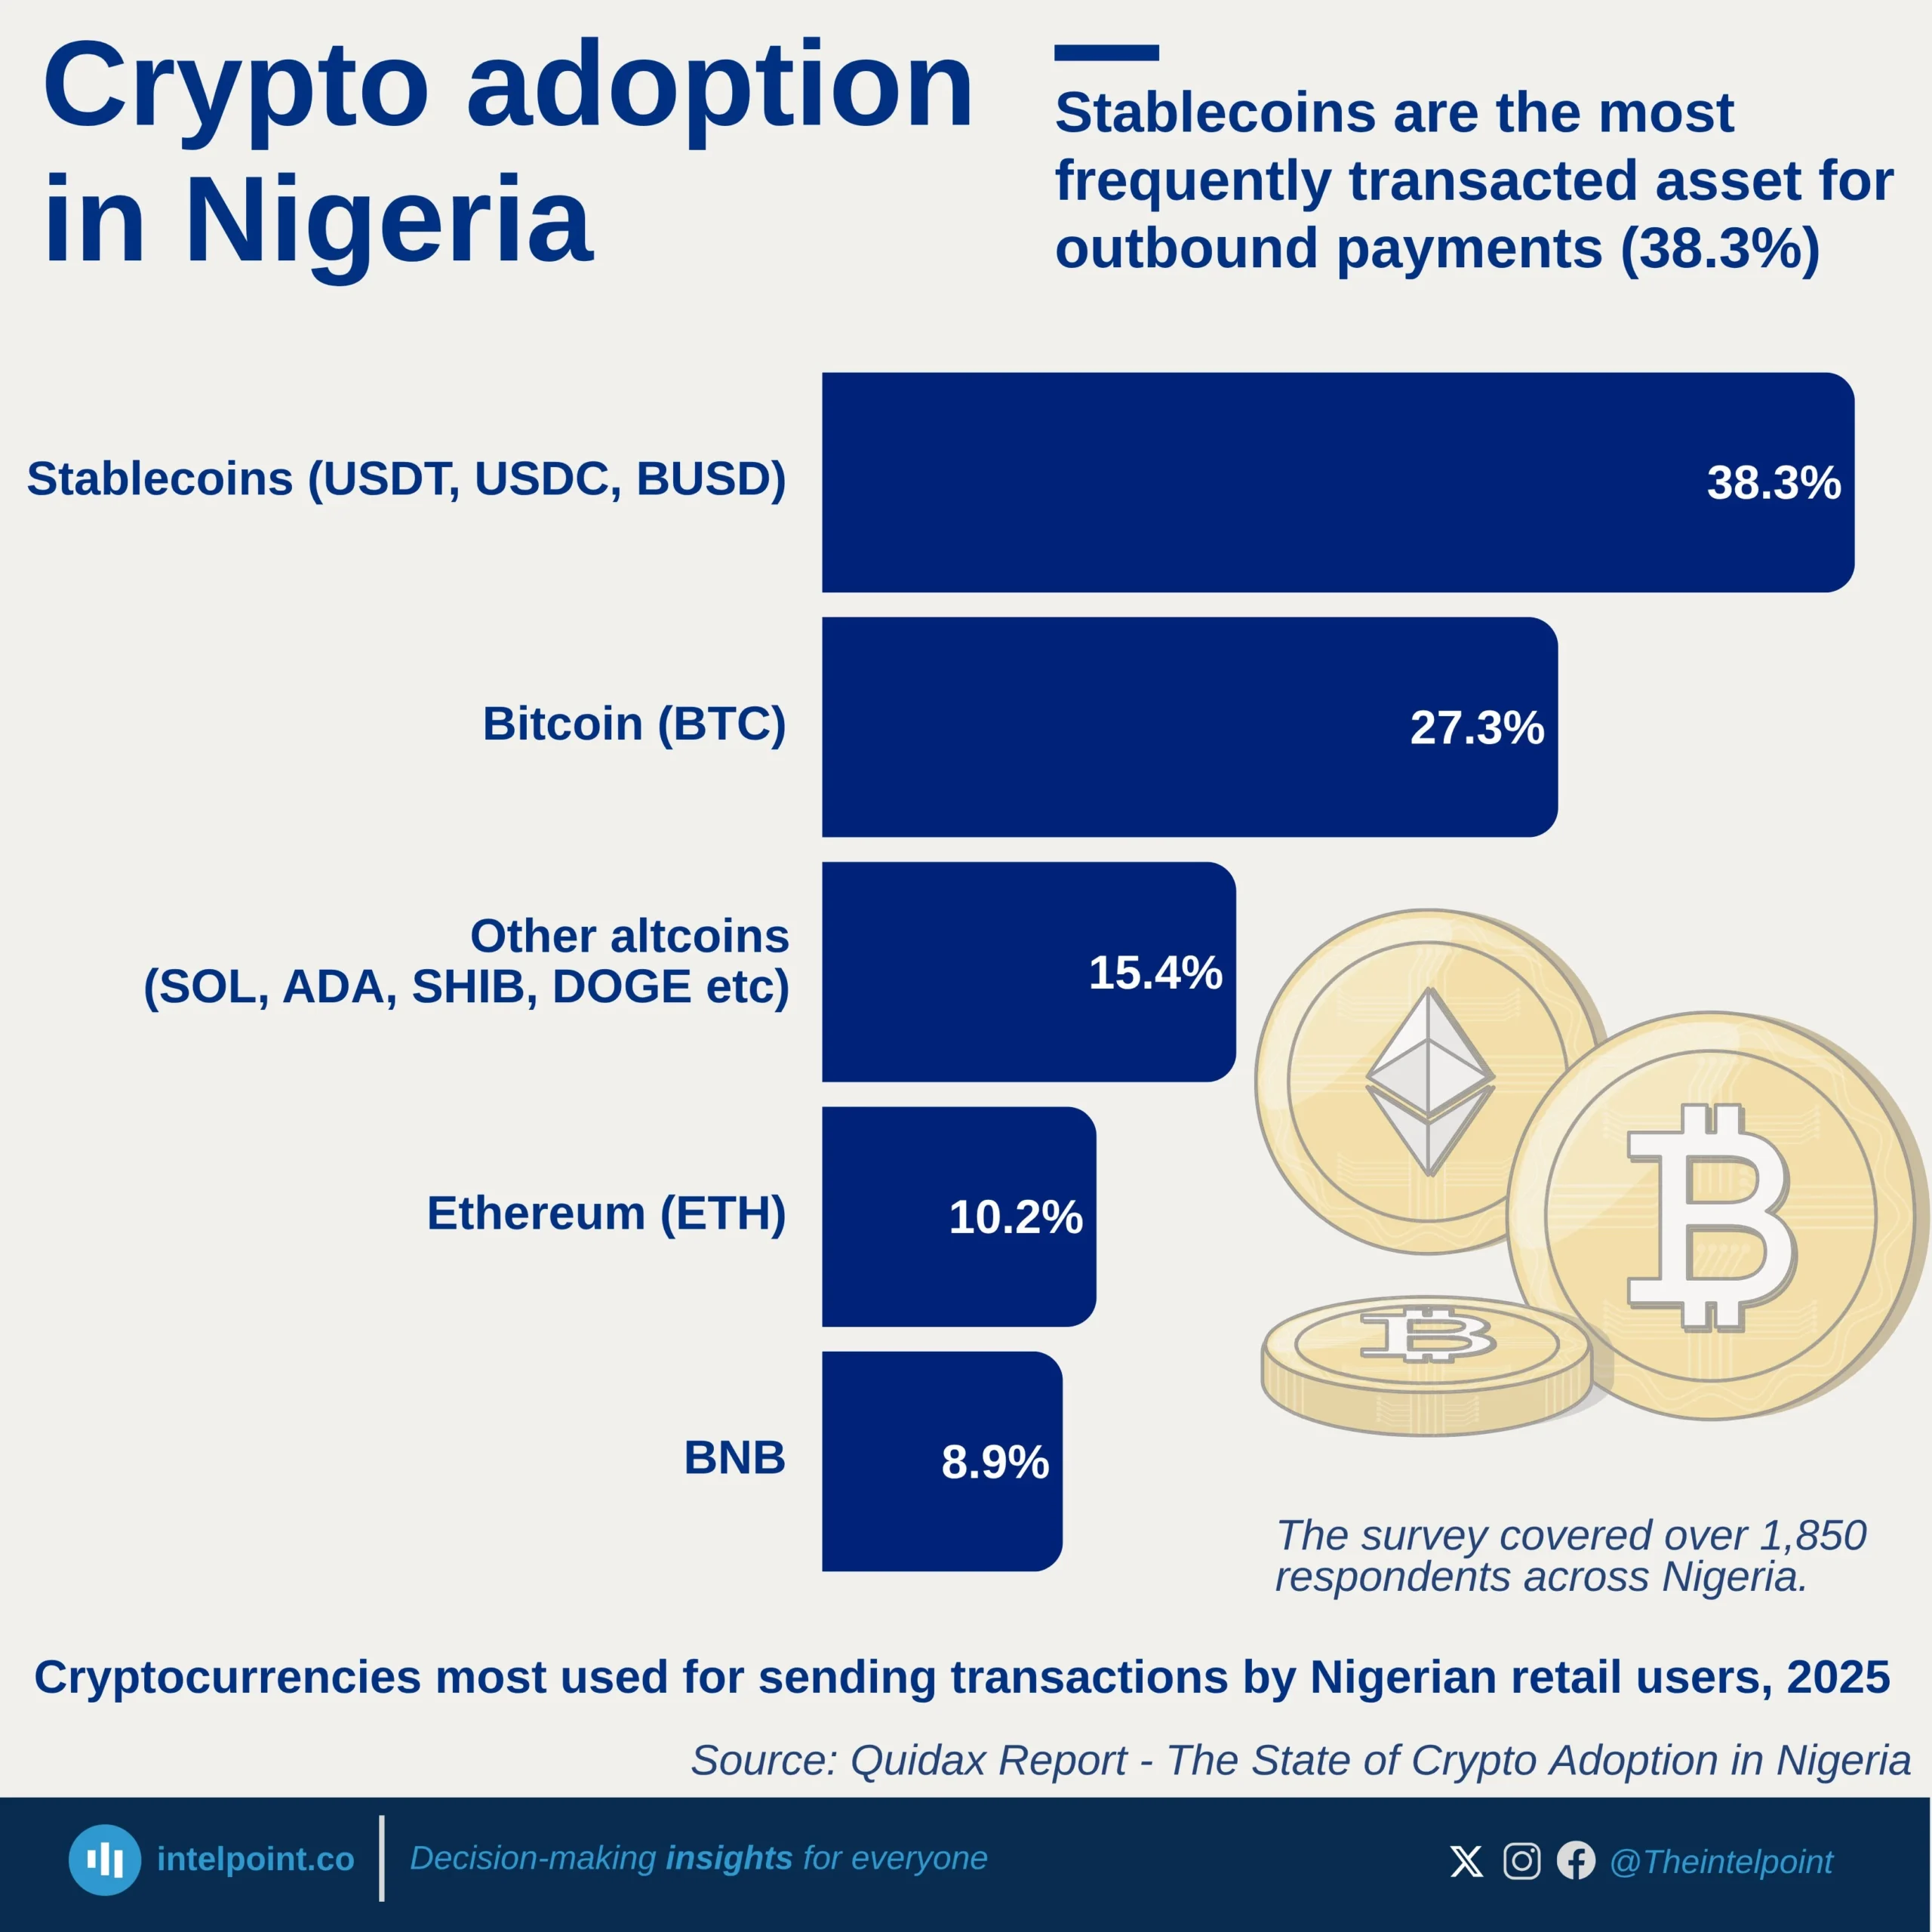
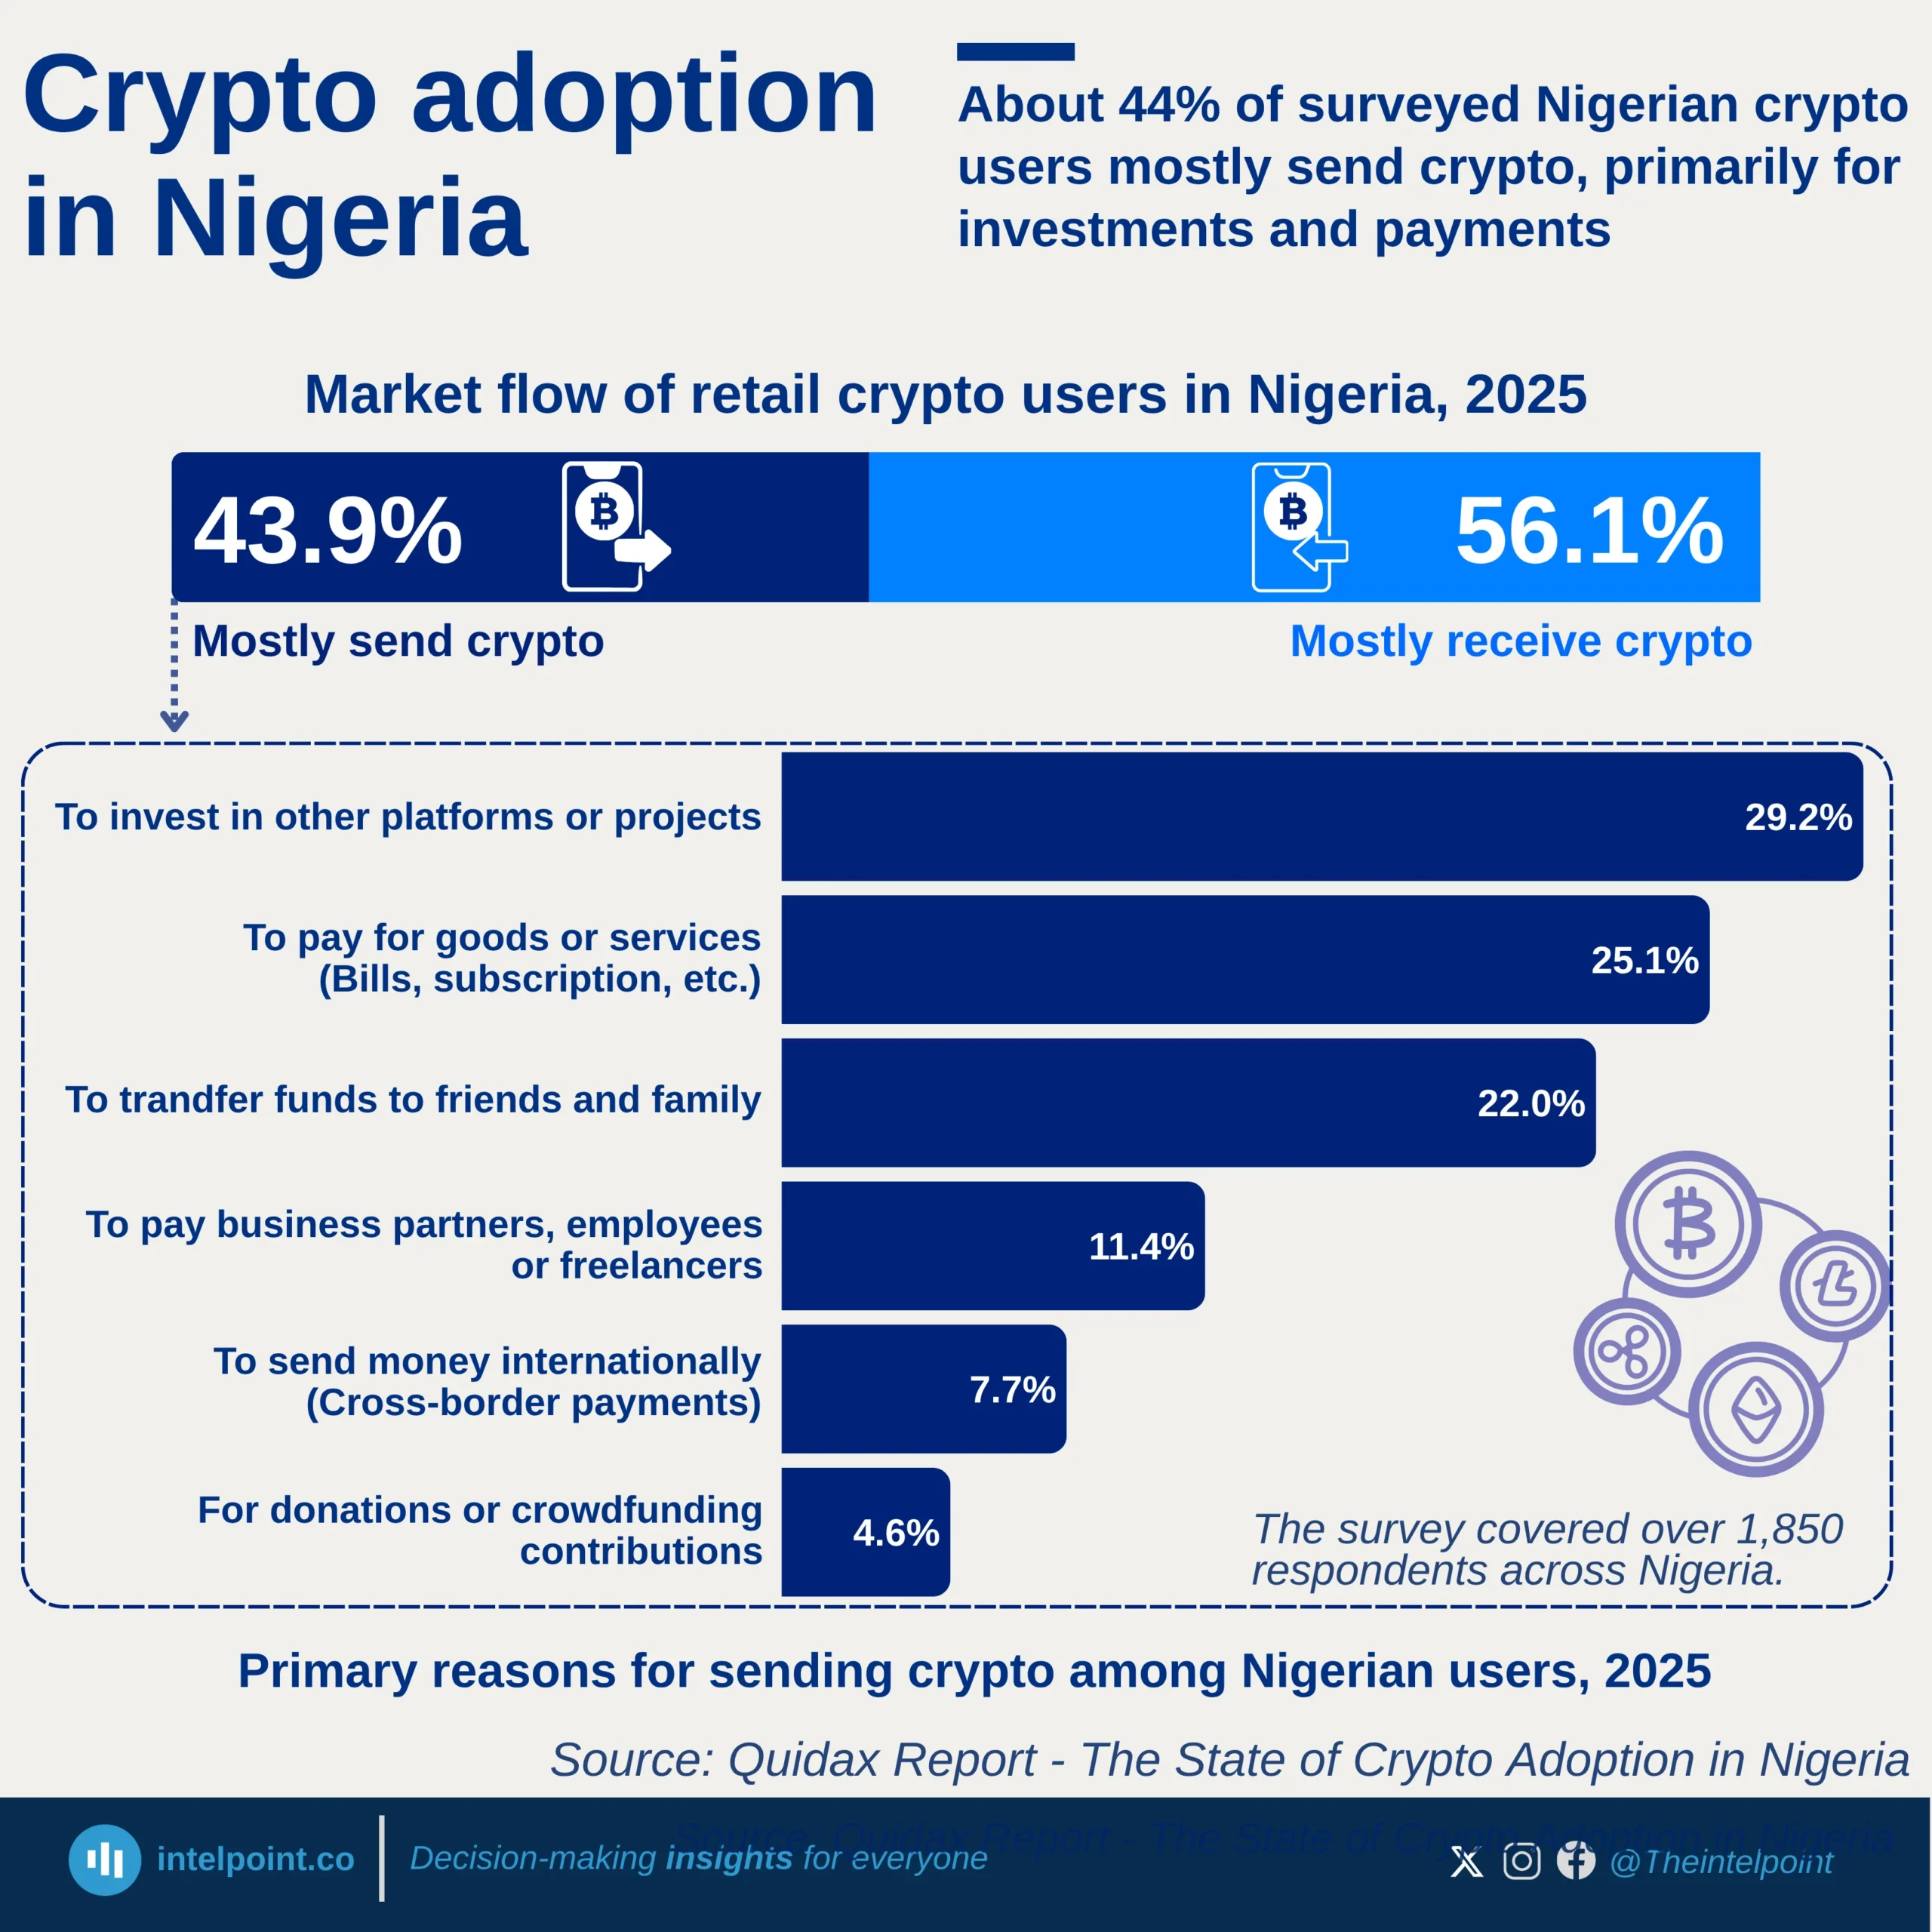
56.1% of users mostly send crypto, compared to 43.9% who mostly receive it, showing an active transaction culture.
Investing in other platforms or projects leads as the top reason for sending crypto (29.2%), indicating strong speculative and wealth-building motives.
Every 1 in 4 users (25.1%) use crypto for daily transactions like bills and subscriptions, showing rising integration into everyday finance.
Cross-border payments (7.7%) and donations (4.6%) remain small but notable niches, signaling growing utility beyond trading.