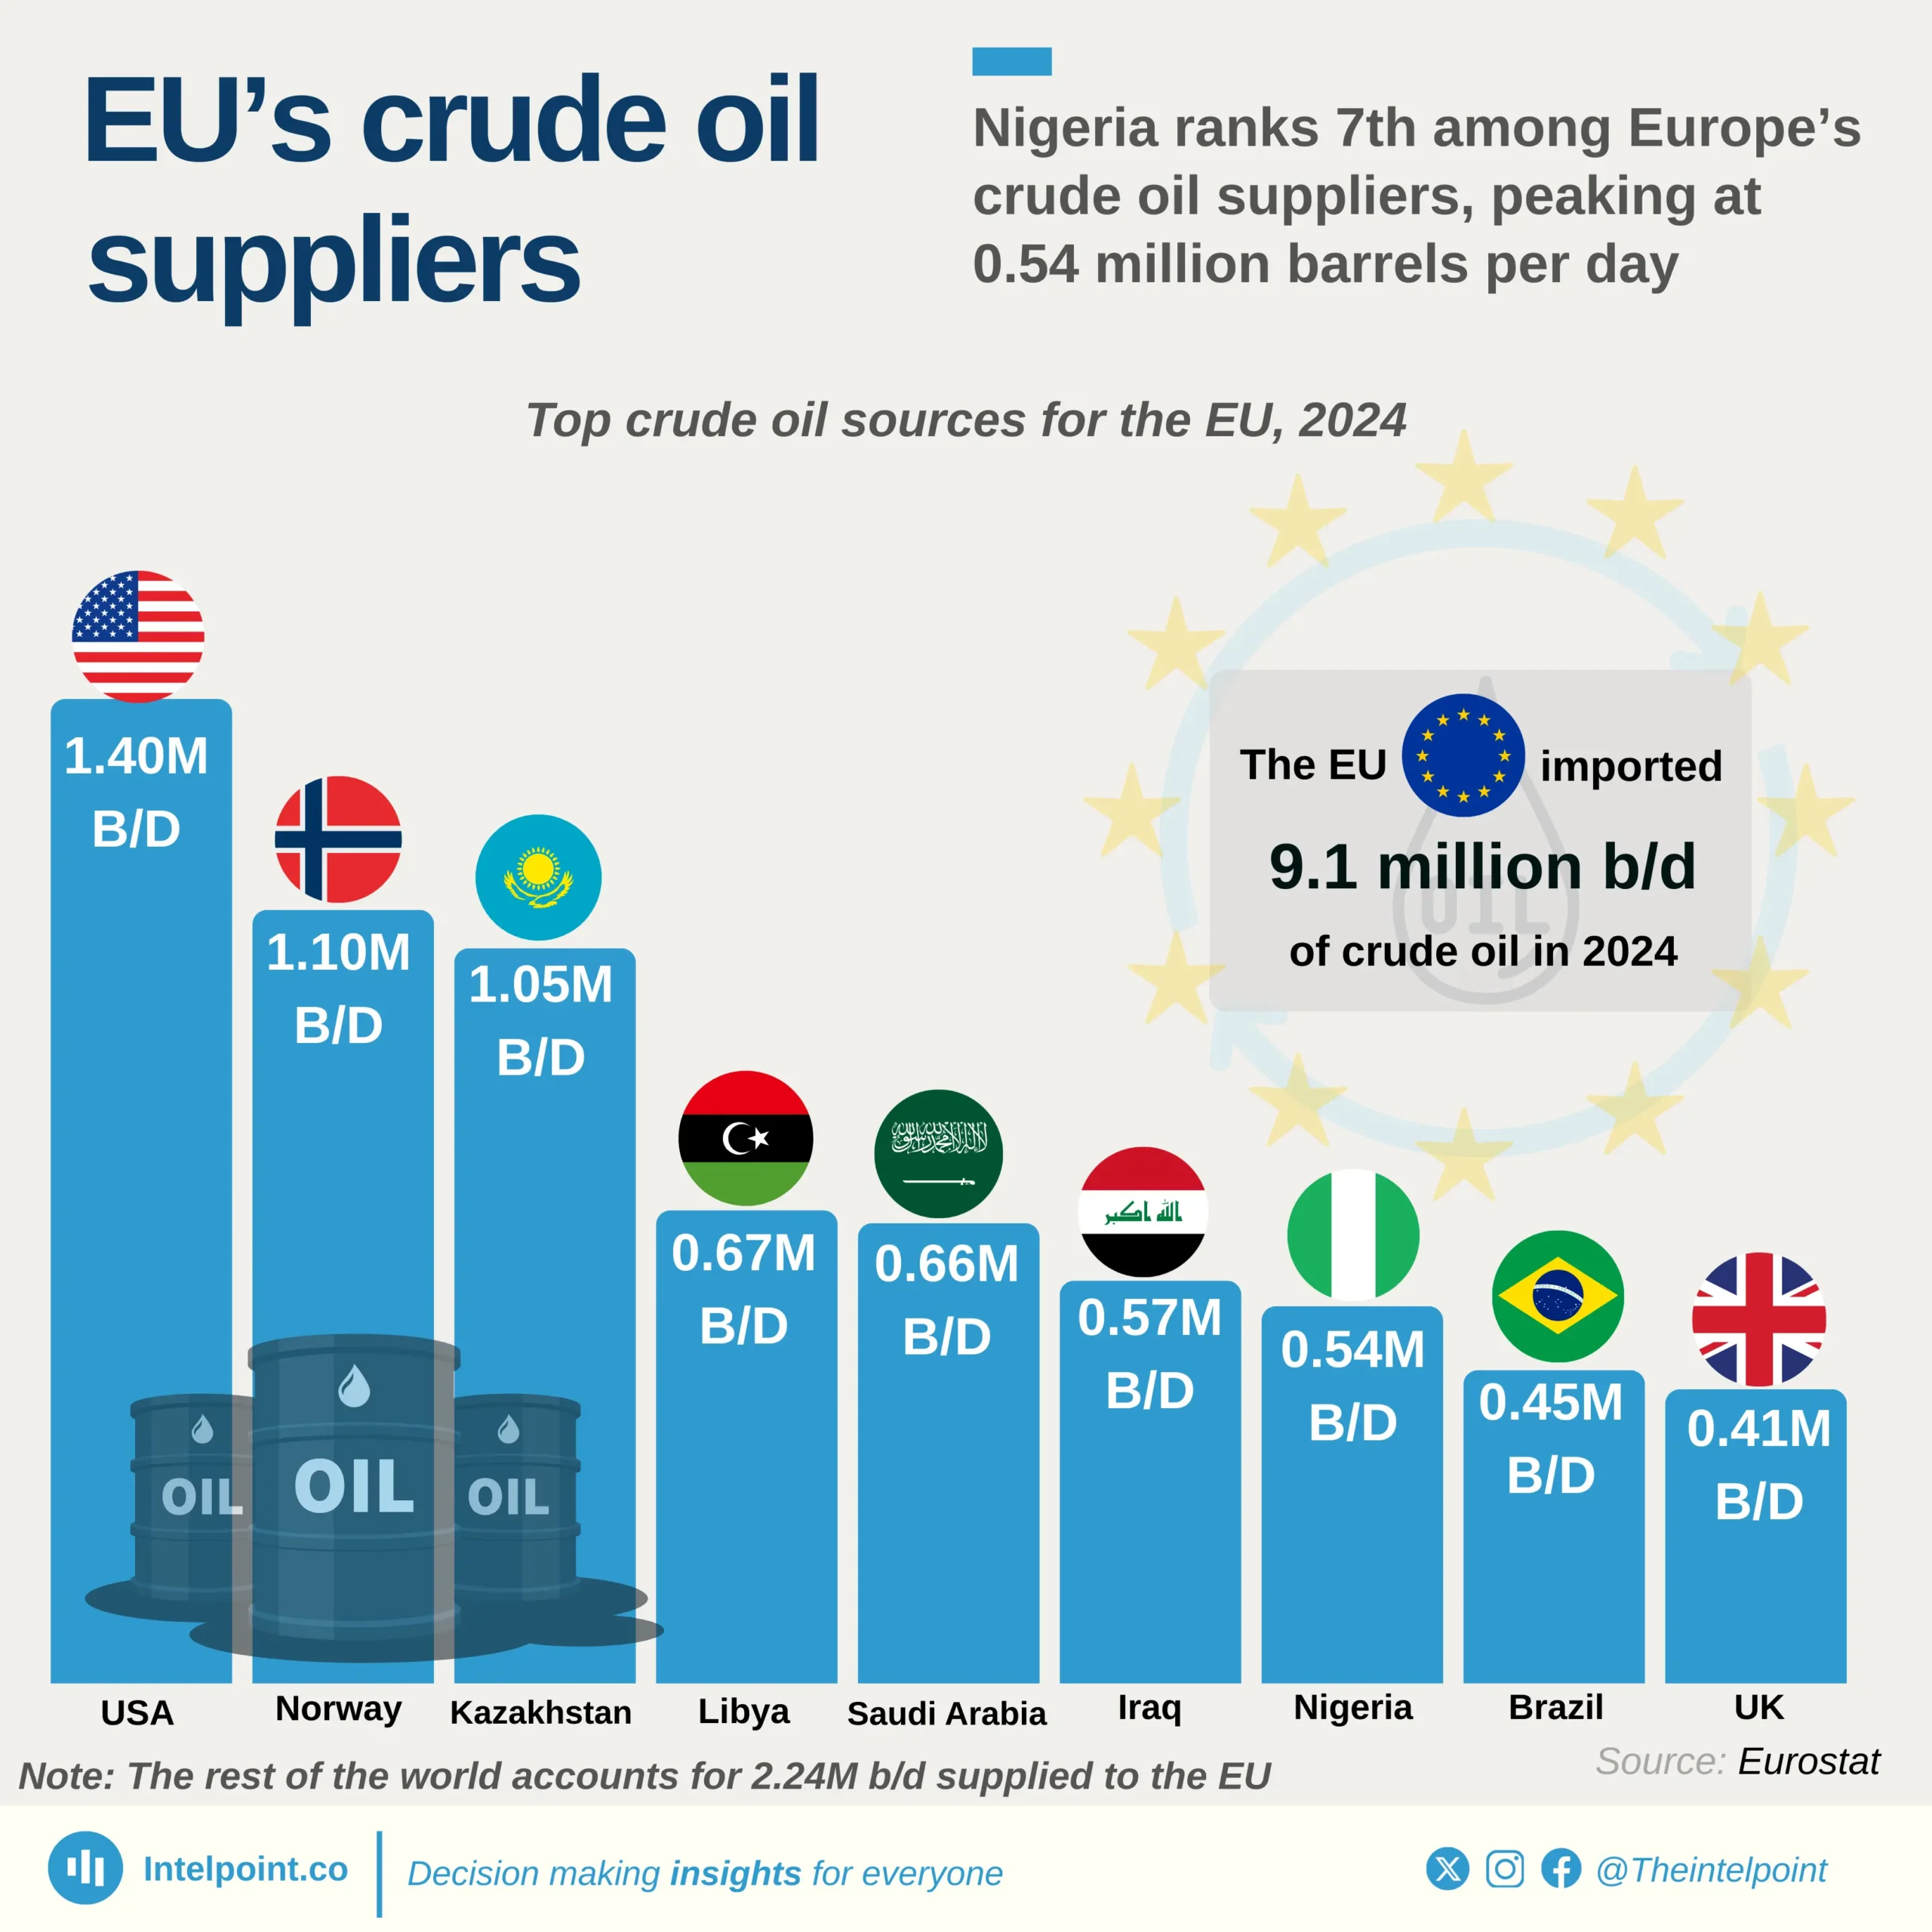
Nigeria ranks 7th among Europe’s crude oil suppliers, peaking at 0.54 million barrels per day

Key takeaways

  • The USA leads the suppliers with 1.40 million barrels/day, making it the largest single contributor to the EU’s crude oil imports in 2024.
  • Norway and Kazakhstan follow closely, delivering 1.10M and 1.05M b/d respectively, together accounting for over 24% of the EU’s total imports.
  • Nigeria ranks 7th, contributing 0.54M b/d, which is 5.9% of total EU crude oil imports, ahead of Brazil and the UK.
  • The top 6 suppliers (USA to Iraq) delivered 5.45 million b/d in total, representing nearly 60% of the EU’s crude oil demand.
  • The rest of the world, not listed among the top 10, contributed 2.24M b/d, underscoring the EU’s diversified sourcing strategy.

In 2024, the EU imported a total of 9.1 million barrels of crude oil per day, drawing heavily from a mix of Western allies and strategic global partners. The United States emerged as the dominant supplier, with 1.40M b/d, highlighting transatlantic energy ties. Norway and Kazakhstan solidified their roles as key regional contributors, combining for over 2.15M b/d and reinforcing Europe’s reliance on politically stable sources.

Nigeria, ranked 7th, supplied 0.54M b/d, affirming its strategic importance as a West African oil hub. Despite not leading, its consistent output places it ahead of major economies like Brazil and the UK. Beyond these top contributors, over 2.24M b/d came from other global sources, proving the EU’s ongoing commitment to supply chain diversity and energy security amidst global volatility.
Source:

Eurostat

Period:

2024
HTML code to embed chart
Want a bespoke report?
Reach out
Tags
Related Insights

World Bank Group and Eurobonds alone account for 74% ($38.37b) of Nigeria's $51.9b external debt
  • Nigeria’s external debt stood at $51.90 billion as of March 2026.
  • External debt increased by just 0.09% from December 2025.
  • Multilateral creditors held the largest share at 46.0%.
  • Commercial creditors accounted for 41.3% of external debt.
  • Bilateral creditors accounted for 12.7% of external debt.
  • The World Bank Group accounted for 38.2% of total external debt.
  • Eurobond holders accounted for 35.7% of total external debt.
  • The World Bank Group and Eurobond holders together accounted for 73.9% of Nigeria’s external debt.
  • Bilateral debt fell by $130 million from December 2025 to March 2026.
  • Commercial external debt increased by about $1.1 billion over the same period.

Personal remittance inflows to Nigeria increased 3.0% year-on-year, from $22.1 billion in 2024 to $22.8 billion in 2025
  • Nigeria received $22.8 billion in personal remittances in 2025; a 3% year-on-year increase
  • Inflows remained 6.3% below the 2018 record of $24.3 billion.
  • Remittances have recovered from the $17.2 billion recorded in 2020.
  • Nigeria’s 2025 remittance inflows were 32.6% higher than in 2020.
  • Remittances accounted for 7.8% of GDP in 2025.
  • Remittances’ share of GDP fell from 8.8% in 2024.
  • Remittances’ share of GDP remained above the 4.0% recorded in 2023.

Egypt received a record $41.5bn in remittances in 2025, 31.7% above the previous record set in 2021
  • Egypt received a record $41.5 billion in remittances in 2025.
  • Remittances increased 40.2% from 2024.
  • The 2025 inflow was 31.7% above the previous record set in 2021.
  • Remittances fell to $19.5 billion in 2023 before rebounding sharply.
  • Remittances more than doubled between 2023 and 2025.
  • Egypt received about $497.9 billion in remittances from 1980 to 2025.
  • The March 2024 FX reforms preceded the sharp recovery in remittance inflows.
  • 2025 marked the highest annual remittance inflow in the series.

Egypt's manufacturing output has moved further ahead of Nigeria's and South Africa's
  • Egypt’s manufacturing value added reached $64.4 billion in 2025.
  • Egypt’s manufacturing value added increased 87% since 2002.
  • Nigeria’s manufacturing value added peaked at $47.2 billion in 2014.
  • Nigeria’s 2025 manufacturing value added was $43.6 billion, below its 2014 peak.
  • Nigeria was just $3.1 billion behind South Africa in 2025.
  • South Africa’s manufacturing value added peaked at $44.2 billion in 2018.
  • South Africa’s manufacturing value added fell to $40.5 billion in 2025.
  • Egypt recorded $20.8 billion more manufacturing value than Nigeria in 2025.

Debt service accounts for 23.14% of Nigeria’s ₦68.32 trillion 2026 appropriation
  • Debt service takes 23.14% of Nigeria’s 2026 budget.
  • Domestic debt service accounts for 64.3% of the debt-service allocation.
  • Domestic debt service is nearly twice the external debt-service allocation.
  • The sinking fund receives just 1.8% of the debt-service allocation.
  • Domestic debt service is more than 35 times the sinking-fund allocation.
  • Debt service totals ₦15.81 trillion in the 2026 budget.

Nigerian states with the largest increase in FAAC allocations
  • Nigeria's 36 states received a combined ₦4.14 trillion in FAAC allocations in Jan-May 2026, up ₦735.4 billion (21.6%) from a year earlier.
  • Thirty-five states received higher allocations than a year earlier, while Rivers was the only state to record a decline (₦7.15 billion).
  • Lagos recorded the largest increase in FAAC allocations (₦119.5 billion), more than three times the increase recorded by Oyo (₦38.3 billion).
  • Oyo, Kano, Borno, and Jigawa rounded out the top five states with the largest increases in FAAC allocations.

POPULAR TOPICS
SIGN UP TO OUR NEWSLETTER
Get periodic updates about the African startup space, access to our reports, among others.
Subscribe Here
Subscription Form

A product of Techpoint Africa. All rights reserved