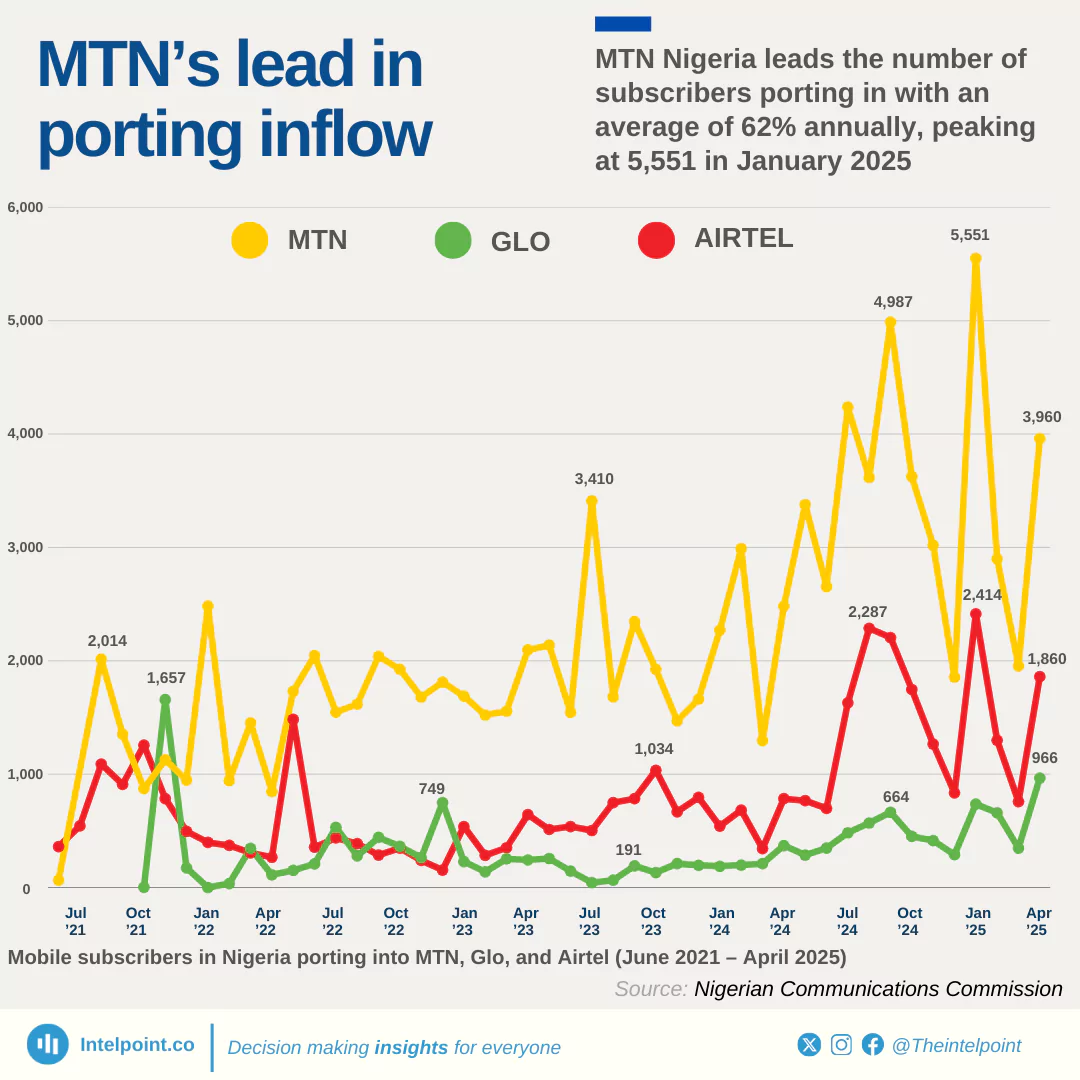
MTN Nigeria leads the number of subscribers porting in with an average of 62% annually, peaking at 5,551 in January 2025

Key takeaways:

  • MTN continuously received the most ported-in subscribers, particularly from 2023 to 2025.
  • MTN ported-in subscribers increased from 616 in June 2021 to 5,551 in January 2025.
  • Airtel subscribers from other networks expanded from 360 to 2,414 port-ins (567%) throughout the same period.
  • Airtel experienced significant growth in August-September 2024 and January 2025, with over 2,000 port-ins monthly.
  • Globacom's performance remained low, with fewer than 1,000 port-ins throughout the period.
  • The high number of subscribers switching to MTN indicates a stronger customer preference for MTN, most likely owing to perceived quality or promotional incentives.

MTN Nigeria led in subscriber port-in traffic between June 2021 and April 2025, attracting most mobile users who switched from other networks. The rising trend began initially but picked up dramatically around mid-2023, most likely due to network upgrades, pricing schemes, or dissatisfaction with competing providers.

Airtel experienced incredible growth, particularly since mid-2024. From 698 users in June 2024, the number rose to 2,414 by January 2025. This growth moved Airtel closer to MTN's inflow levels, indicating successful competitive strategies, service advancements, customer engagement, or market campaigns.

The lowest port-in activity during the entire period was reported by Globacom, indicating a lack of traction among users switching networks. Even its biggest monthly results were modest compared to MTN and Airtel's peaks.
Source:

Nigerian Communications Commission

Period:

June 2021 – April 2025
HTML code to embed chart
Want a bespoke report?
Reach out
Tags
Related Insights

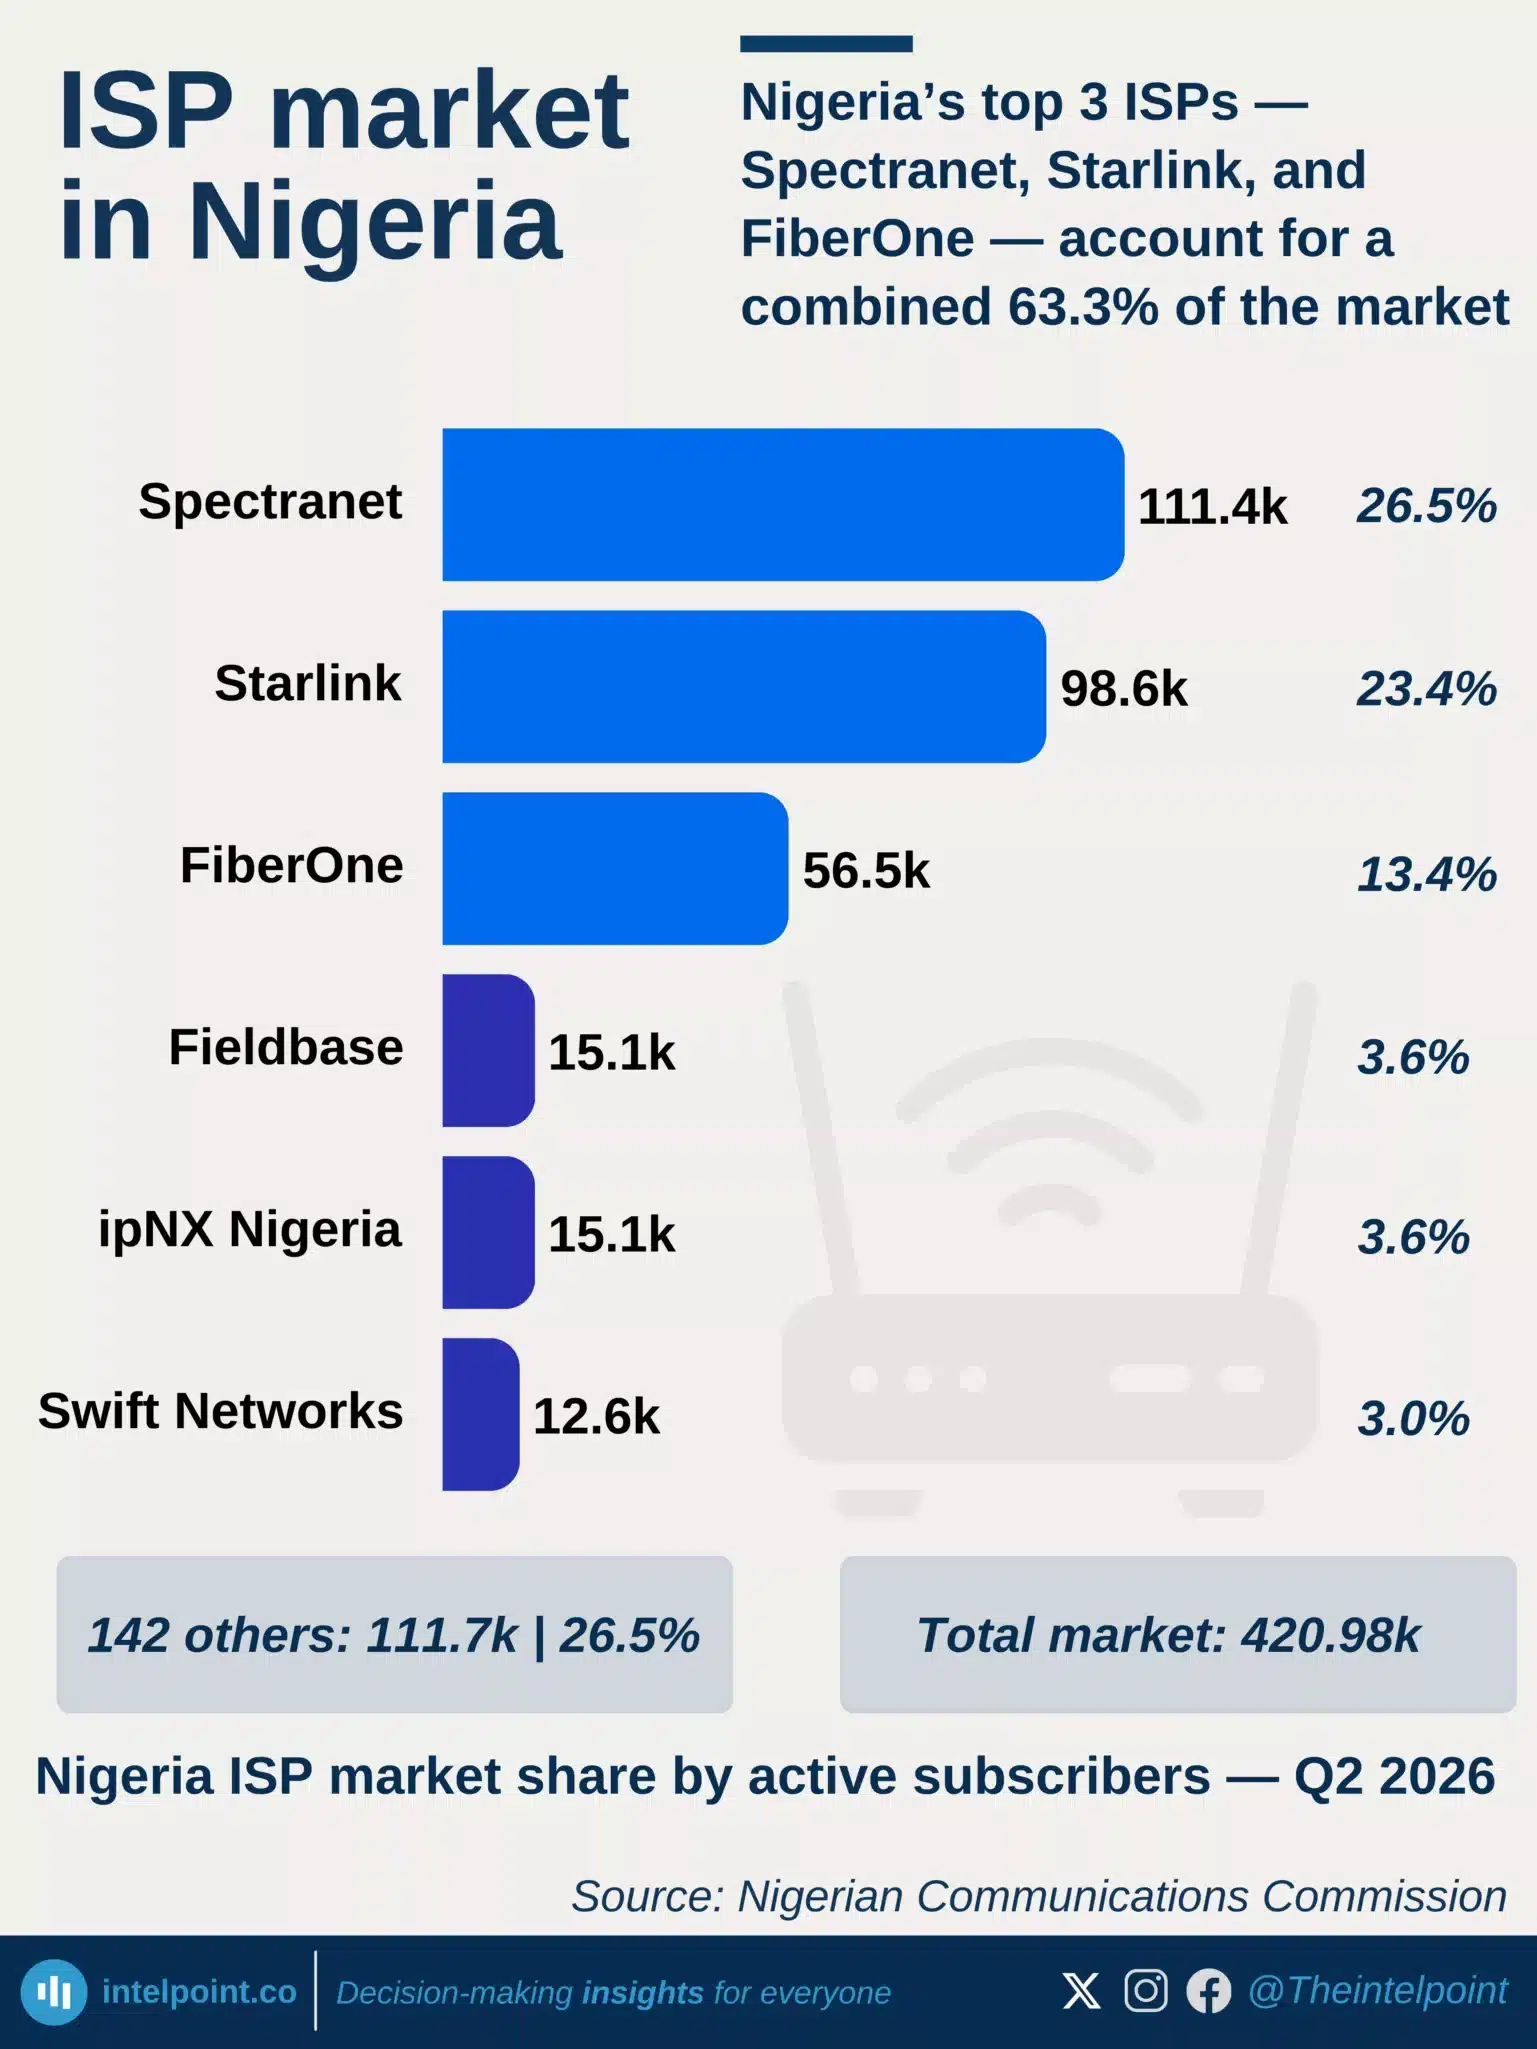
Nigeria’s top 3 ISPs — Spectranet, Starlink, and FiberOne — account for a combined 63.3% of the market
  • Spectranet leads with 111,384 subscribers, ahead of Starlink's 98,642.
  • Starlink added 6,651 subscribers since December 2025, narrowing the gap to 12,742.
  • Fieldbase Services overtook ipNX for 4th place by just 18 subscribers.
  • The top three ISPs account for over 63% of Nigeria's 420,989 active subscribers.

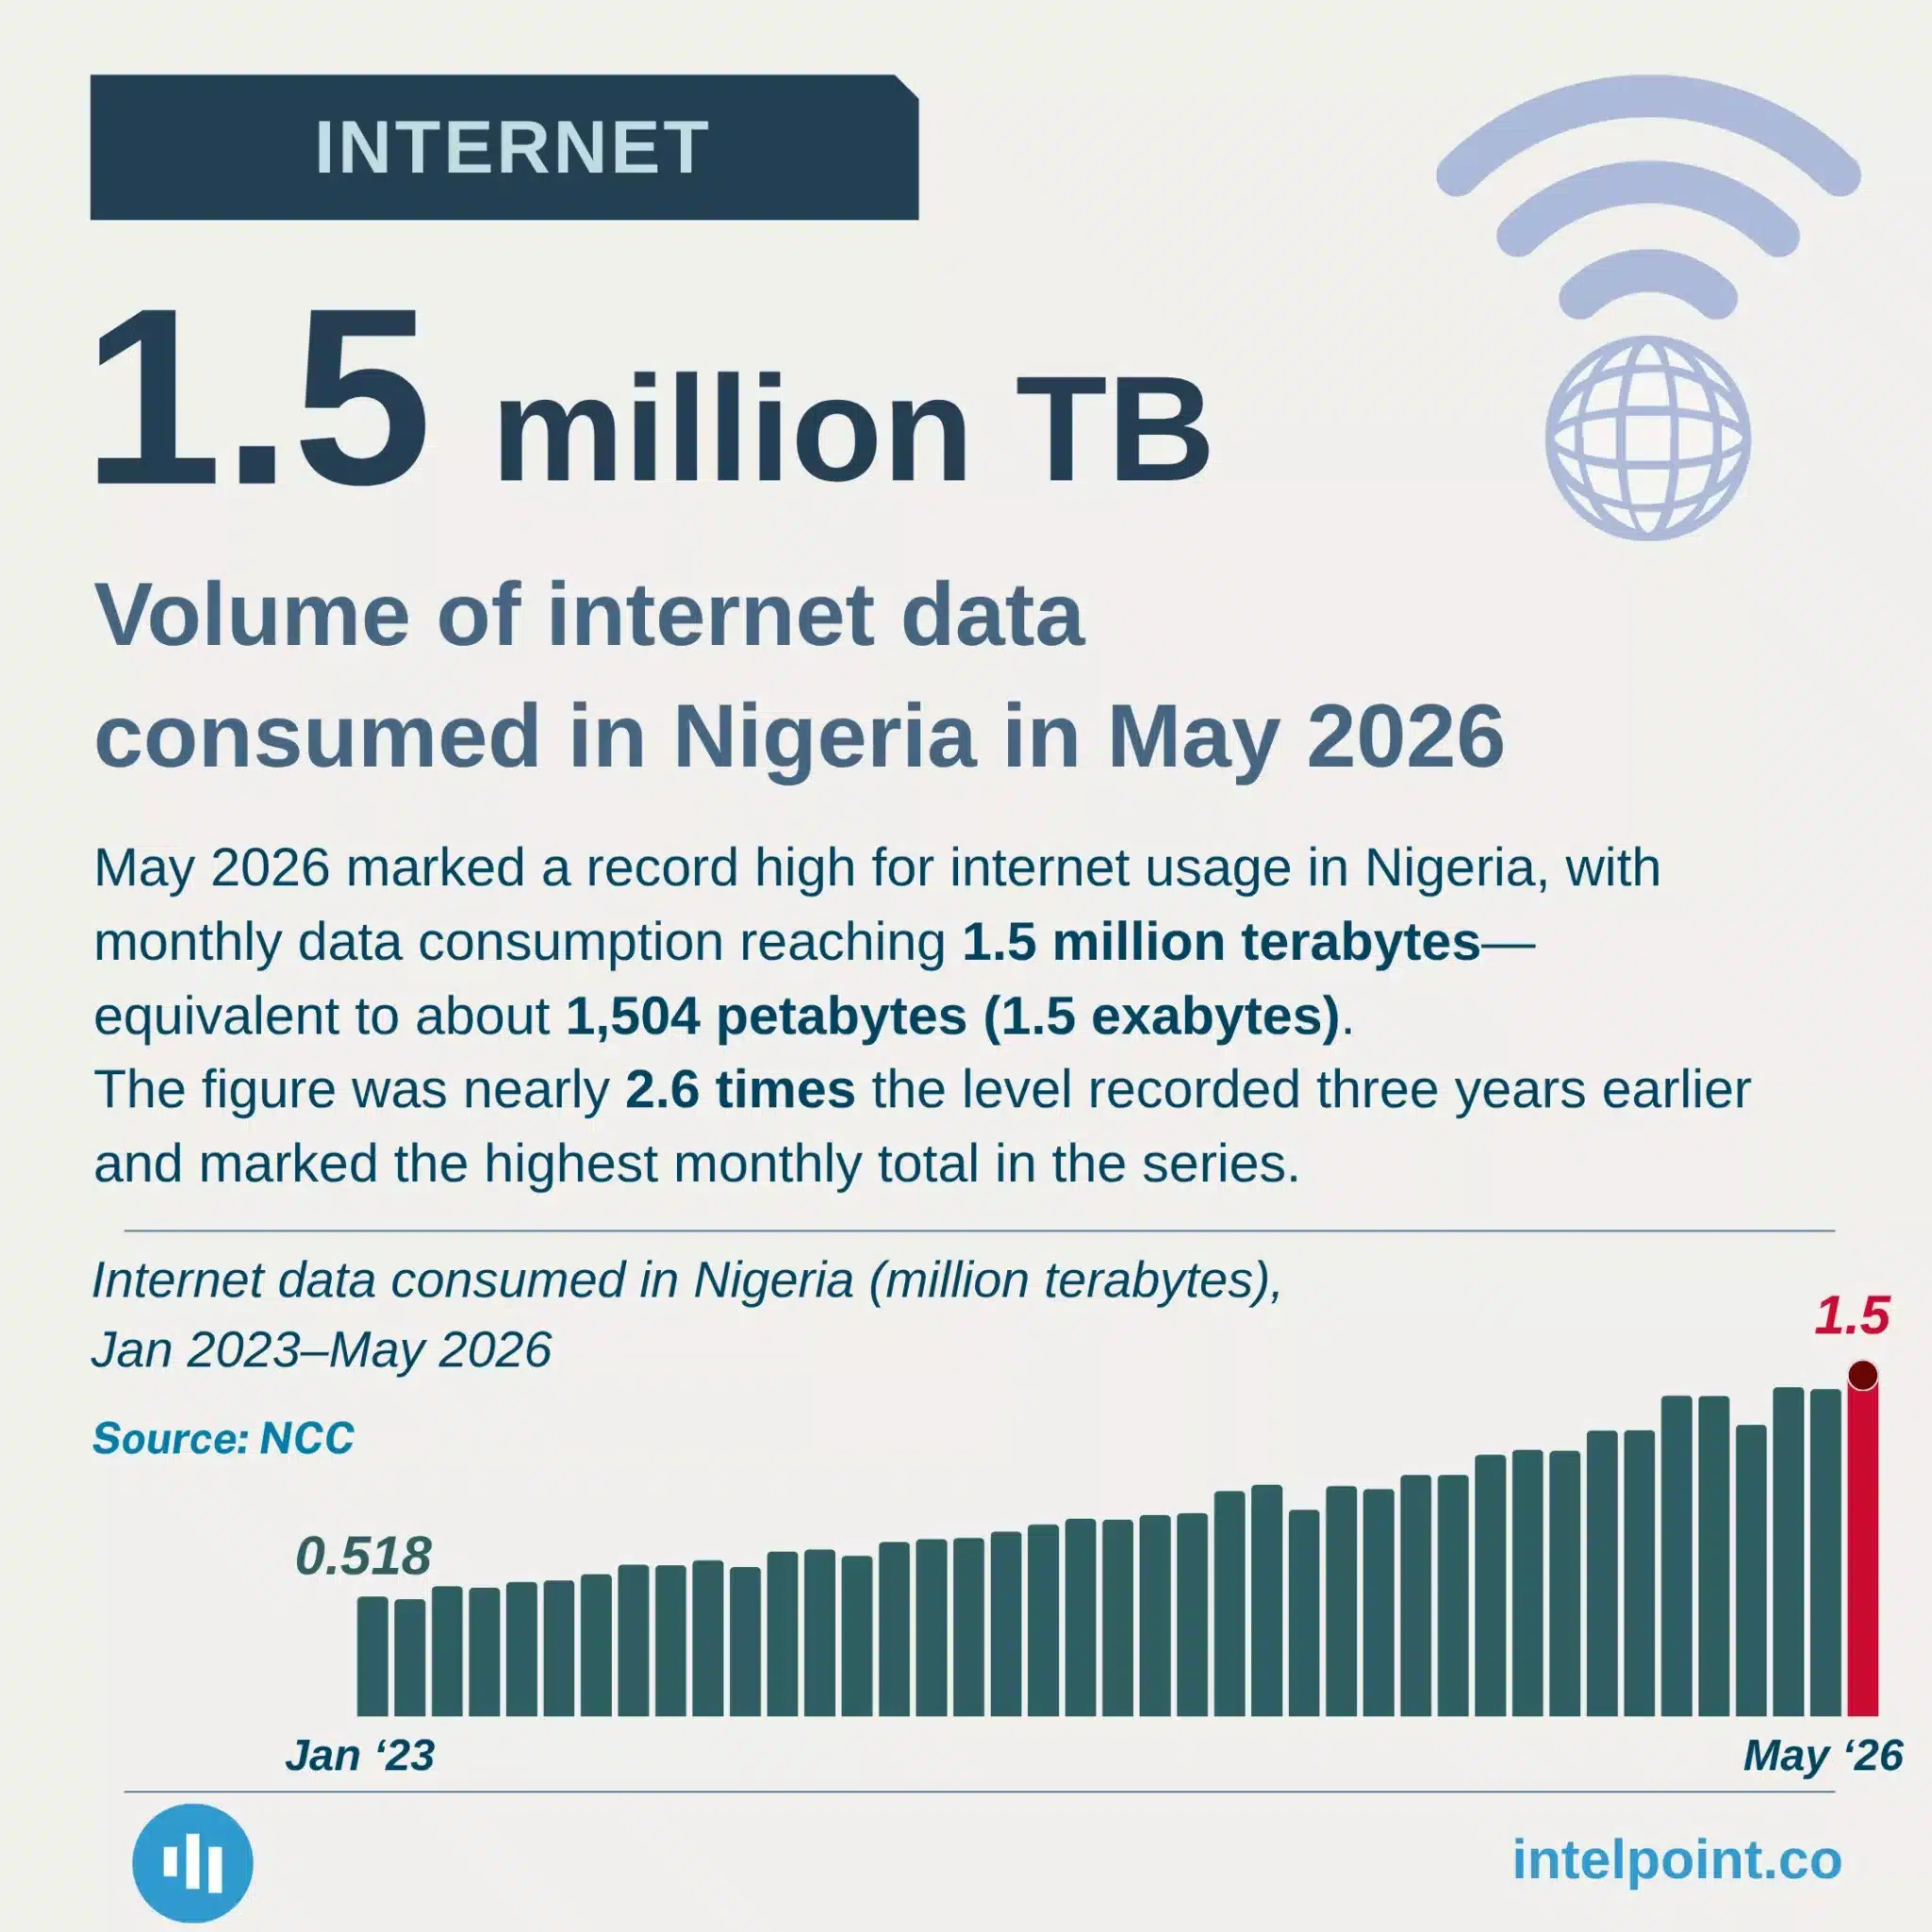
Volume of internet data consumed in Nigeria in May 2026
  • 1.5 million TB was consumed in May 2026, the highest monthly level on record.
  • 7 million TB was consumed in Jan–May 2026, up 42.1% from the same period in 2025.
  • Jan–May 2026 usage was 88.4% higher than in 2024 and 156.3% higher than in 2023.
  • May’s monthly usage was nearly 2.6× the level recorded three years earlier.
  • The surge points to rapidly growing demand for internet-based services, content and digital activity in Nigeria.

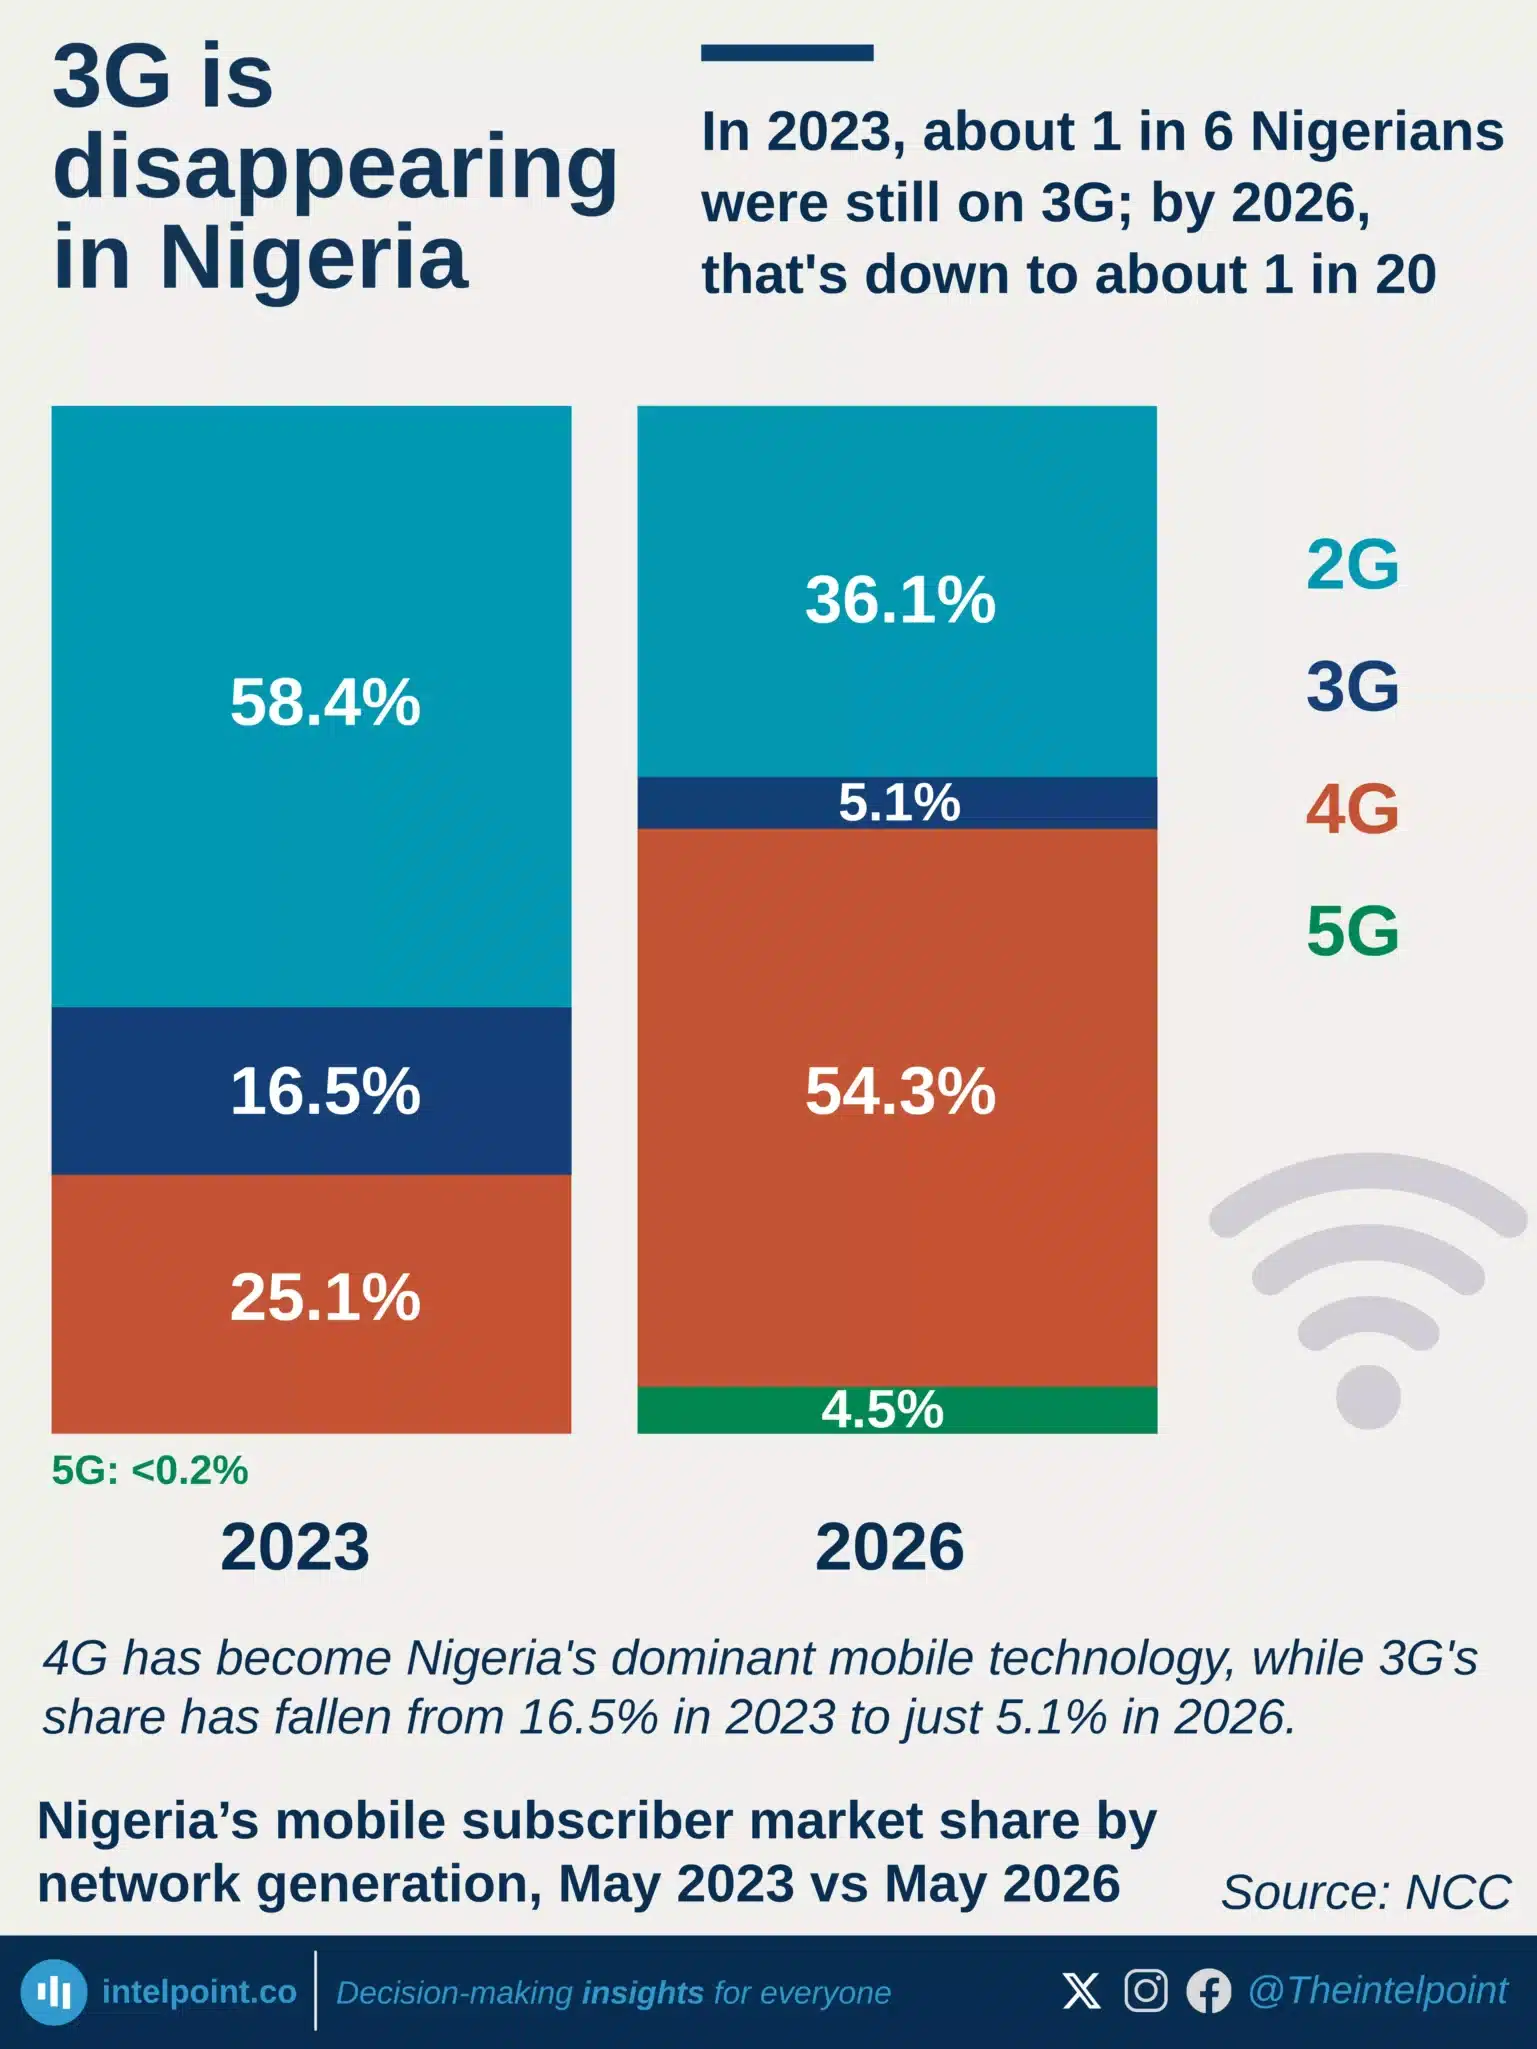
In 2023, about 1 in 6 Nigerians were still on 3G; by 2026, that's down to about 1 in 20
  • 3G's share of Nigeria's mobile market fell from 16.5% to 5.1% between May 2023 and May 2026.
  • 4G became the dominant network, with its market share rising from 25.1% to 54.3% over the same period.
  • 2G's share declined from 58.4% to 36.1% but still accounted for more than one-third of all mobile connections.
  • 5G expanded nearly 37-fold, growing from less than 0.1% to 4.5% of mobile subscriptions.

Nearly 2 in 3 active mobile lines in Ekiti are on MTN
  • MTN held more than half of active mobile lines in most Nigerian states as of December 2025.
  • Ekiti recorded MTN’s highest share at 69.6%, followed by Imo at 64.1% and Anambra at 63.4%.
  • Borno was Airtel’s only leading state, with 56.9% of active mobile lines.
  • Globacom did not lead any state, but it had notable shares in Kogi, Edo, Ondo, FCT, and Oyo.

MTN accounts for over half of internet subscriptions in most Nigerian states
  • MTN held over 50% of active internet subscriptions in most Nigerian states as of December 2025.
  • Ekiti had MTN’s highest share at 70.6%, followed by Imo at 64% and Anambra at 63.7%.
  • Borno was the only state where Airtel led, with 56.6% of active internet subscriptions.
  • Globacom did not lead any state, but it had notable shares in Edo, Kogi, Ondo, Oyo, and Bayelsa.
 

iPhone usage in Africa is just 15%, far below North America’s 60% usage
  • North America leads globally with 60.2% iPhone usage, making it the largest iPhone market.
  • Oceania follows at 58.9%, showing similar consumer preferences to North America.
  • Africa has the lowest iPhone share (14.7%), highlighting a significant adoption gap.
  • Nigeria aligns with the continental trend at 14.1%, reinforcing that the gap is structural, not country-specific.

POPULAR TOPICS
SIGN UP TO OUR NEWSLETTER
Get periodic updates about the African startup space, access to our reports, among others.
Subscribe Here
Subscription Form

A product of Techpoint Africa. All rights reserved