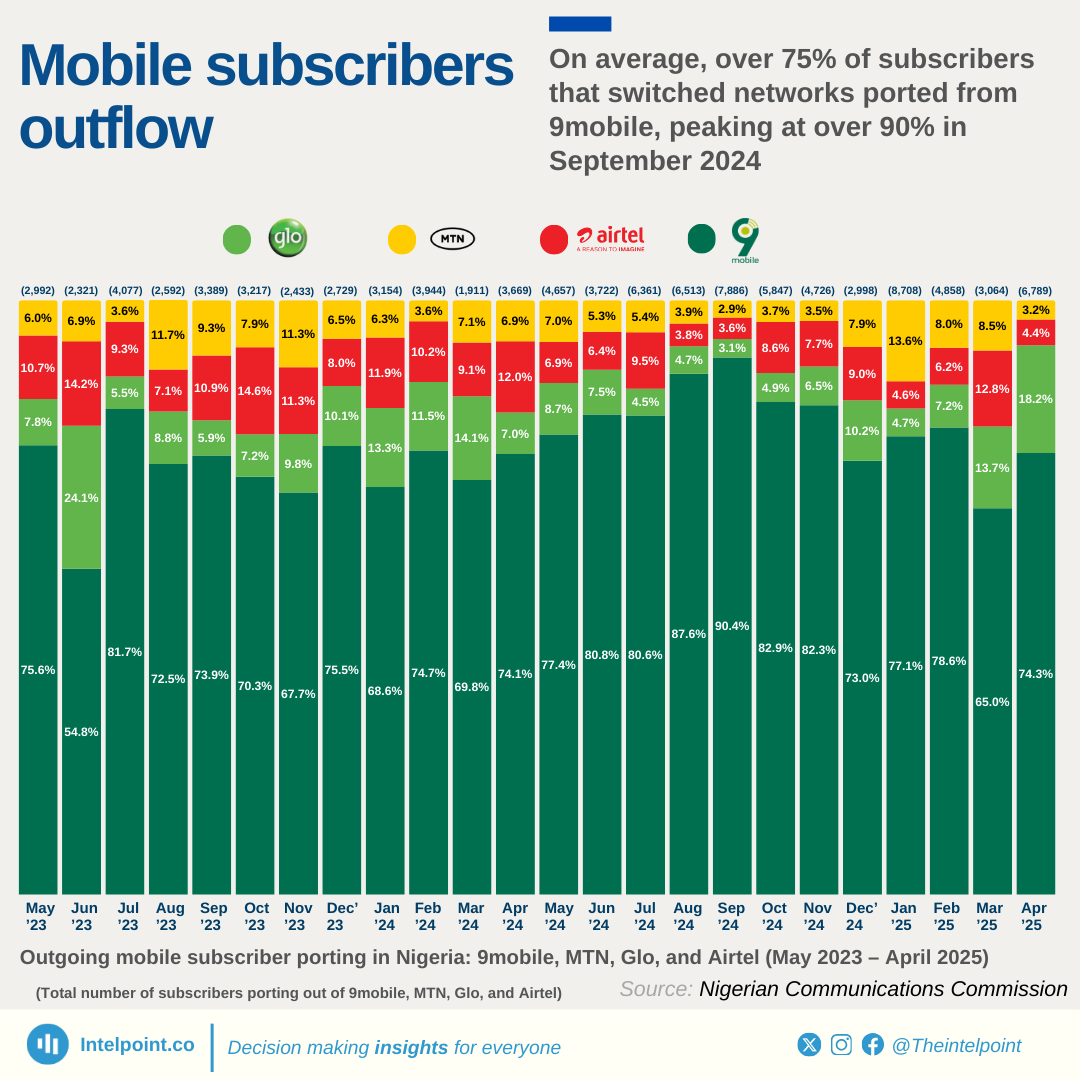
On average, over 75% of subscribers that switched networks ported from 9mobile, peaking at over 90% in September 2024

Key Takeaways:

  • 9mobile consistently tops the port-out chart, averaging over 75% of all outgoing ports over 24 months.
  • The highest subscriber loss from 9mobile occurred in September 2024, with 90.38% of all ports.
  • Airtel and Globacom show relatively stable port-out shares, rarely crossing 15%, with occasional surges. MTN has the lowest overall port-out rates, peaking at 13.64% in January 2025.
  • Total port-outs to other service providers surged by 127%, from 2,992 in May 2023 to 6,789 in April 2025.
  • The highest port transfer to another provider occurred in September 2024, with 7,886 total departures, and 9mobile recording 7,127 losses (90.38%).
  • Globacom’s outflow increased sharply from the July 2023 low, reaching 18.16% in April 2025.
  • Airtel maintained relatively low but fluctuating port-out rates, hitting its highest at 14.61% in October 2023.

Between May 2023 and April 2025, 9mobile consistently recorded the highest share of customer exits, often accounting for 70% to 90% of total monthly port-outs. This persistent trend suggests ongoing customer dissatisfaction or competitive disadvantages.

Airtel and Globacom maintained modest port-out rates, while MTN displayed strong customer retention. MTN's port-out rates were mostly below 8%, except for a notable jump to 13.64% in January 2025. Globacom reported its highest customer loss rate of 24.1% in June 2023, while Airtel's highest loss share was in October 2023 at 14.6%.
Source:

Nigerian Communications Commission

Period:

May 2023 - April 2025
HTML code to embed chart
Want a bespoke report?
Reach out
Tags
Related Insights

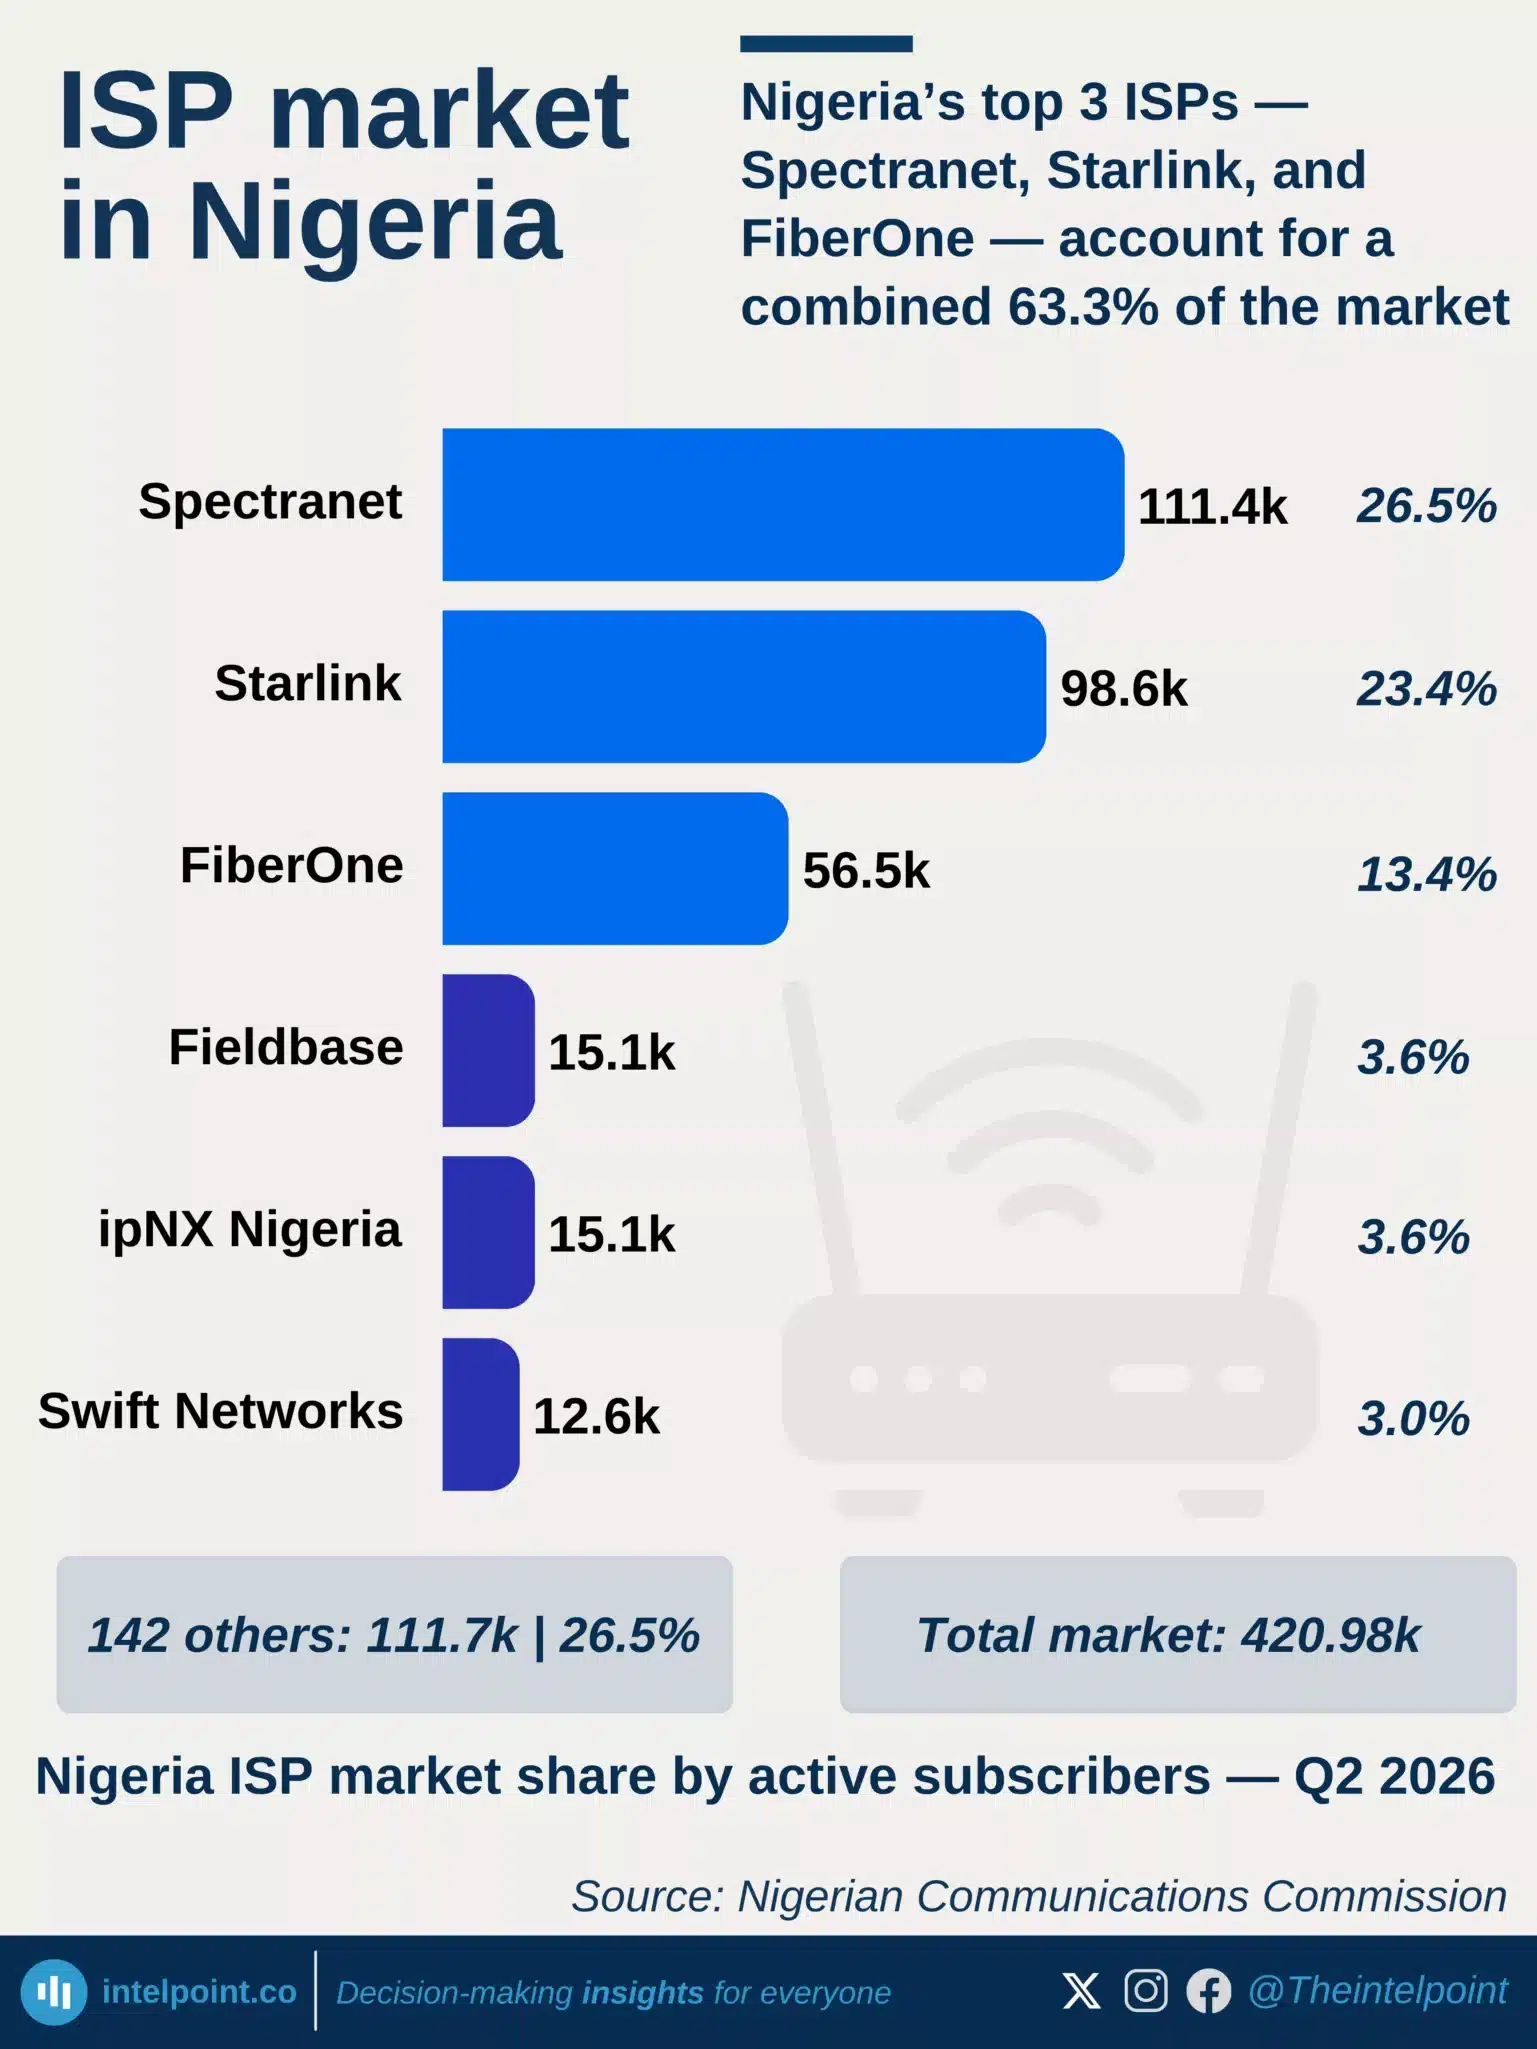
Nigeria’s top 3 ISPs — Spectranet, Starlink, and FiberOne — account for a combined 63.3% of the market
  • Spectranet leads with 111,384 subscribers, ahead of Starlink's 98,642.
  • Starlink added 6,651 subscribers since December 2025, narrowing the gap to 12,742.
  • Fieldbase Services overtook ipNX for 4th place by just 18 subscribers.
  • The top three ISPs account for over 63% of Nigeria's 420,989 active subscribers.

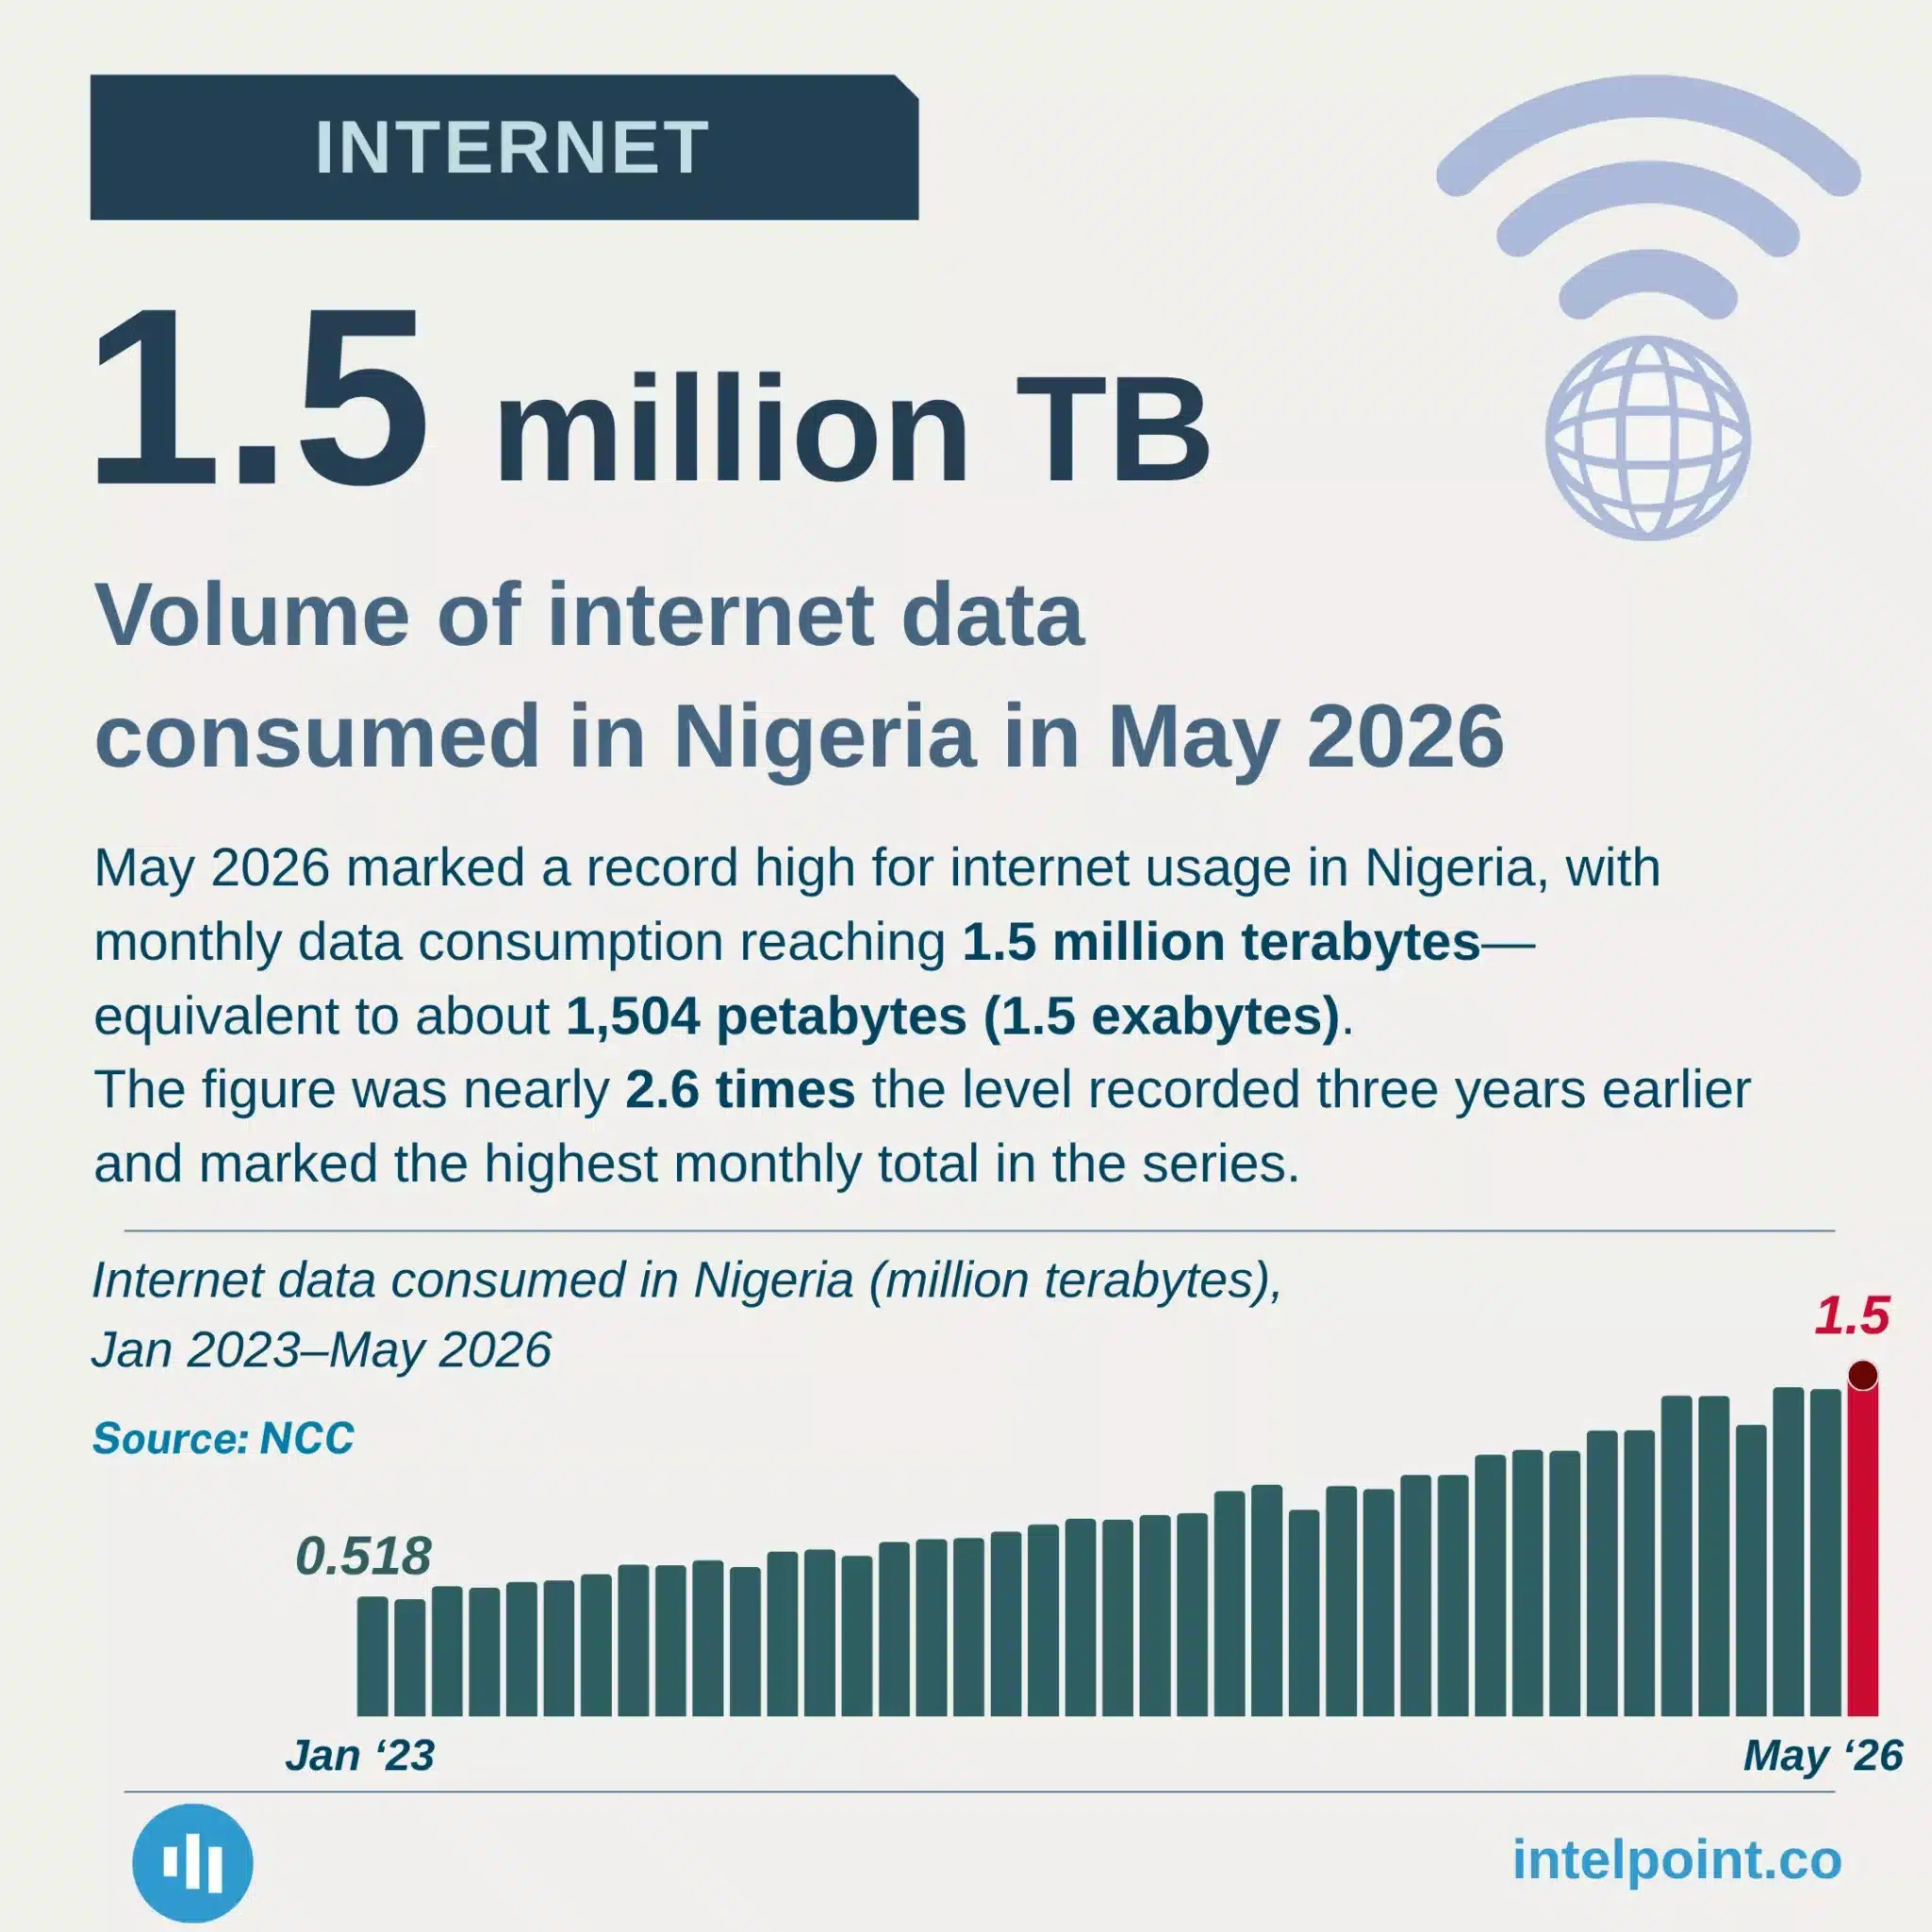
Volume of internet data consumed in Nigeria in May 2026
  • 1.5 million TB was consumed in May 2026, the highest monthly level on record.
  • 7 million TB was consumed in Jan–May 2026, up 42.1% from the same period in 2025.
  • Jan–May 2026 usage was 88.4% higher than in 2024 and 156.3% higher than in 2023.
  • May’s monthly usage was nearly 2.6× the level recorded three years earlier.
  • The surge points to rapidly growing demand for internet-based services, content and digital activity in Nigeria.

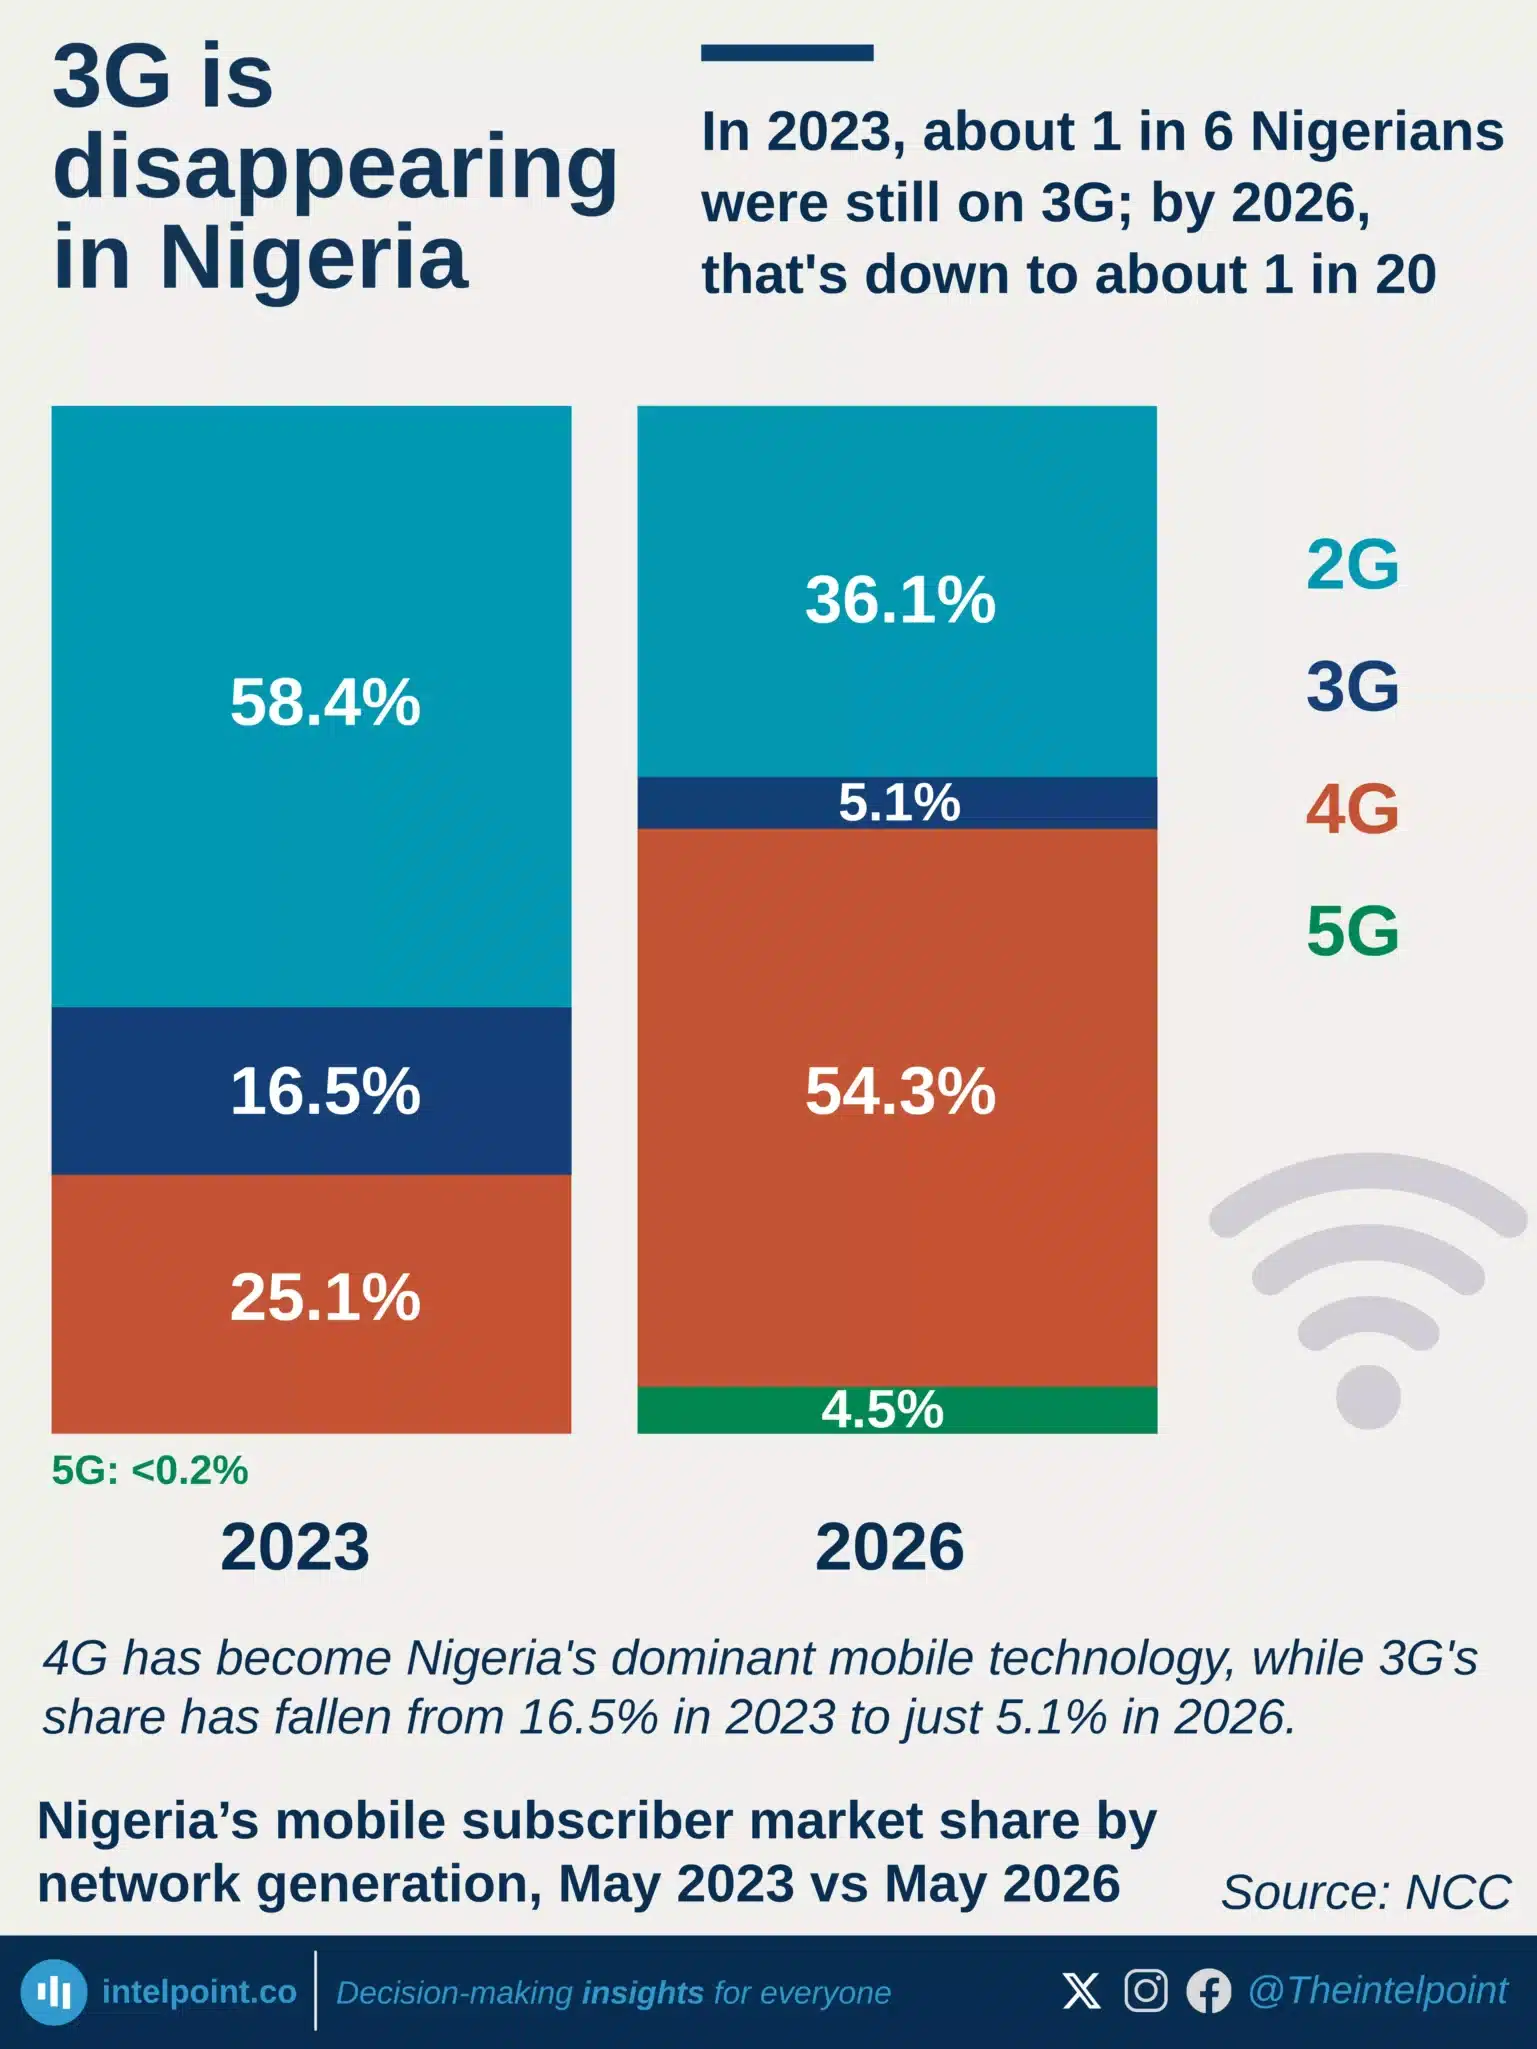
In 2023, about 1 in 6 Nigerians were still on 3G; by 2026, that's down to about 1 in 20
  • 3G's share of Nigeria's mobile market fell from 16.5% to 5.1% between May 2023 and May 2026.
  • 4G became the dominant network, with its market share rising from 25.1% to 54.3% over the same period.
  • 2G's share declined from 58.4% to 36.1% but still accounted for more than one-third of all mobile connections.
  • 5G expanded nearly 37-fold, growing from less than 0.1% to 4.5% of mobile subscriptions.

Nearly 2 in 3 active mobile lines in Ekiti are on MTN
  • MTN held more than half of active mobile lines in most Nigerian states as of December 2025.
  • Ekiti recorded MTN’s highest share at 69.6%, followed by Imo at 64.1% and Anambra at 63.4%.
  • Borno was Airtel’s only leading state, with 56.9% of active mobile lines.
  • Globacom did not lead any state, but it had notable shares in Kogi, Edo, Ondo, FCT, and Oyo.

MTN accounts for over half of internet subscriptions in most Nigerian states
  • MTN held over 50% of active internet subscriptions in most Nigerian states as of December 2025.
  • Ekiti had MTN’s highest share at 70.6%, followed by Imo at 64% and Anambra at 63.7%.
  • Borno was the only state where Airtel led, with 56.6% of active internet subscriptions.
  • Globacom did not lead any state, but it had notable shares in Edo, Kogi, Ondo, Oyo, and Bayelsa.
 

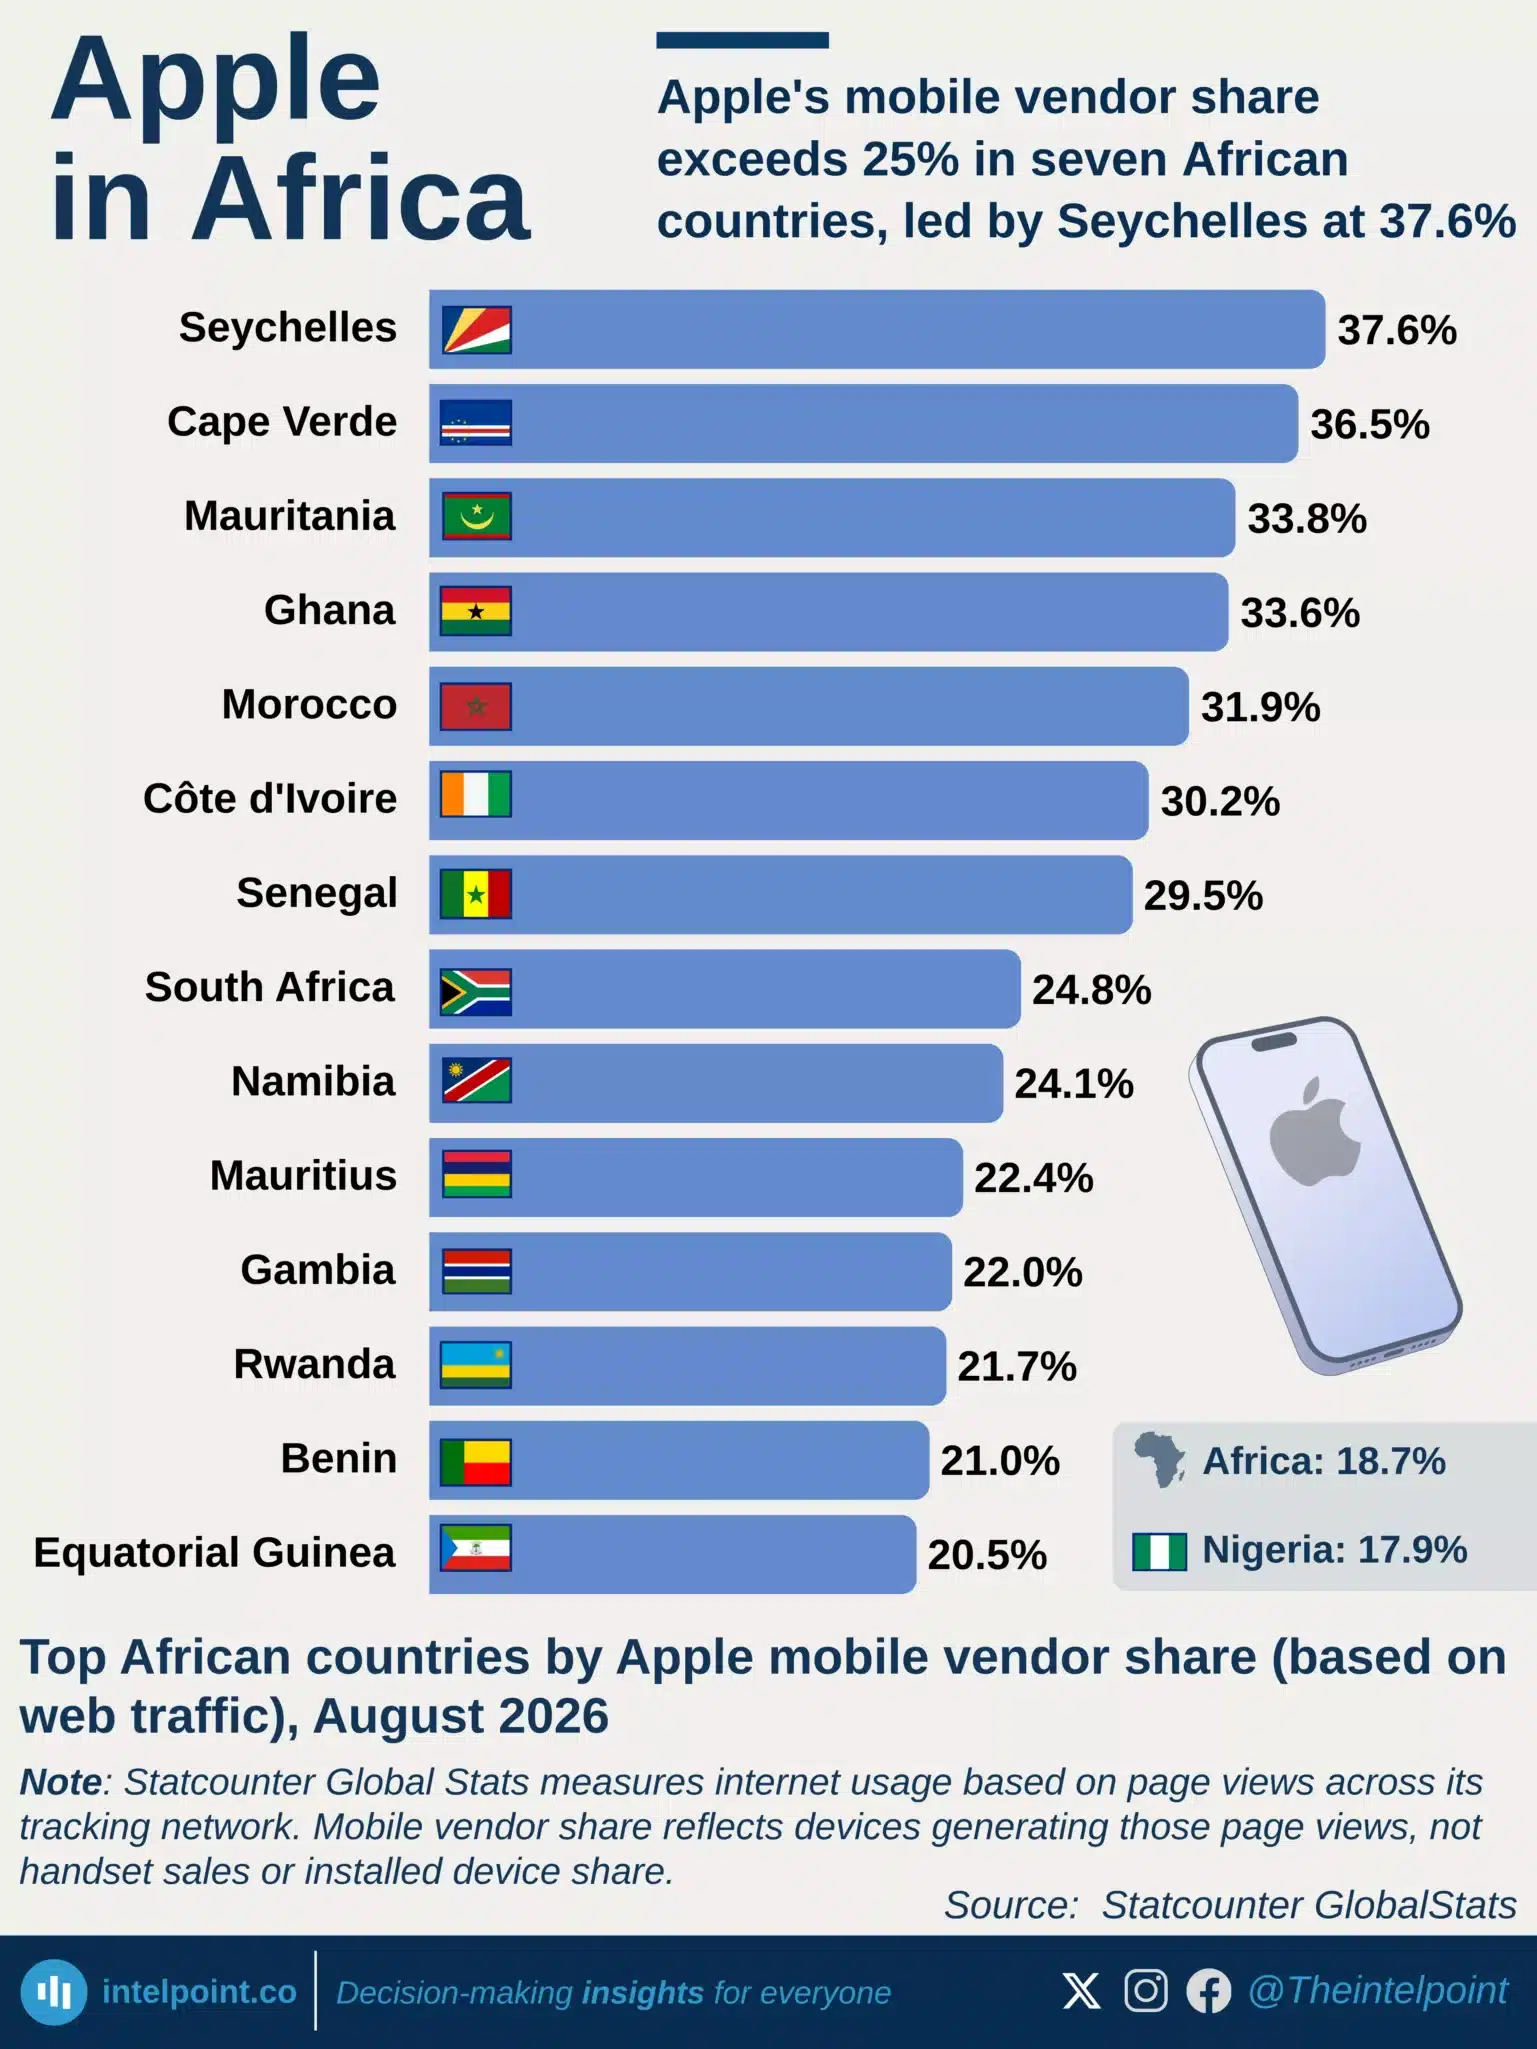
iPhone usage in Africa is just 15%, far below North America’s 60% usage
  • North America leads globally with 60.2% iPhone usage, making it the largest iPhone market.
  • Oceania follows at 58.9%, showing similar consumer preferences to North America.
  • Africa has the lowest iPhone share (14.7%), highlighting a significant adoption gap.
  • Nigeria aligns with the continental trend at 14.1%, reinforcing that the gap is structural, not country-specific.

POPULAR TOPICS
SIGN UP TO OUR NEWSLETTER
Get periodic updates about the African startup space, access to our reports, among others.
Subscribe Here
Subscription Form

A product of Techpoint Africa. All rights reserved