Crude oil alone accounts for 55.7% of all exports. Remove it and Nigeria runs a ₦26.7tn trade deficit. The entire surplus rests on one commodity.
Nigeria imports ₦31.97tn in manufactured goods but exports only ₦2.50tn, a 12-to-1 ratio that reflects near-total dependence on foreign industrial output.
Nigeria exports ₦25.3tn in petroleum products yet imports ₦13.3tn of refined petroleum. Africa's top oil producer still can't fully process its own crude.
Despite Nigeria's vast farmland, agri-exports (₦5.07tn) barely exceed agri-imports (₦4.76tn). The sector earns almost nothing net.
The Strait of Malacca is the world’s most important oil chokepoint, carrying about 24–25% of global oil supply in recent years.
The Strait of Hormuz moves around 20–23% of global oil supply, making it the second-largest energy transit chokepoint.
The Cape of Good Hope carries about 9–10% of global oil flows, and its share tends to increase when other chokepoints face disruptions.
The Bab el-Mandeb saw a sharp drop in oil flow share from about 9% in 2023 to around 4% in 2024, reflecting security concerns affecting shipping in the Red Sea corridor.
Oil transported through the Suez Canal and the SUMED pipeline system dropped significantly after 2023, falling from about 8.6% to below 5%, showing how quickly routes shift during geopolitical tensions.
The Strait of Malacca’s share has remained consistently high and stable, indicating its structural importance to Asian energy demand.
Alternative routes like the Cape of Good Hope in South Africa are longer but strategically crucial, especially when Middle Eastern chokepoints become unstable.
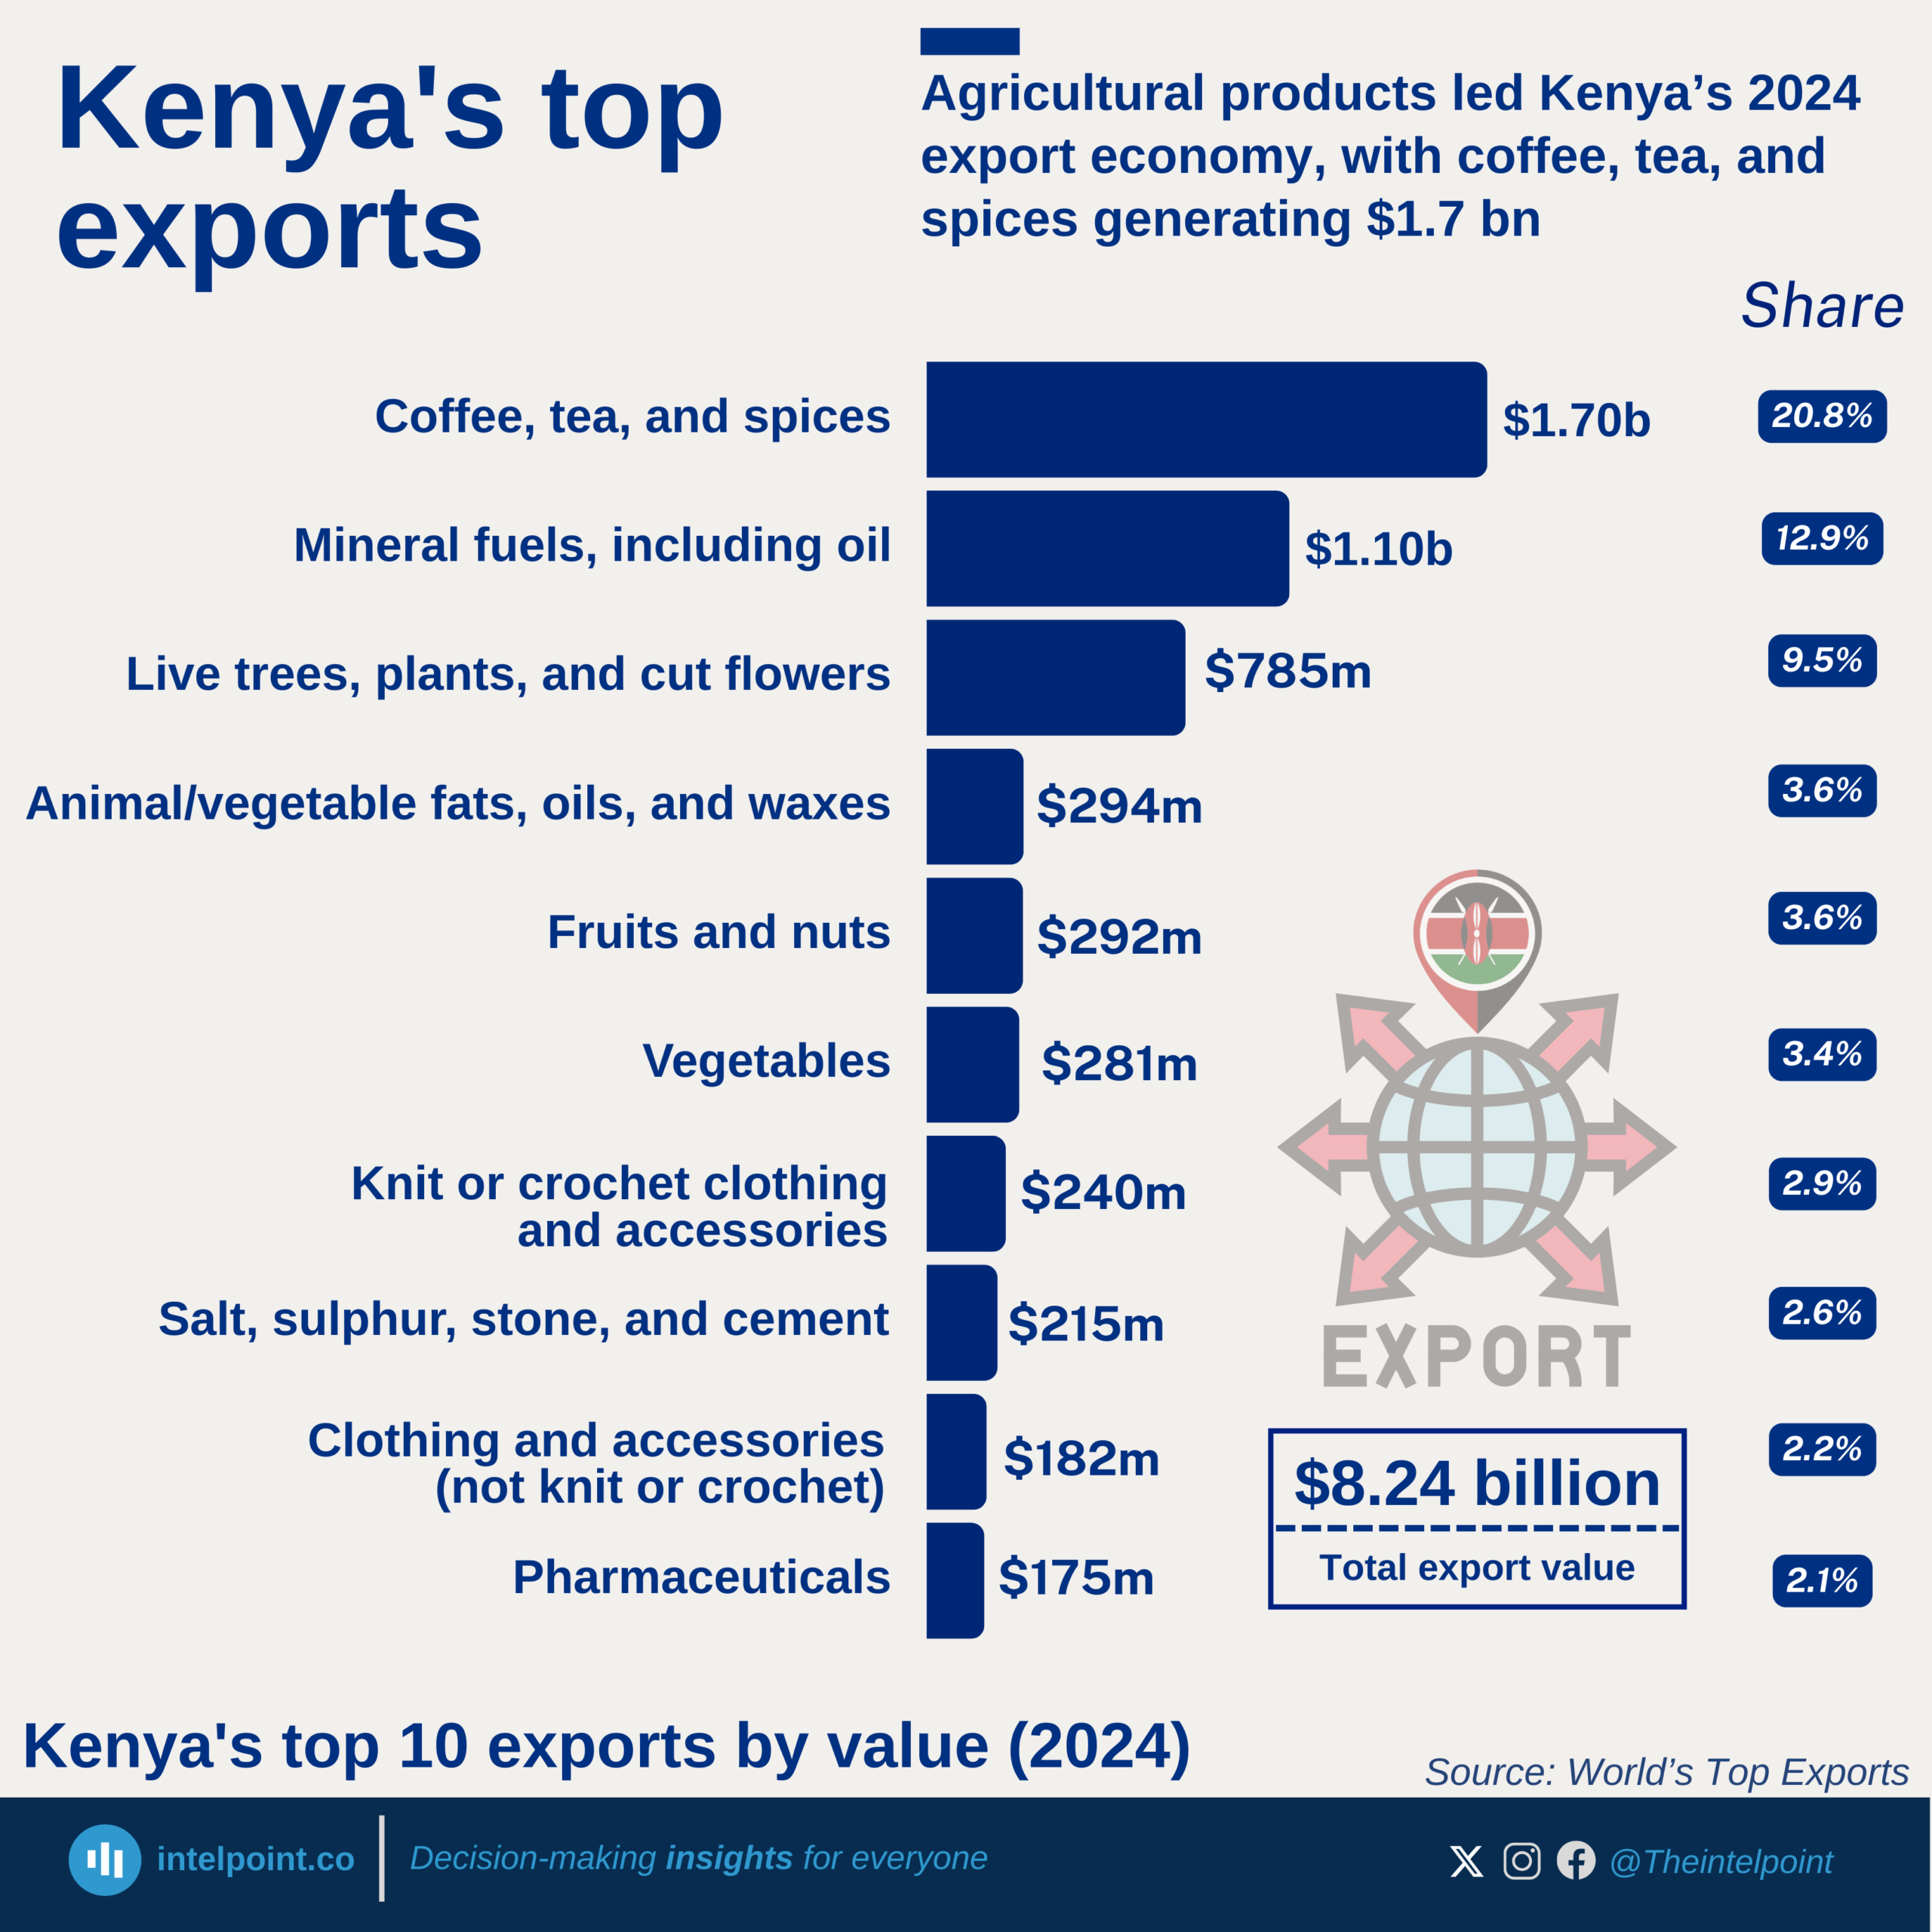
Agriculture dominated Kenya’s exports, with coffee, tea, and spices alone contributing $1.7 billion, the largest single export category.
Mineral fuels were a surprisingly strong second, delivering $1.1 billion, and showing Kenya’s growing role in regional fuel distribution.
Horticultural exports (flowers, live plants, and trees) contributed $790 million, reinforcing Kenya’s global strength in floriculture.
All other export categories fall below $300 million individually, reflecting a long list of small but diverse export segments such as textiles, vegetables, and pharmaceuticals.