Nigeria's FDI made up only 2.5% of the country's capital imports in H1 2024

In H1 2024, Nigeria's FDI accounted for just 2.5% of the country's $5.98 billion total capital imports, down from 14% in H2 2023 and 6.2% in H1 2023.

This highlights a shift towards other capital inflows like portfolio investments.

Portfolio investments rose significantly to $3.48 billion, rebounding from $397 million in H2 2023 and $756 million in H1 2023.
Source:

National Bureau of Statistics

Period:

H1 2024
HTML code to embed chart
Want a bespoke report?
Reach out
Tags
Related Insights

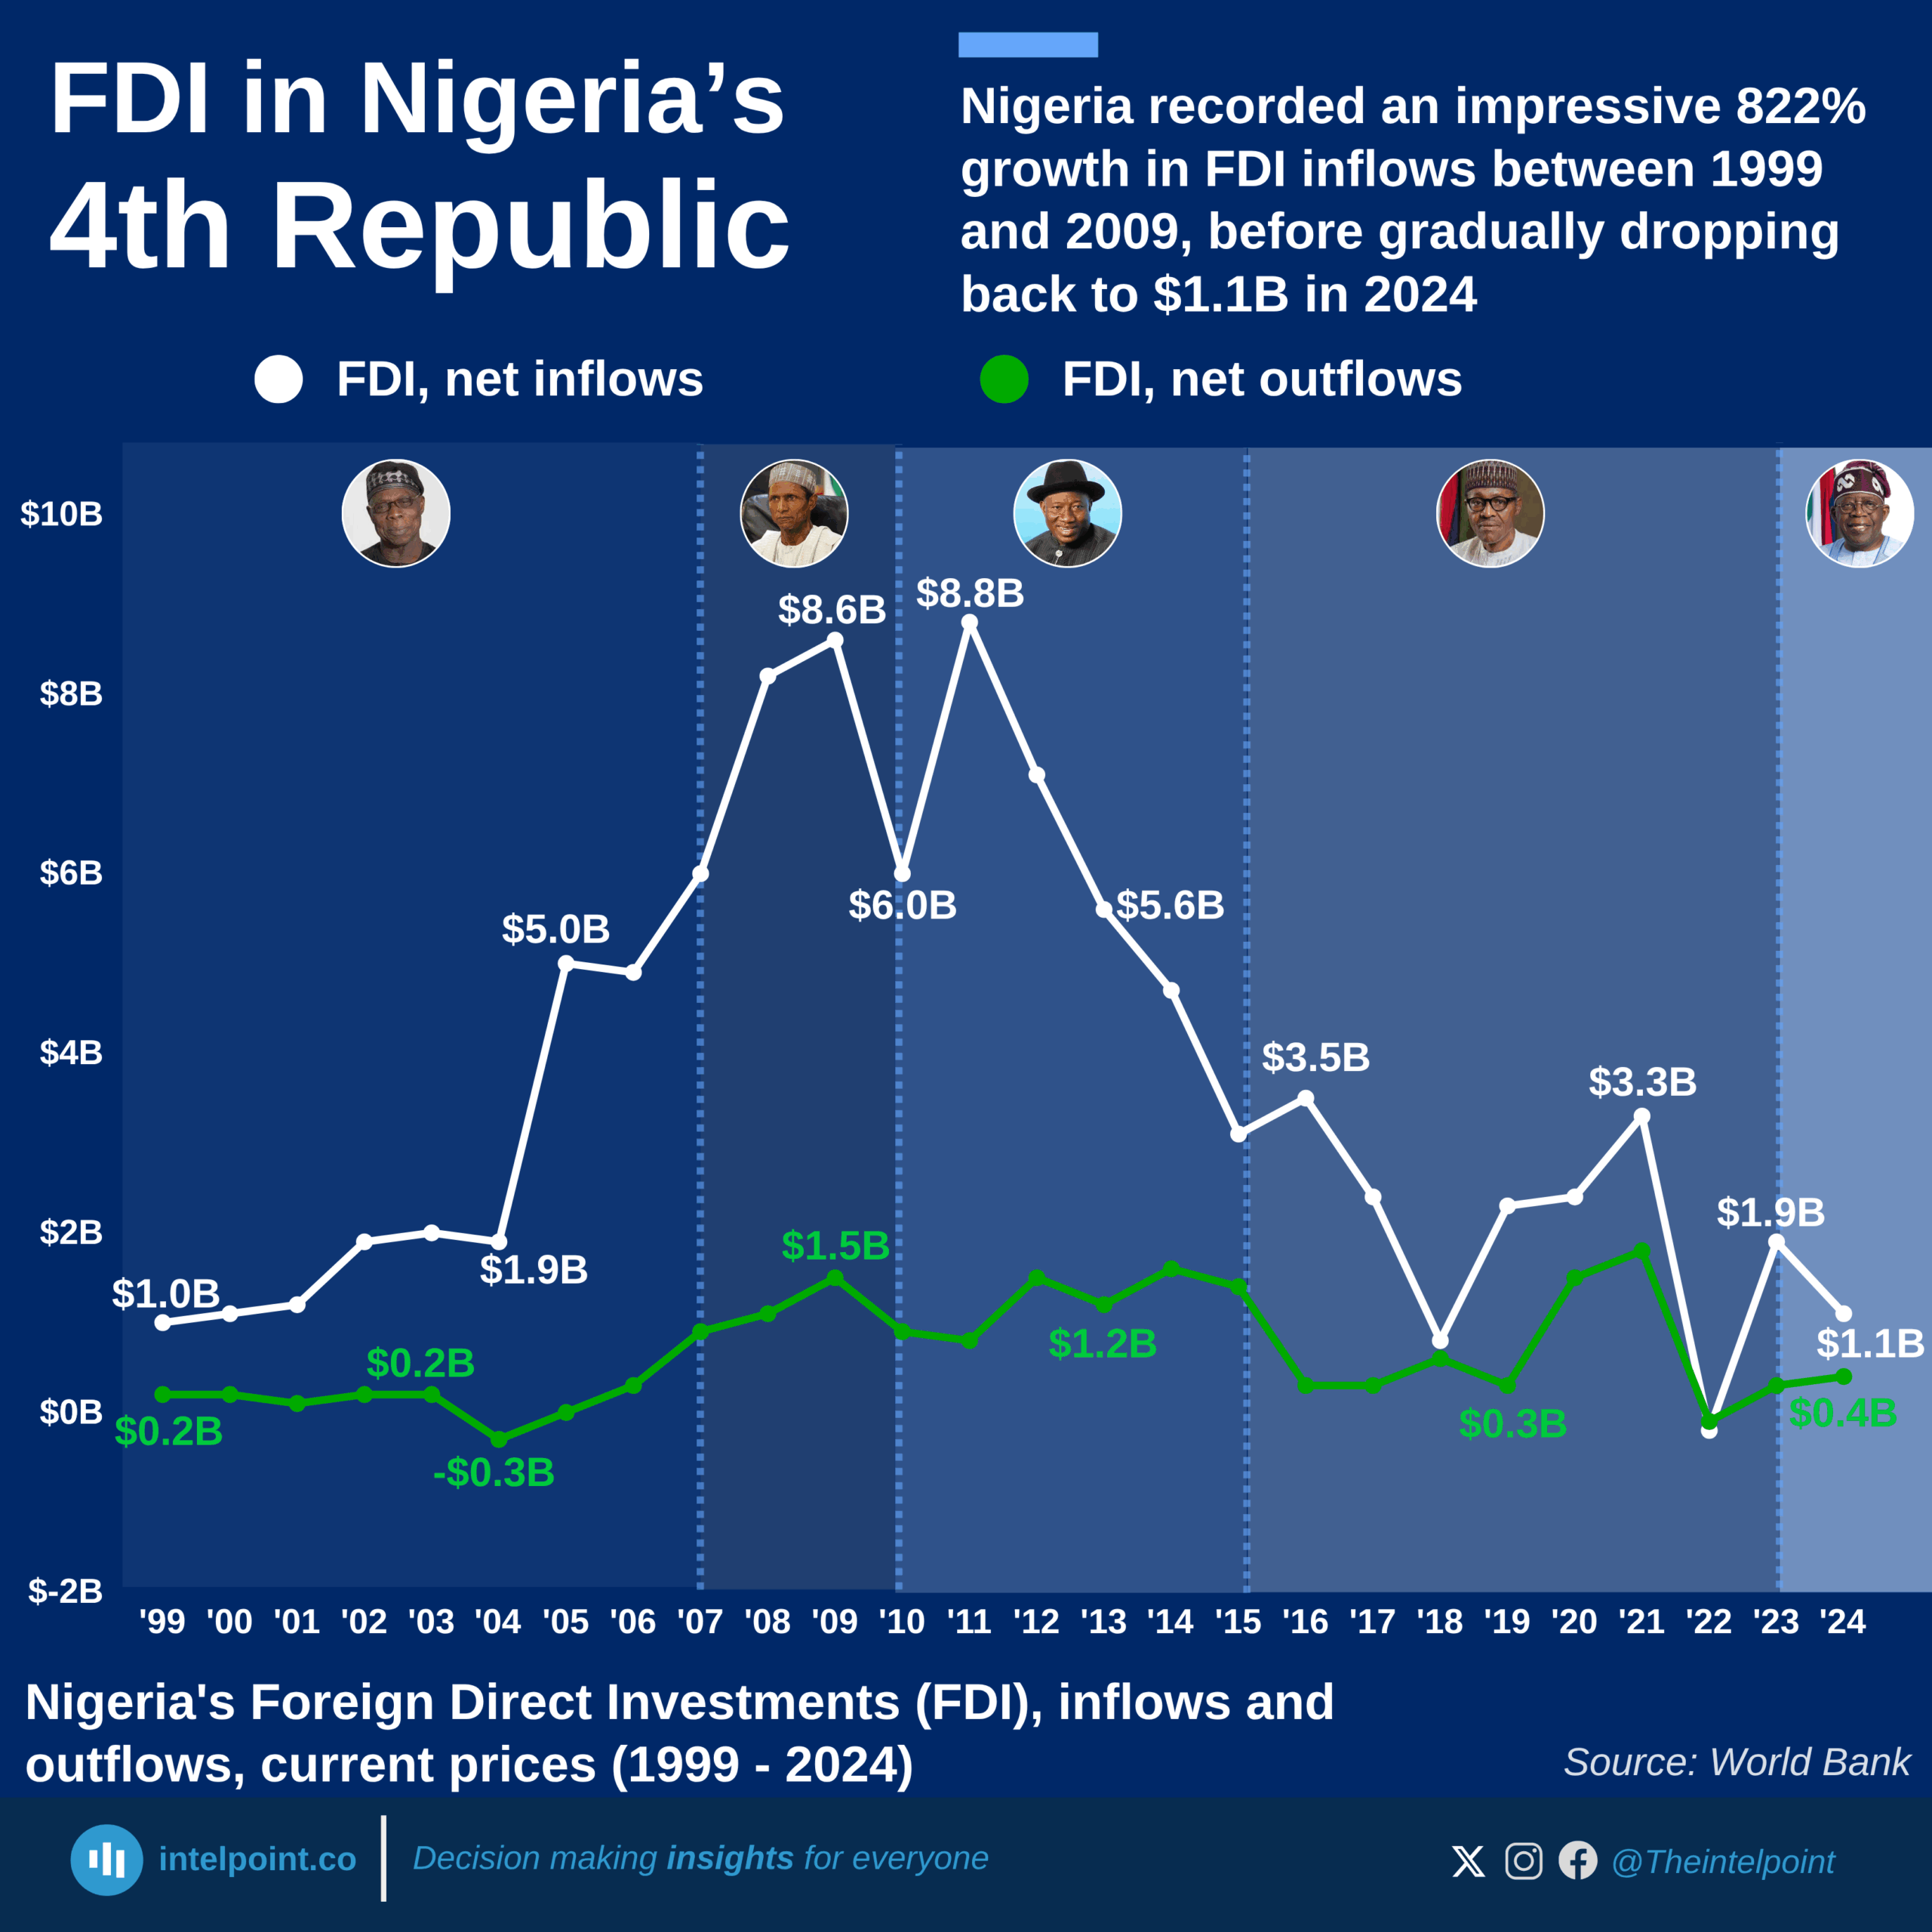
Nigeria recorded an impressive 822% growth in FDI inflows between 1999 and 2009, before gradually dropping back to $1.1B in 2024
  • FDI inflows in Nigeria peaked at $8.8 billion in 2011, marking the highest point in the Fourth Republic.
  • From 2011 to 2024, FDI inflows dropped, settling at $1.1 billion in 2024.
  • The early Fourth Republic (1999–2011) showed growth in FDI inflows.
  • FDI outflows rose from $0.2 billion in 1999 to $1.5 billion in 2009, reflecting gradual international expansion by Nigerian investors.
  • From 2015 onward, both inflows and outflows showed significant volatility, with no clear recovery trend.

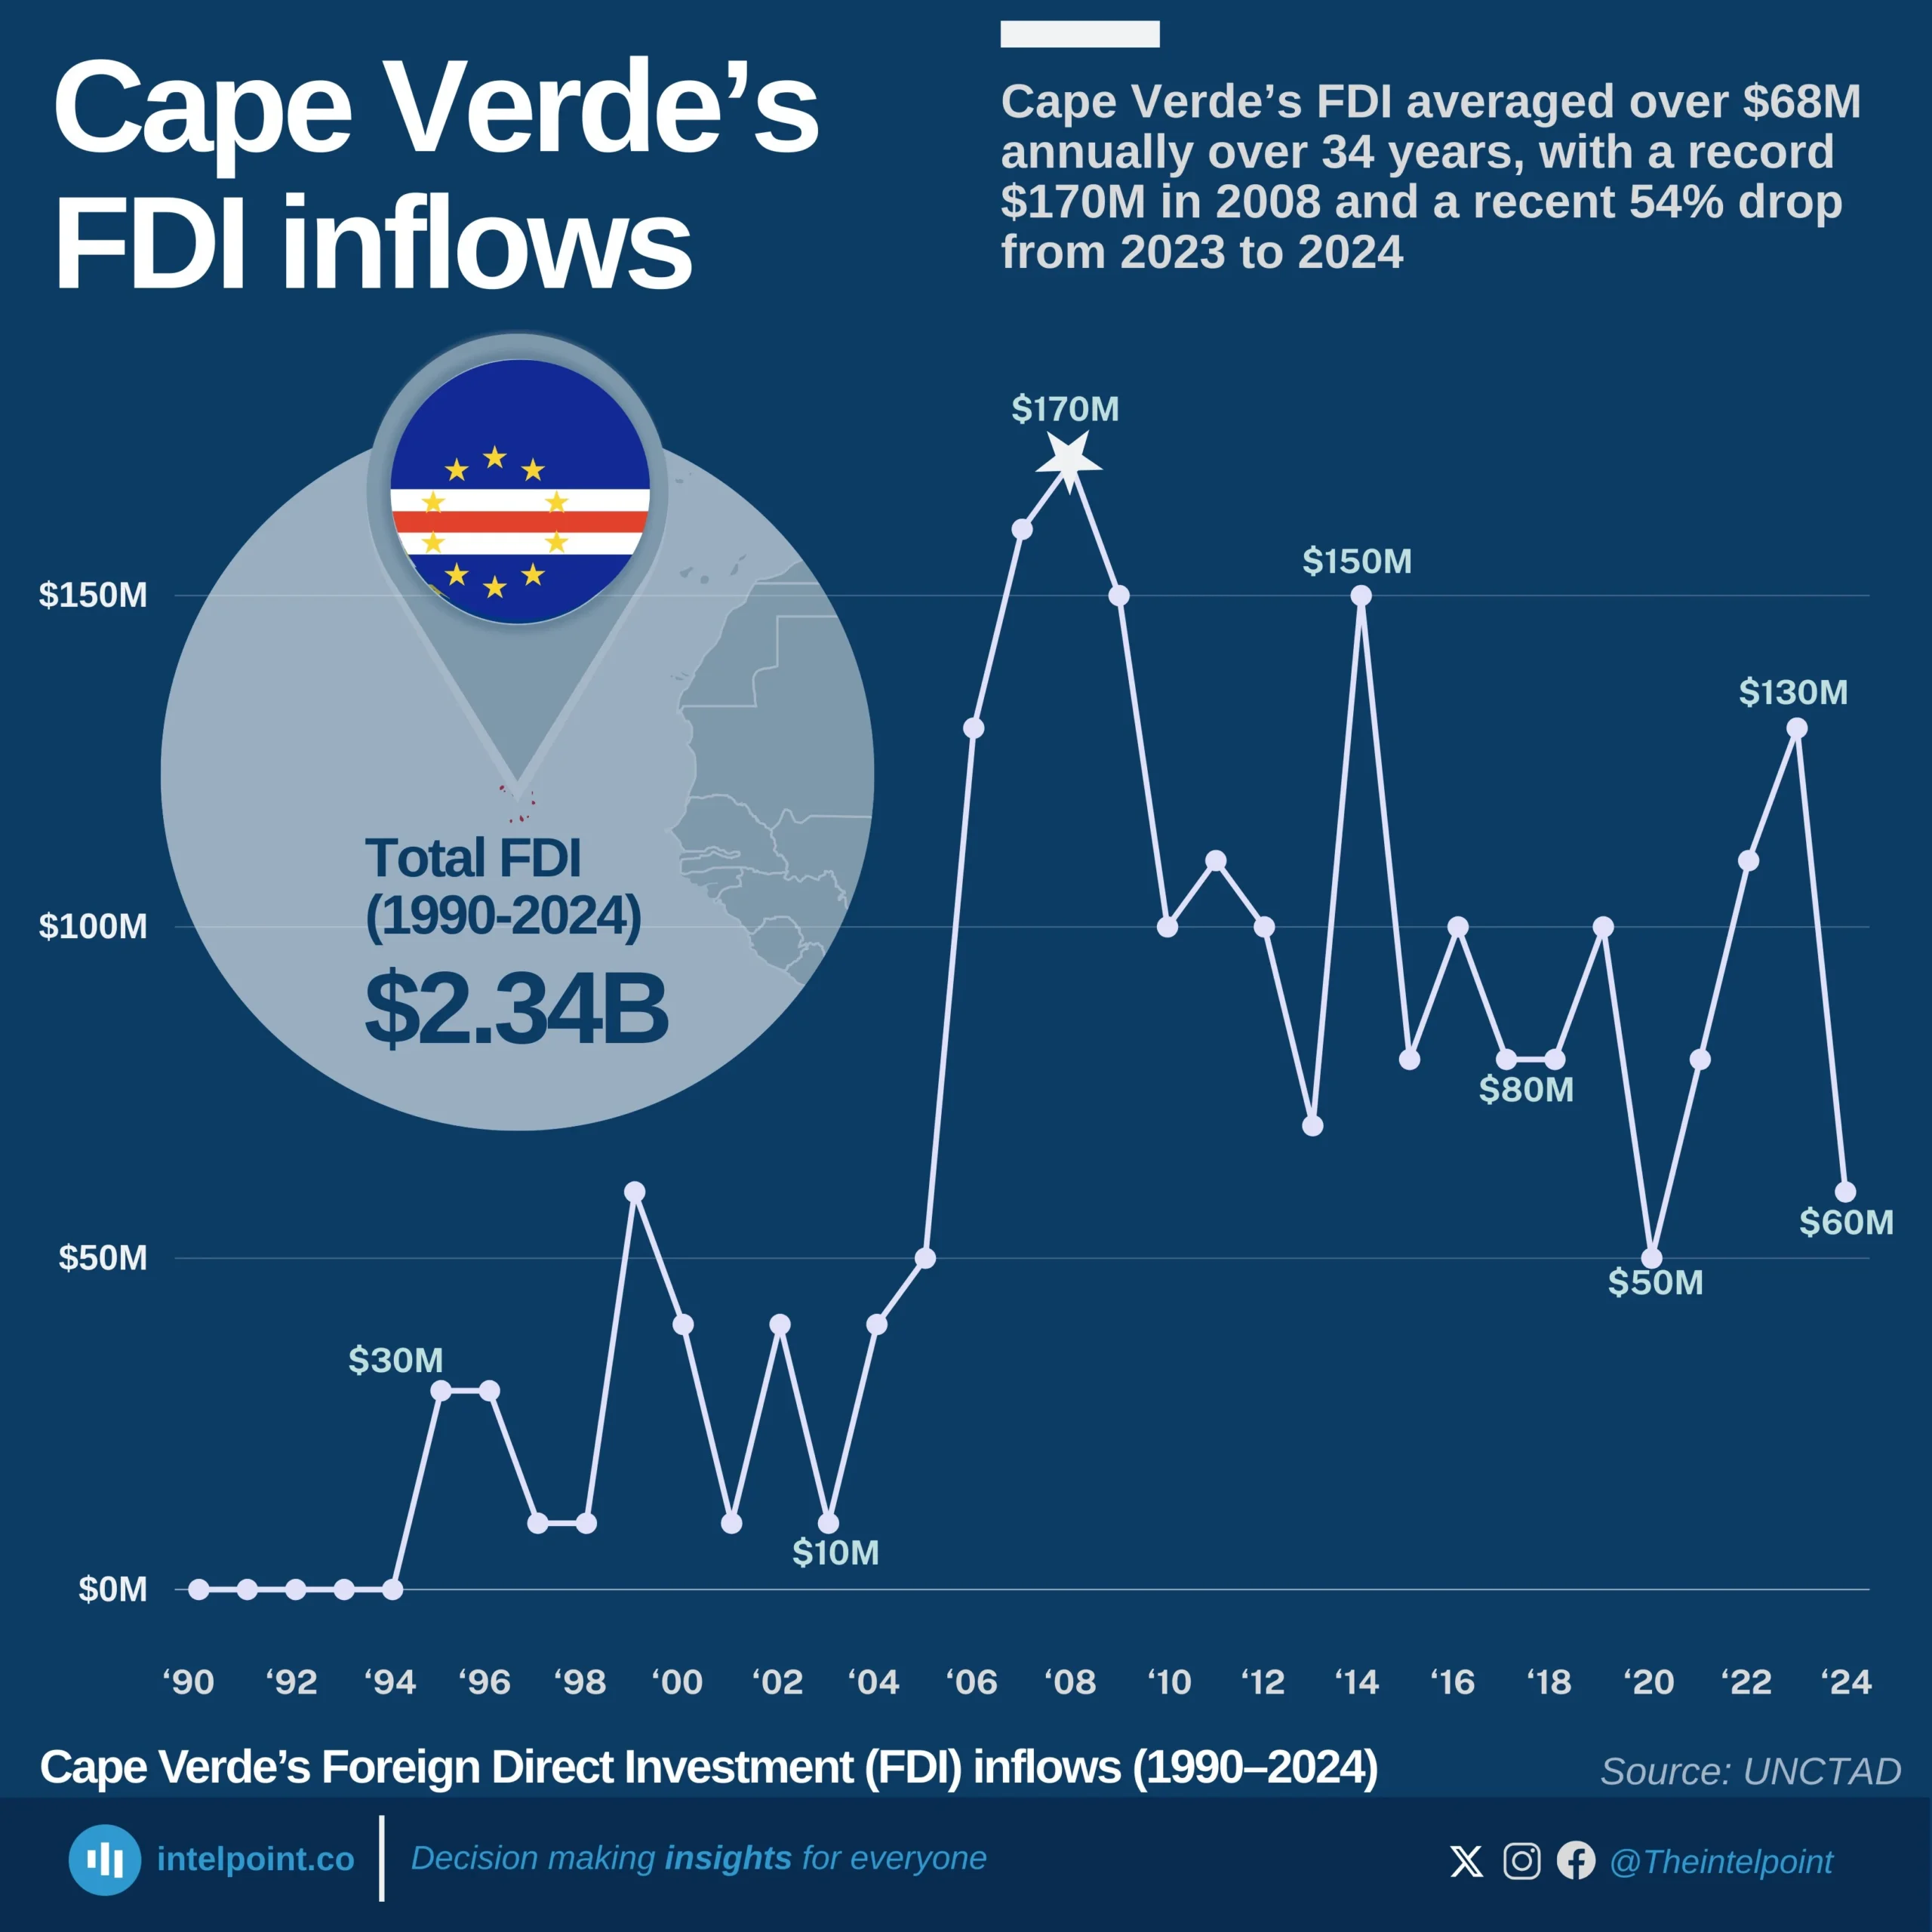
Cape Verde’s FDI averaged over $68M annually over 34 years, with a record $170M in 2008 and a recent 54% drop from 2023 to 2024
  • Cape Verde attracted no foreign direct investment during the early 1990s, signalling limited investor interest at the time.
  • FDI inflows skyrocketed from $130M in 2006 to an all-time high of $170M in 2008, before stabilising above $100M for most of the 2010s.
  • The country experienced large swings, ranging from a high of $150M (2014) to lows of $50M (2020).
  • Despite recovering to $130M in 2023, inflows dropped sharply to $60M in 2024, the weakest figure in over a decade.

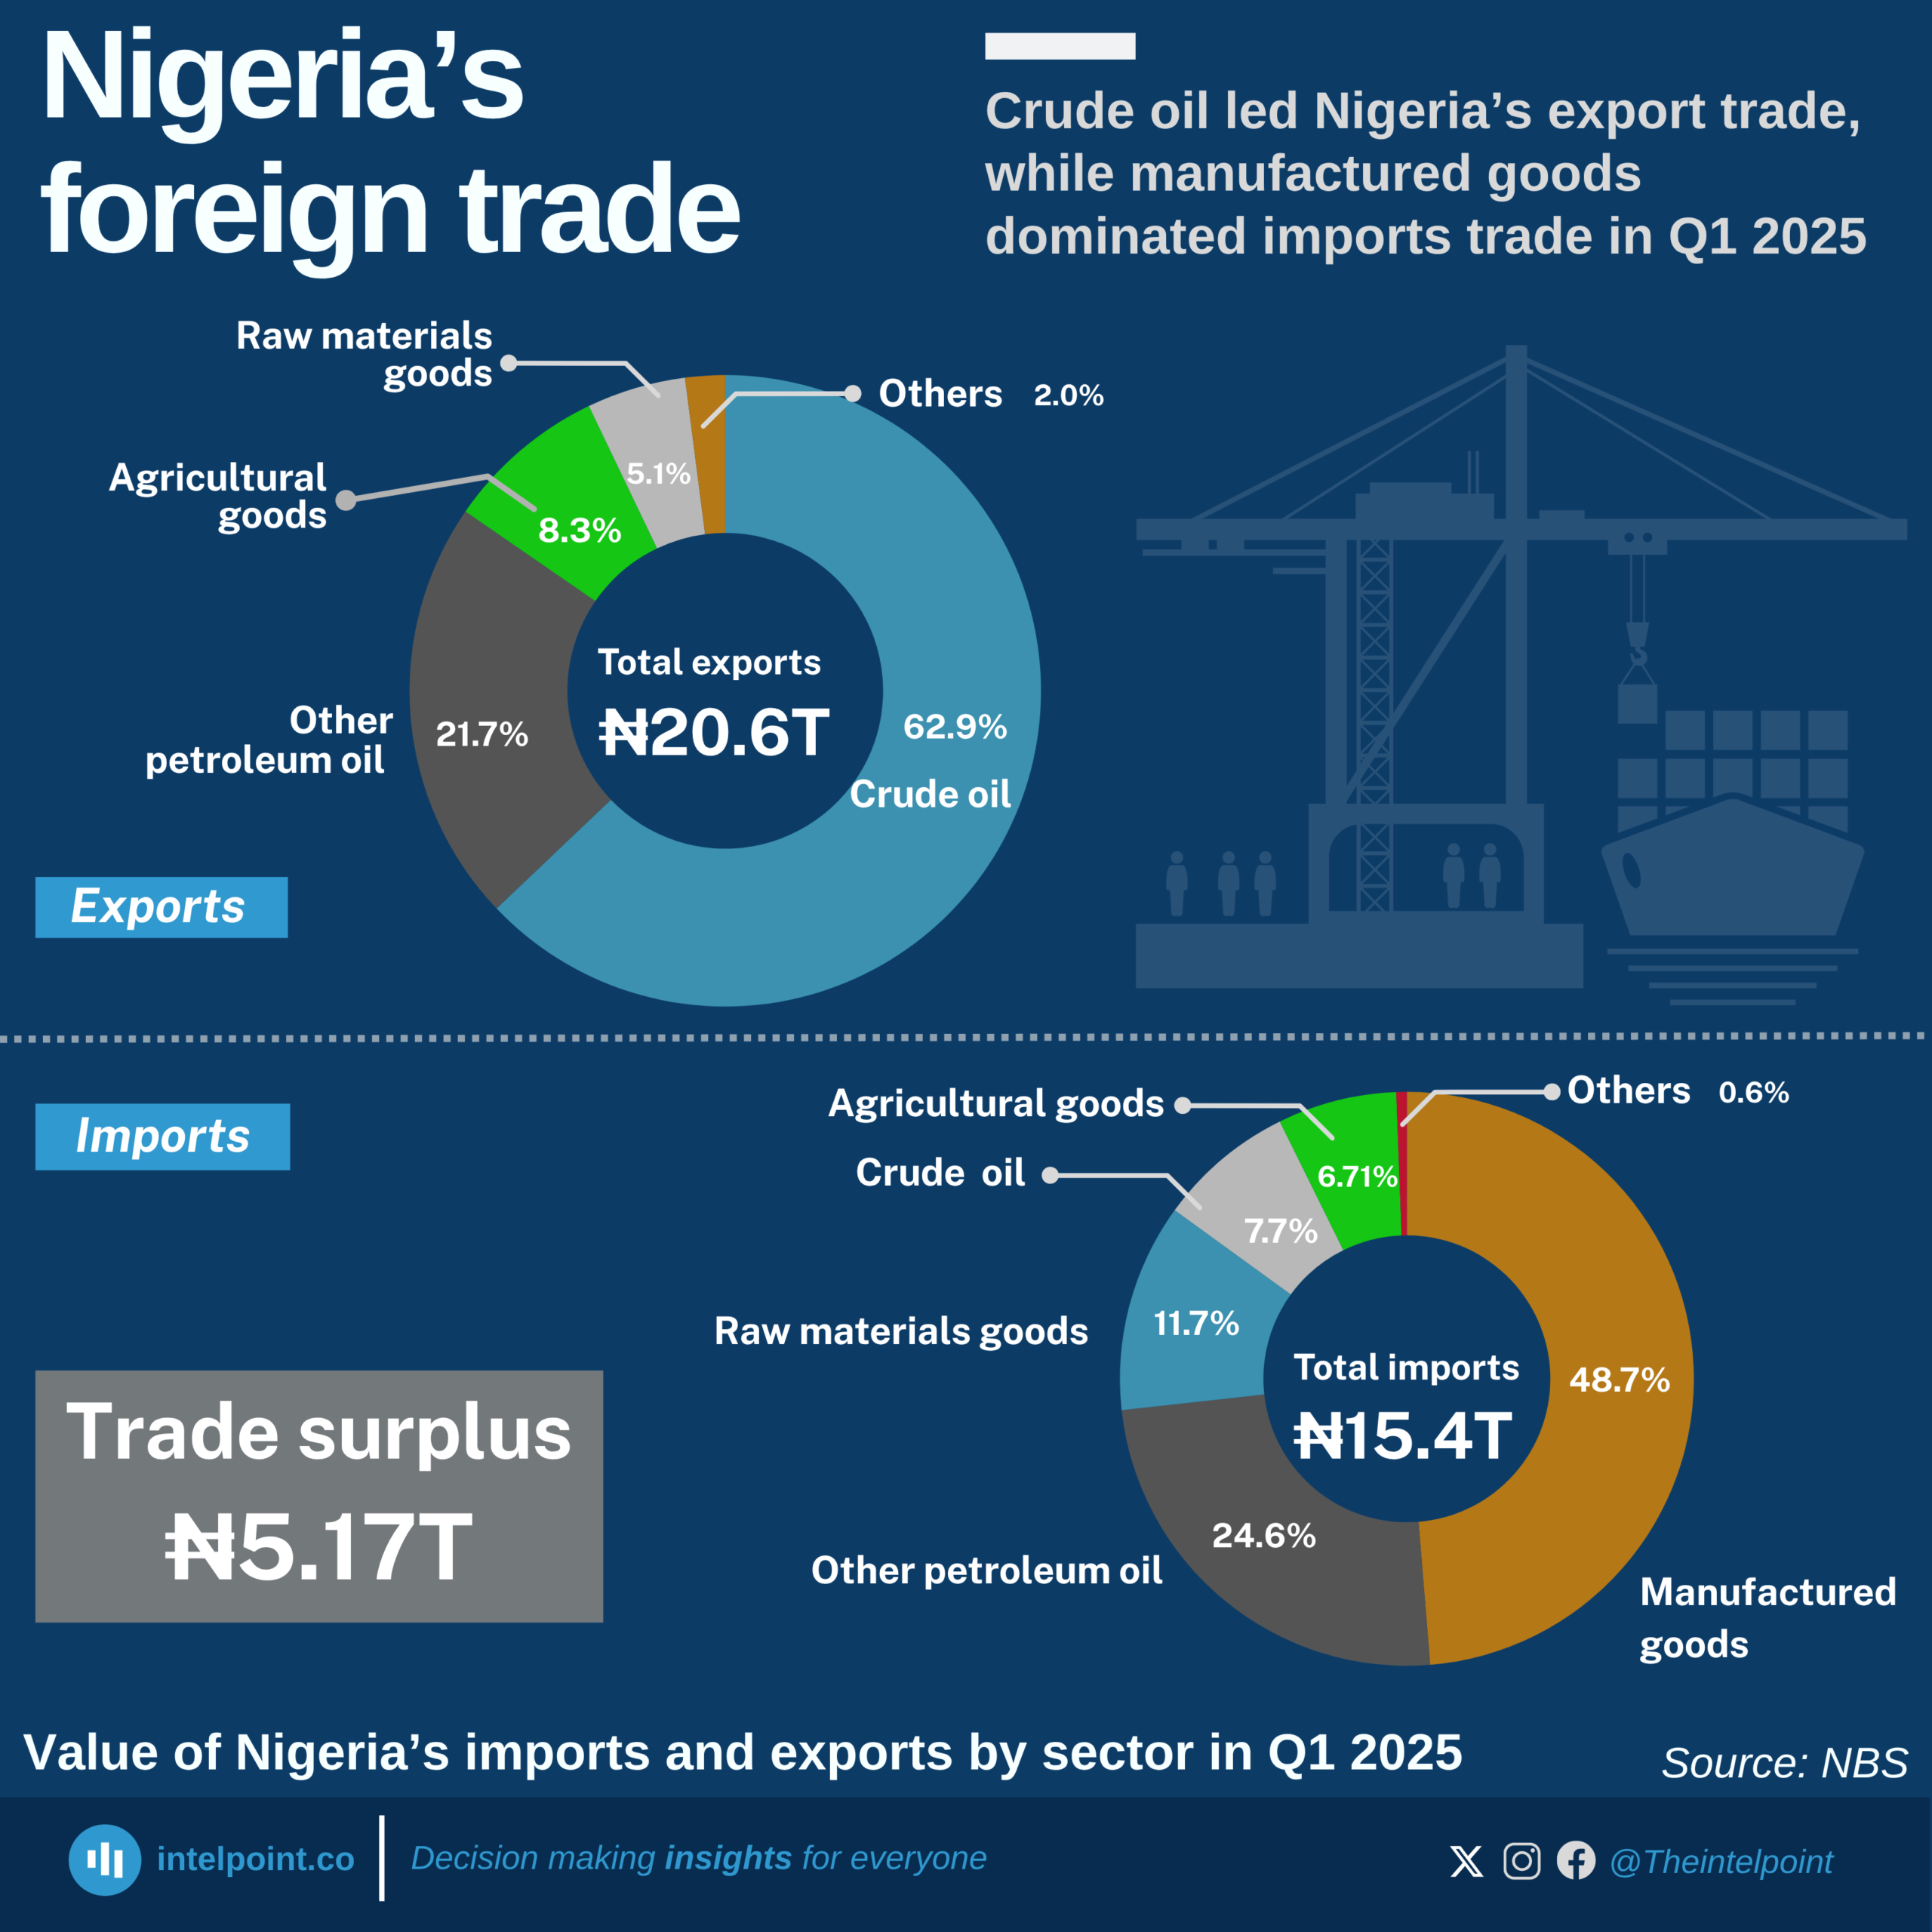
Nigeria’s foreign trade
  • Total Trade Volume in Q1 2025 stood at ₦36.02 trillion, with exports totalling ₦20.6 trillion and imports at ₦15.4 trillion, resulting in a surplus of ₦5.17 trillion.
  • Crude oil dominates Nigeria’s export trade, accounting for the largest share of export revenue. -
  • Other petroleum oil products are also a major export item, reflecting the significance of both raw and refined oil-based commodities in Nigeria’s trade portfolio. -
  • On the import side, manufactured goods dominate, showing Nigeria’s continued reliance on foreign machinery, technology, and consumer goods.
  • While Nigeria exports mostly raw and oil-based products, it imports refined, processed, or industrial goods, indicating a structural trade gap and limited local industrial capacity. -
  • Agricultural and raw material goods feature on both sides of trade, but their value is significantly less than petroleum-related trade.

Zambia’s FDI rebounded to $1.24B in 2024 after sharp decline in 2022, attracted over $22B since 1990
  • Zambia recorded its highest-ever FDI inflow in 2013 at $2.10 billion.
  • After dipping to a negative inflow of -$0.07 billion in 2022, Zambia recovered to $1.24 billion in 2024.
  • The country experienced its first billion-dollar inflow in 2007, marking a turning point in foreign investment.
  • FDI inflow was consistently below $0.5 billion throughout the 1990s, indicating limited investor confidence during that period.

The Nigerian stock market's all-share index reached 126.7K in July 2025, surging by 8.6% month-on-month
  • July 2025 saw the ASI rise by 8.6%, the largest monthly jump in over a year.
  • The index grew steadily for four straight months from April to July 2025.
  • ASI climbed from 99.5K in June 2024 to 126.7K in July 2025, a 27.3% increase overall.
  • August 2024 recorded the sharpest monthly drop at -2.9%.
  • December 2024 and January 2025 posted back-to-back strong gains of 2.5% and 3.8% respectively.
  • May and June 2025 saw healthy gains of 4.2% and 6.6%, paving the way for July’s surge.

Côte d'Ivoire’s FDI sees dramatic turn in 2024, jumping to $3.8B, over two times 2022 levels and its highest since 1990
  • Côte d'Ivoire attracted $3.80 billion in FDI in 2024, its highest annual inflow ever recorded, more than double 2022’s $1.6 billion.
  • Between 1990 and 2016, its FDI remained mostly below $1 billion annually, only beginning to surge from 2017 onwards.
  • The country crossed the $1 billion mark for the first time in 2021, signalling increased investor confidence and macroeconomic improvements.
  • Over the last three years (2022–2024) alone, Côte d'Ivoire drew in $7.89 billion in FDI, accounting for over 40% of total inflow since 1990.

POPULAR TOPICS
SIGN UP TO OUR NEWSLETTER
Get periodic updates about the African startup space, access to our reports, among others.
Subscribe Here
Subscription Form

A product of Techpoint Africa. All rights reserved