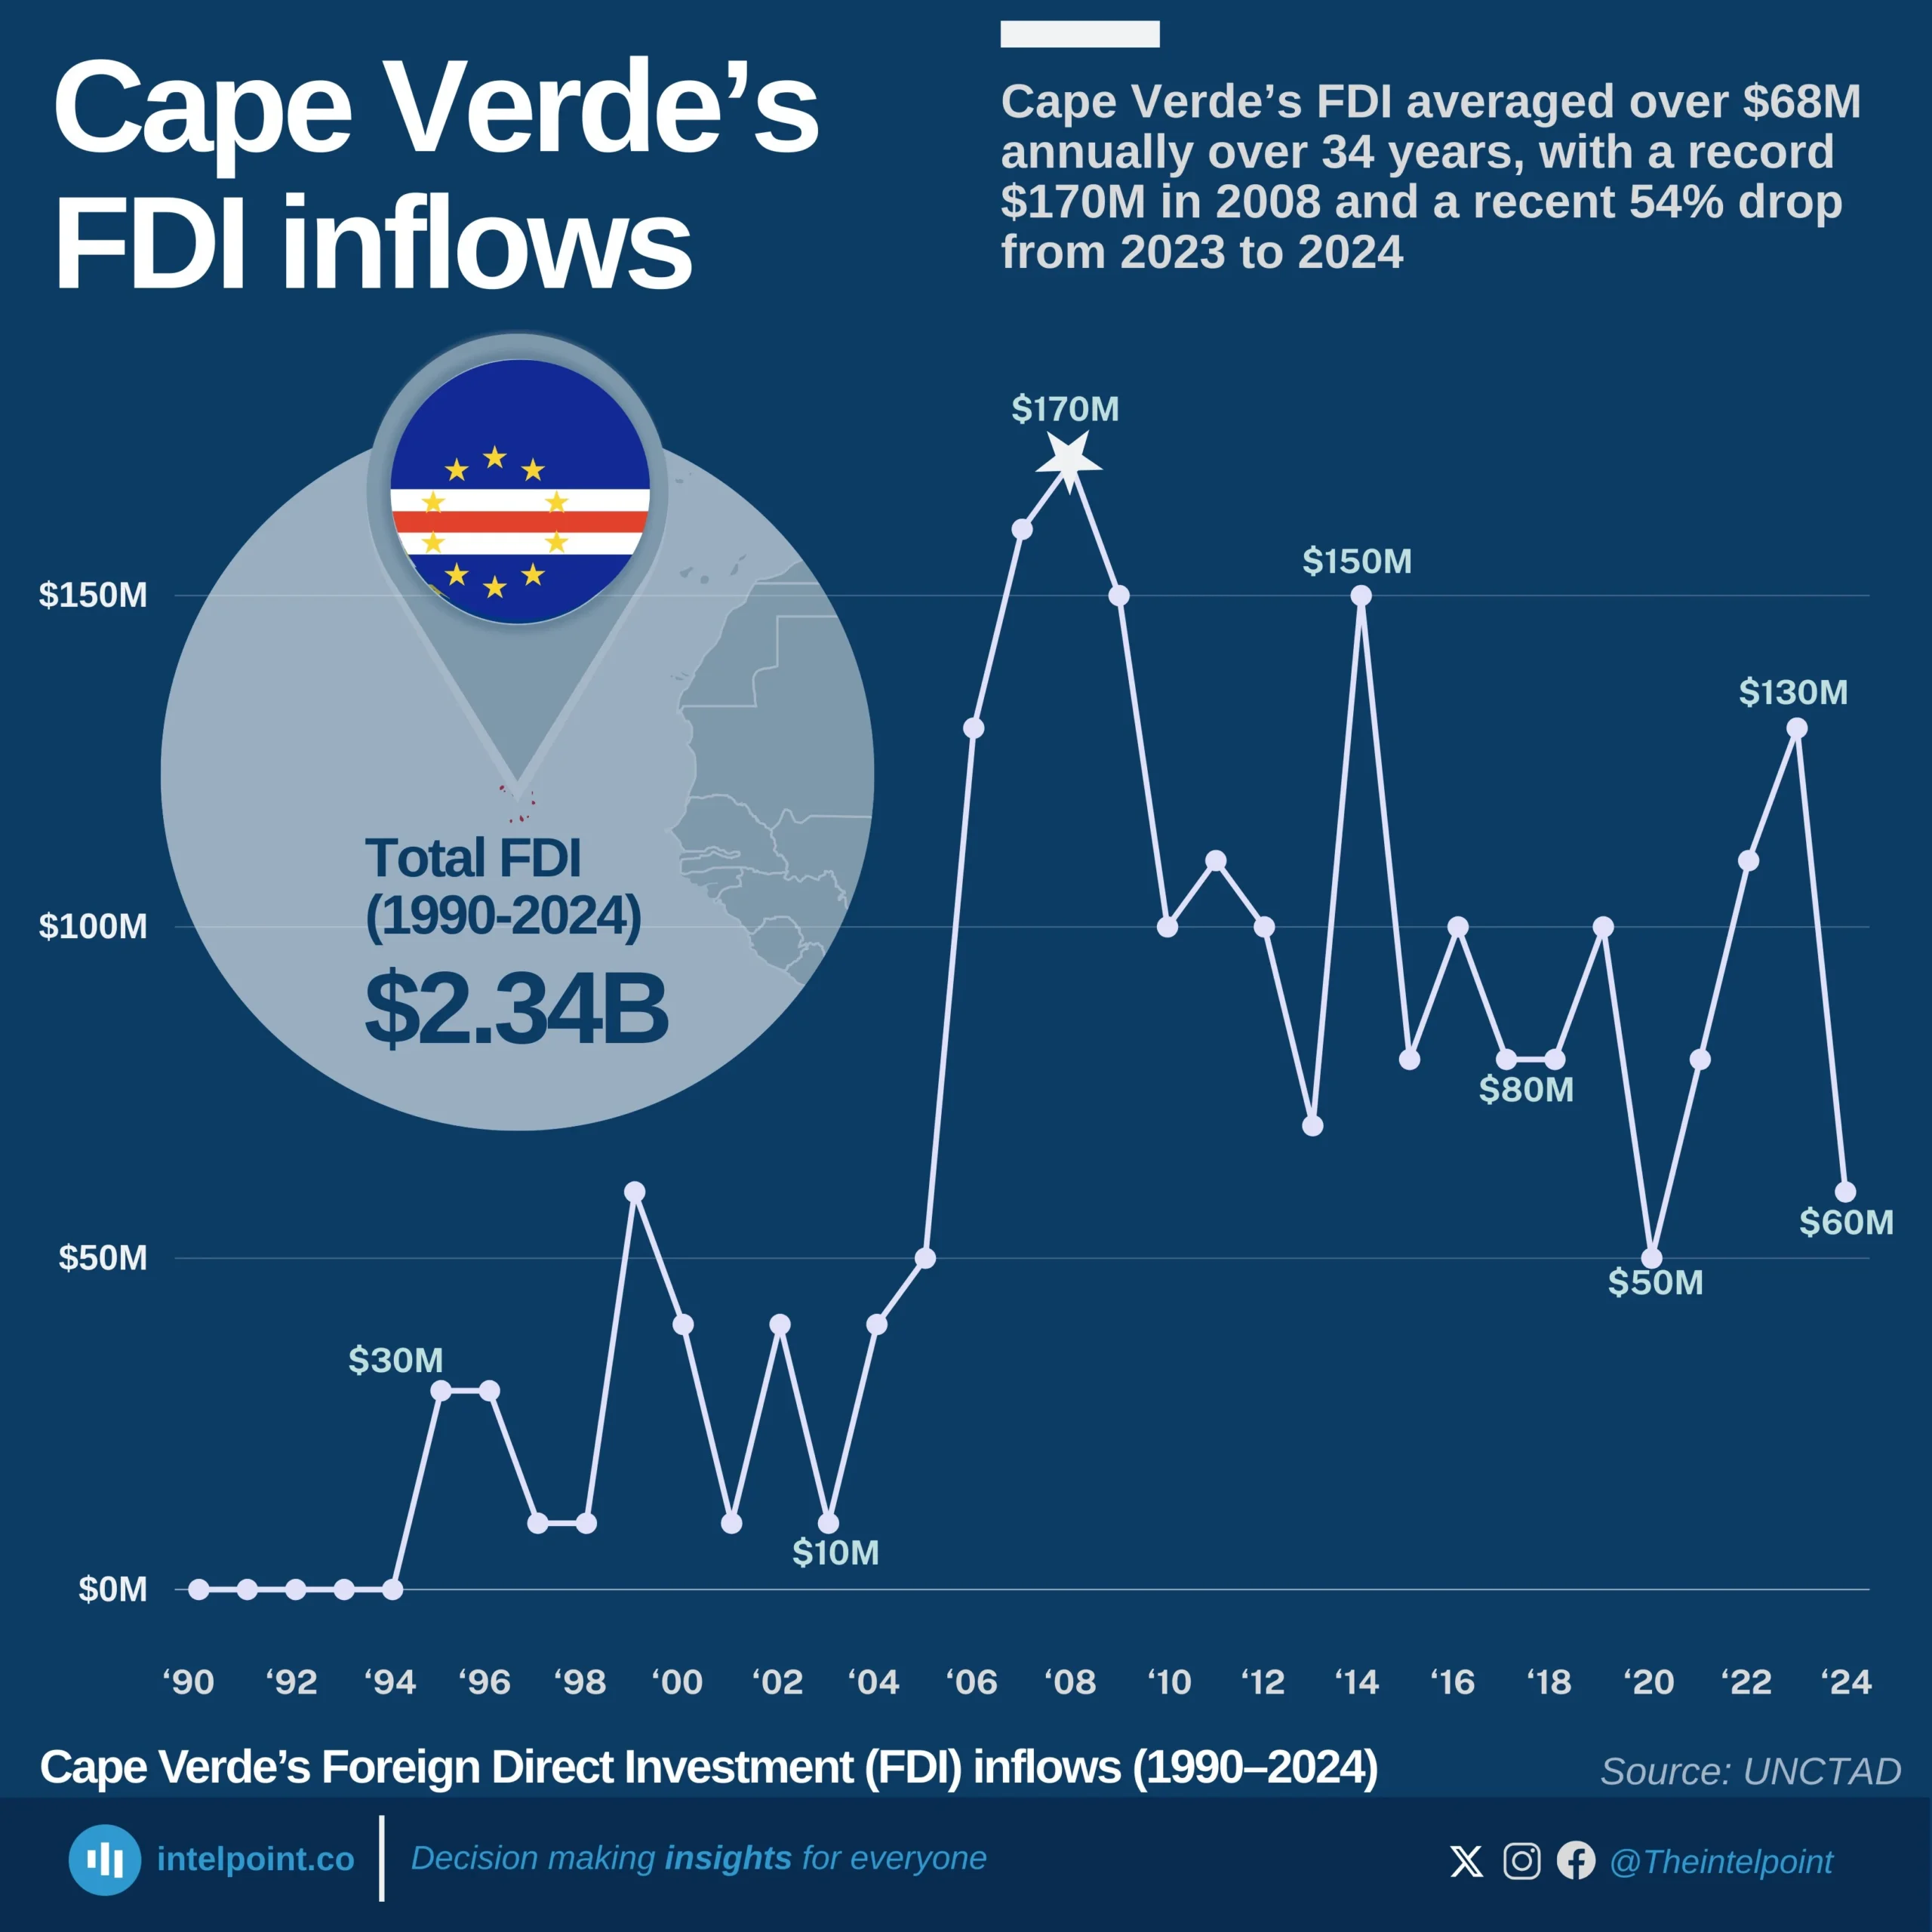
Cape Verde’s FDI averaged over $68M annually over 34 years, with a record $170M in 2008 and a recent 54% drop from 2023 to 2024

Key Takeaways

  • Cape Verde attracted no foreign direct investment during the early 1990s, signalling limited investor interest at the time.
  • FDI inflows skyrocketed from $130M in 2006 to an all-time high of $170M in 2008, before stabilising above $100M for most of the 2010s.
  • The country experienced large swings, ranging from a high of $150M (2014) to lows of $50M (2020).
  • Despite recovering to $130M in 2023, inflows dropped sharply to $60M in 2024, the weakest figure in over a decade.

Cape Verde’s foreign direct investment journey over the past three decades reflects both its growing international profile and persistent volatility. After recording no inflows in the early 1990s, the country gradually began attracting modest investments by the mid-1990s. A turning point came in the 2000s, when reforms and global interest boosted inflows to record highs, peaking at $170M in 2008.

Since then, Cape Verde has experienced alternating periods of strong investor confidence and sharp declines, with figures fluctuating between $50M and $150M throughout the 2010s. The most recent trend is concerning: while 2023 showed promise with $130M, the dramatic fall to just $60M in 2024 highlights ongoing challenges in sustaining consistent FDI momentum.
Source:

UNCTAD

Period:

1990 - 2024
HTML code to embed chart
Want a bespoke report?
Reach out
Tags
Related Insights

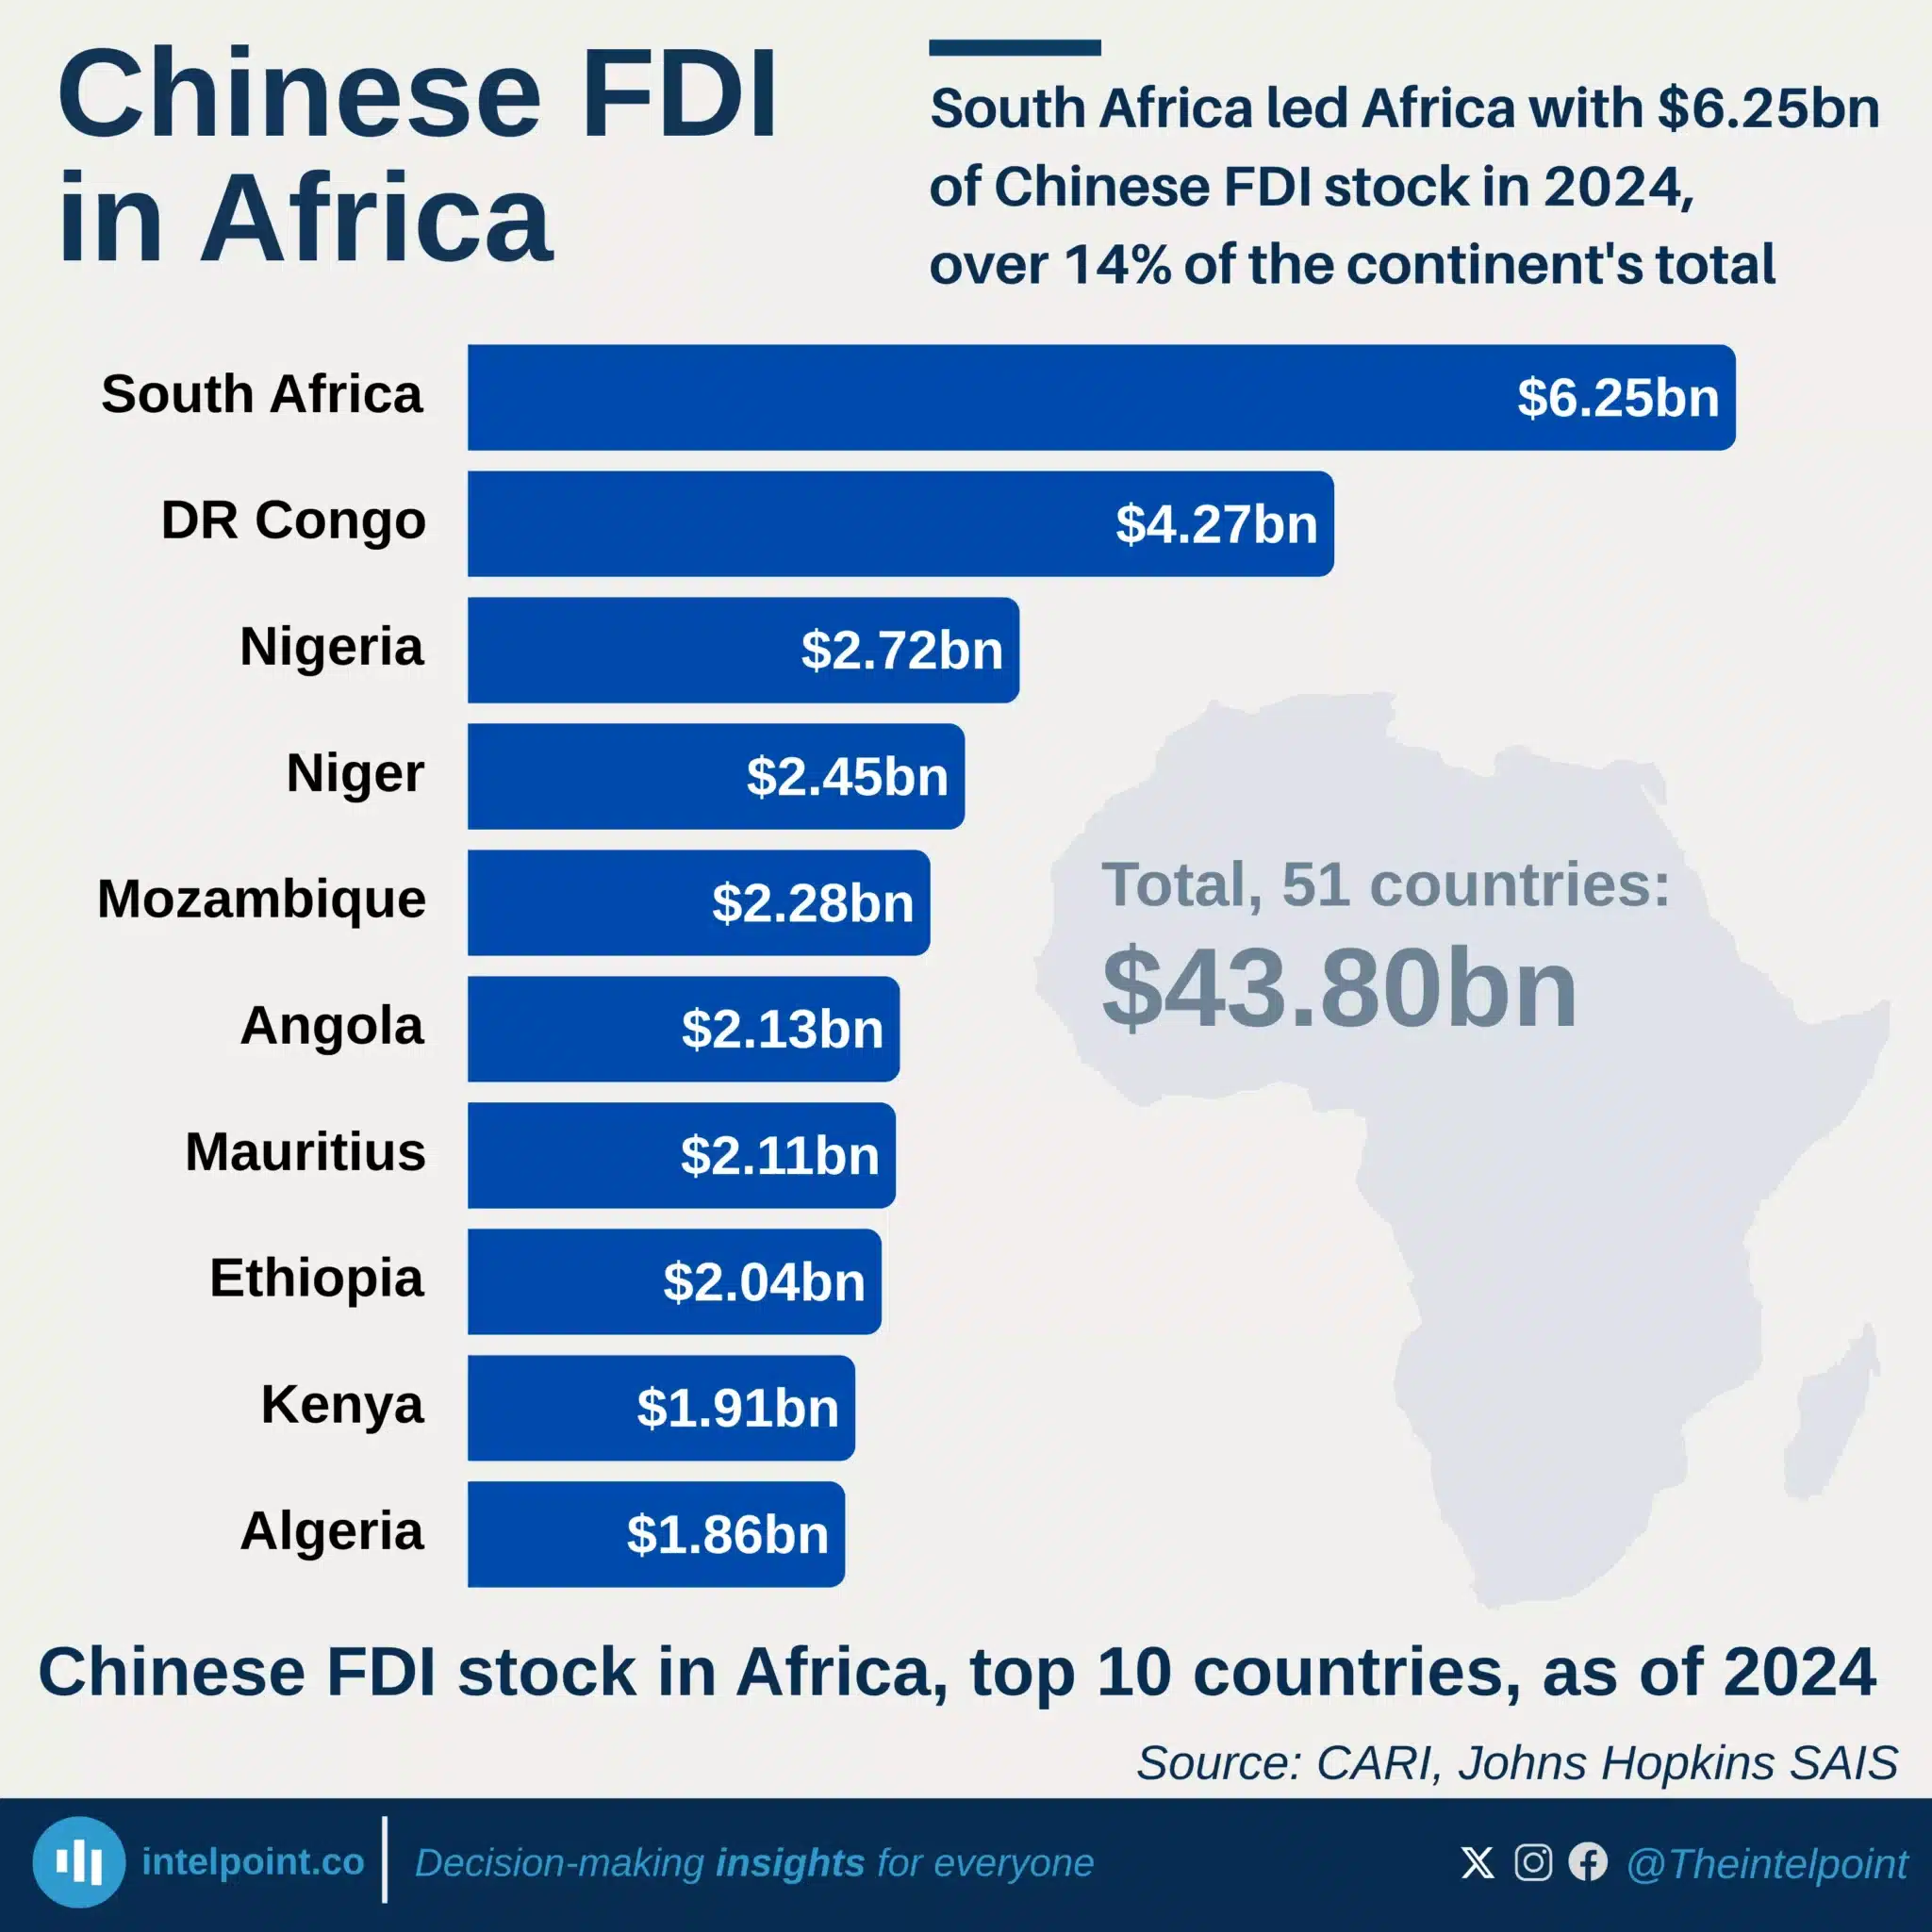
South Africa led Africa with $6.25bn of Chinese FDI stock in 2024, over 14% of the continent's total
  • South Africa held the largest Chinese FDI stock in Africa at $6.25 billion in 2024.
  • South Africa, DR Congo and Nigeria held 30% of Africa’s Chinese FDI stock.
  • The top 10 countries accounted for 64% of the continent’s total Chinese FDI stock.
  • Niger led the remaining top 10 countries with $2.45 billion, followed by Mozambique at $2.28 billion.

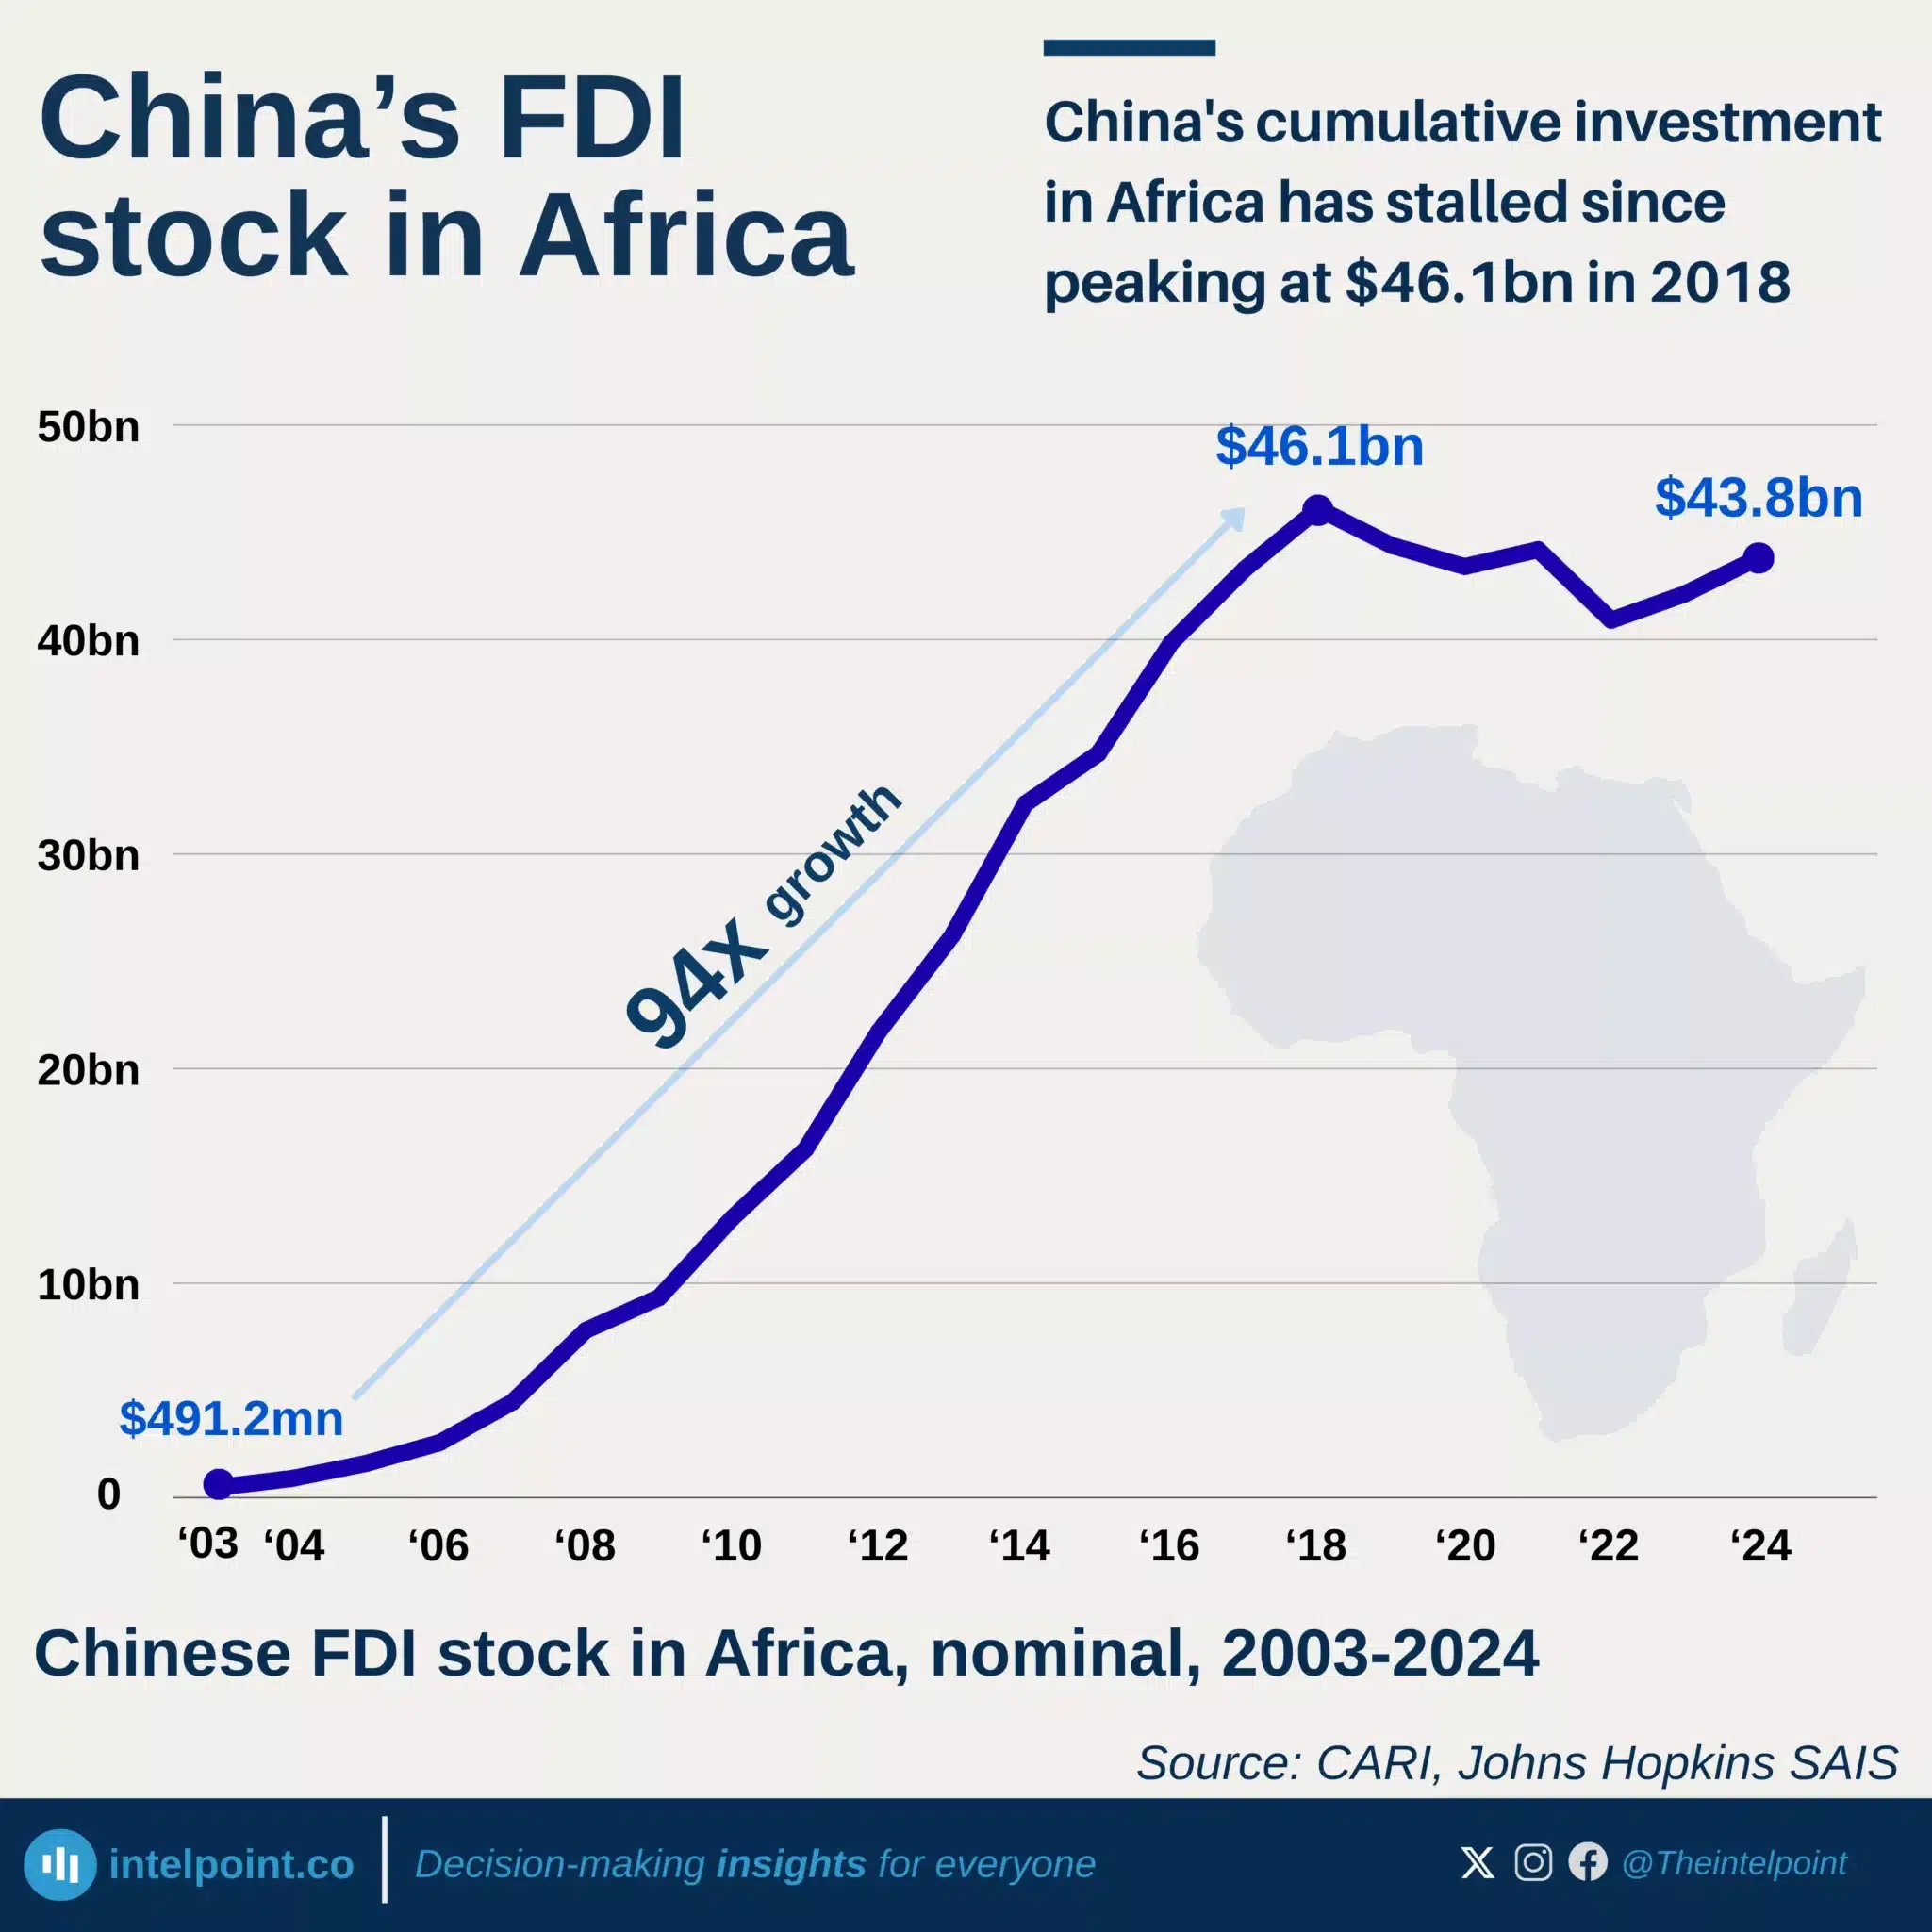
China's cumulative investment in Africa has stalled since peaking at $46.1bn in 2018
  • China's FDI stock in Africa rose 94-fold, from $491 million in 2003 to $46.1 billion in 2018.
  • By 2024, the stock had recovered to $43.8 billion, still 5% below its 2018 peak.
  • Africa accounted for just 1.4% of China's $3.14 trillion global FDI stock in 2024.
  • Nigeria's Chinese FDI stock fell from a 2017 peak of $2.86 billion to $2.72 billion in 2024.
  • African countries recorded a net $2.31 billion decline in Chinese FDI stock between 2018 and 2024.
  • Niger recorded the largest increase, from $758 million in 2018 to $2.45 billion in 2024.
  • Zambia recorded the largest decline, from $3.52 billion in 2018 to $1.70 billion in 2024.

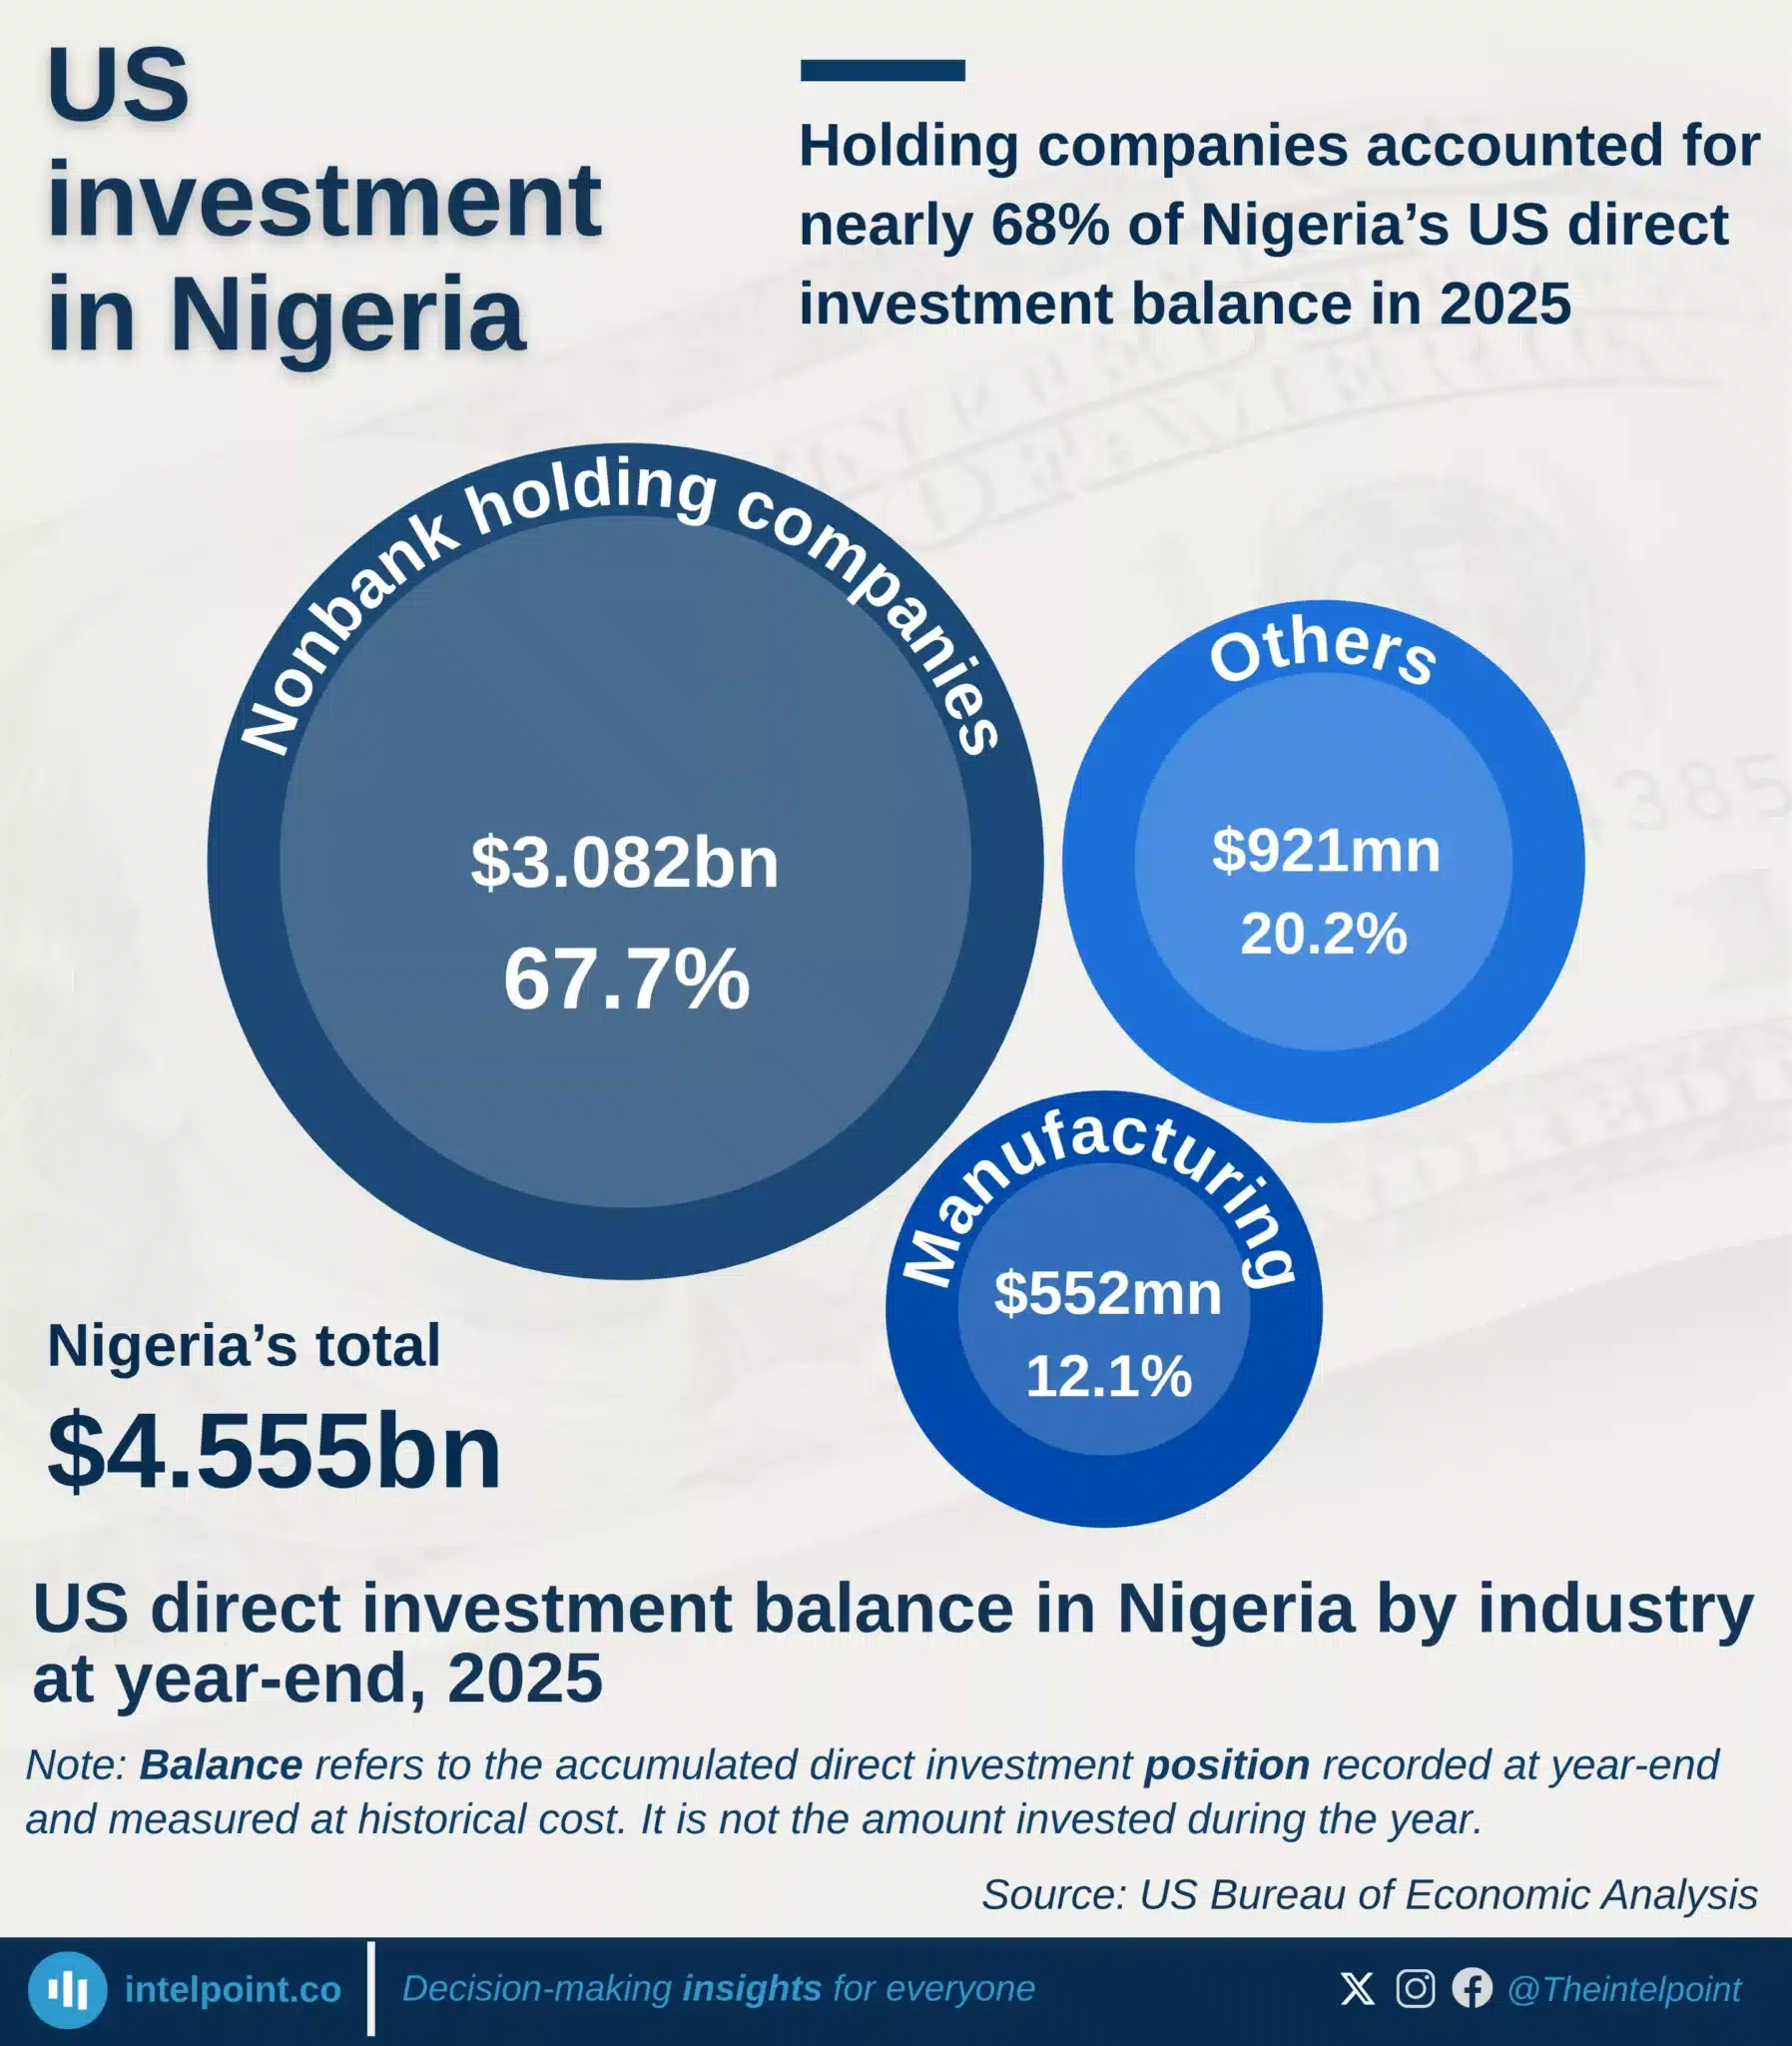
Holding companies accounted for nearly 68% of Nigeria’s US direct investment balance in 2025
  • Nigeria held Africa’s fourth-largest US direct investment balance in 2025, at $4.56 billion.
  • The balance fell by $1.98 billion from $6.54 billion in 2024, a decline of 30.3%.
  • Nonbank holding companies accounted for $3.08 billion, or 67.7% of Nigeria’s total balance.
  • Manufacturing represented $552 million, or 12.1%, while other industries accounted for $921 million.
  • Holding-company assets may ultimately be deployed in other sectors, so the classification does not show their final use.

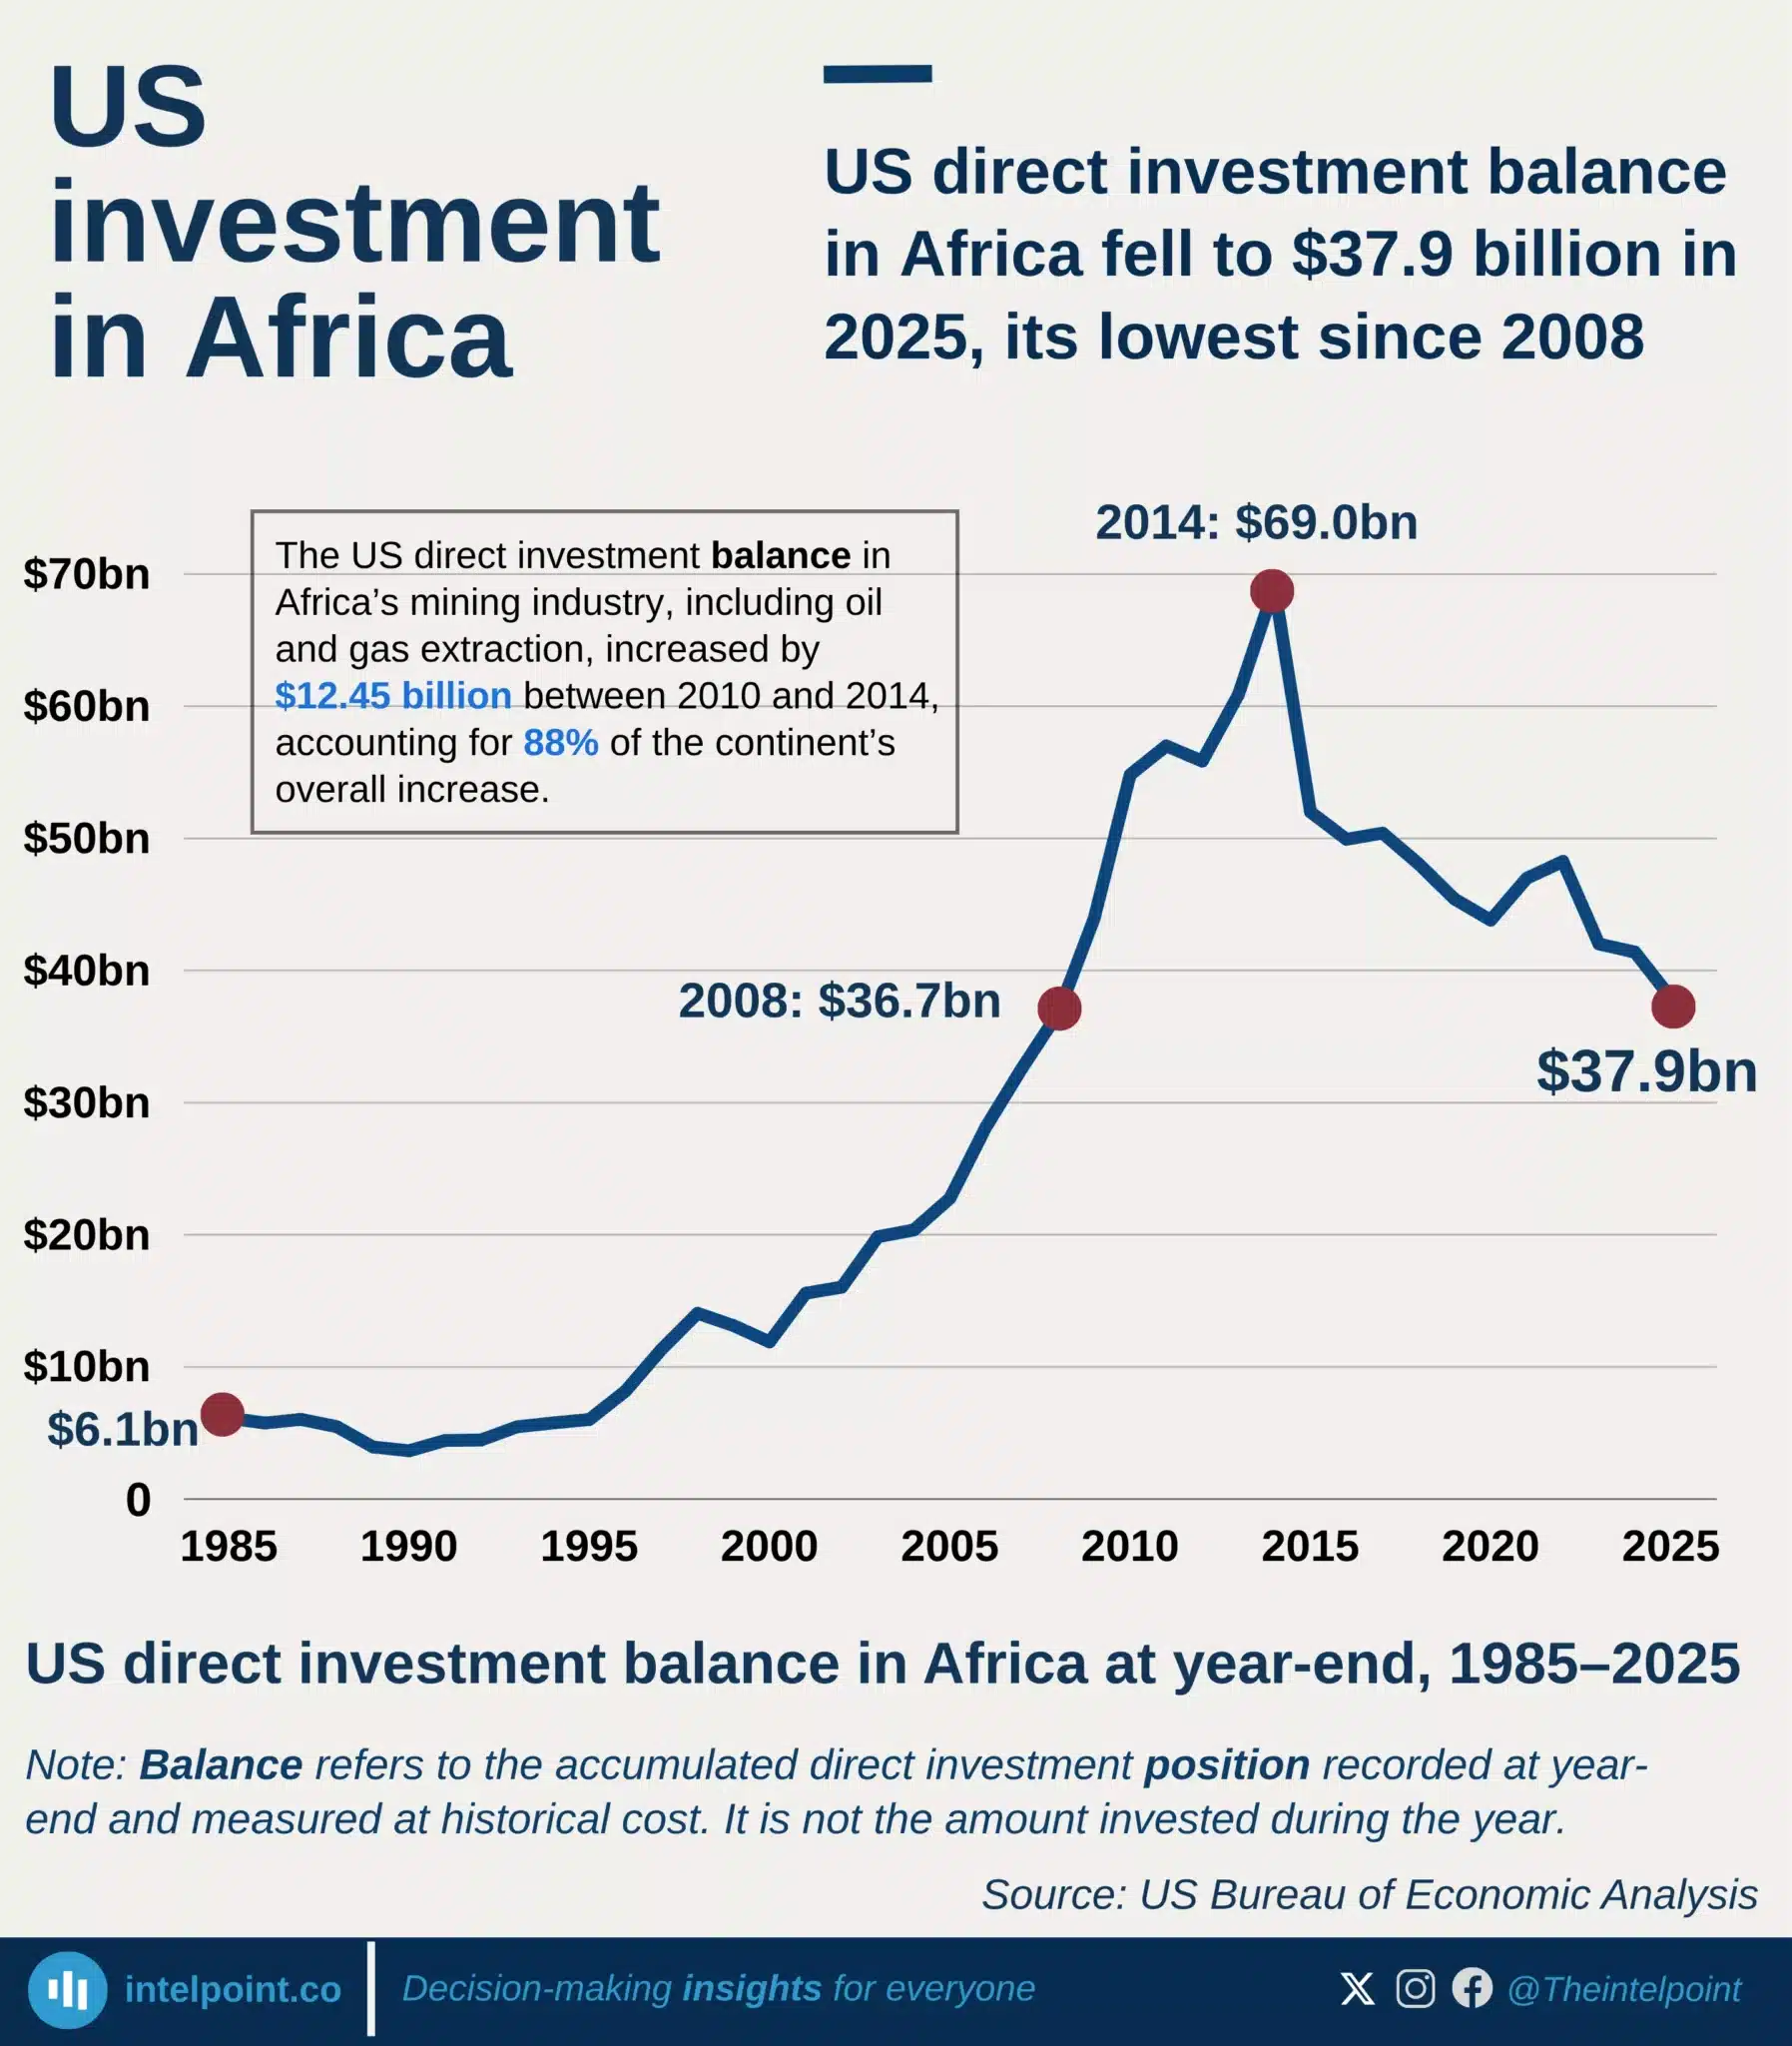
US direct investment balance in Africa fell to $37.9 billion in 2025, its lowest since 2008
  • US direct investment in Africa peaked at $69 billion in 2014 after expanding rapidly from the mid-2000s.
  • By 2025, the balance had fallen 45.1% from its peak to $37.9 billion, its lowest since 2008.
  • Mining drove the cycle, accounting for 88% of the 2010–2014 increase and 97% of the subsequent decline.
  • Africa’s share of the global US direct investment balance remained below 3% throughout 1985–2025.
  • The post-2014 decline was interrupted by brief recoveries in 2017 and 2021–2022.

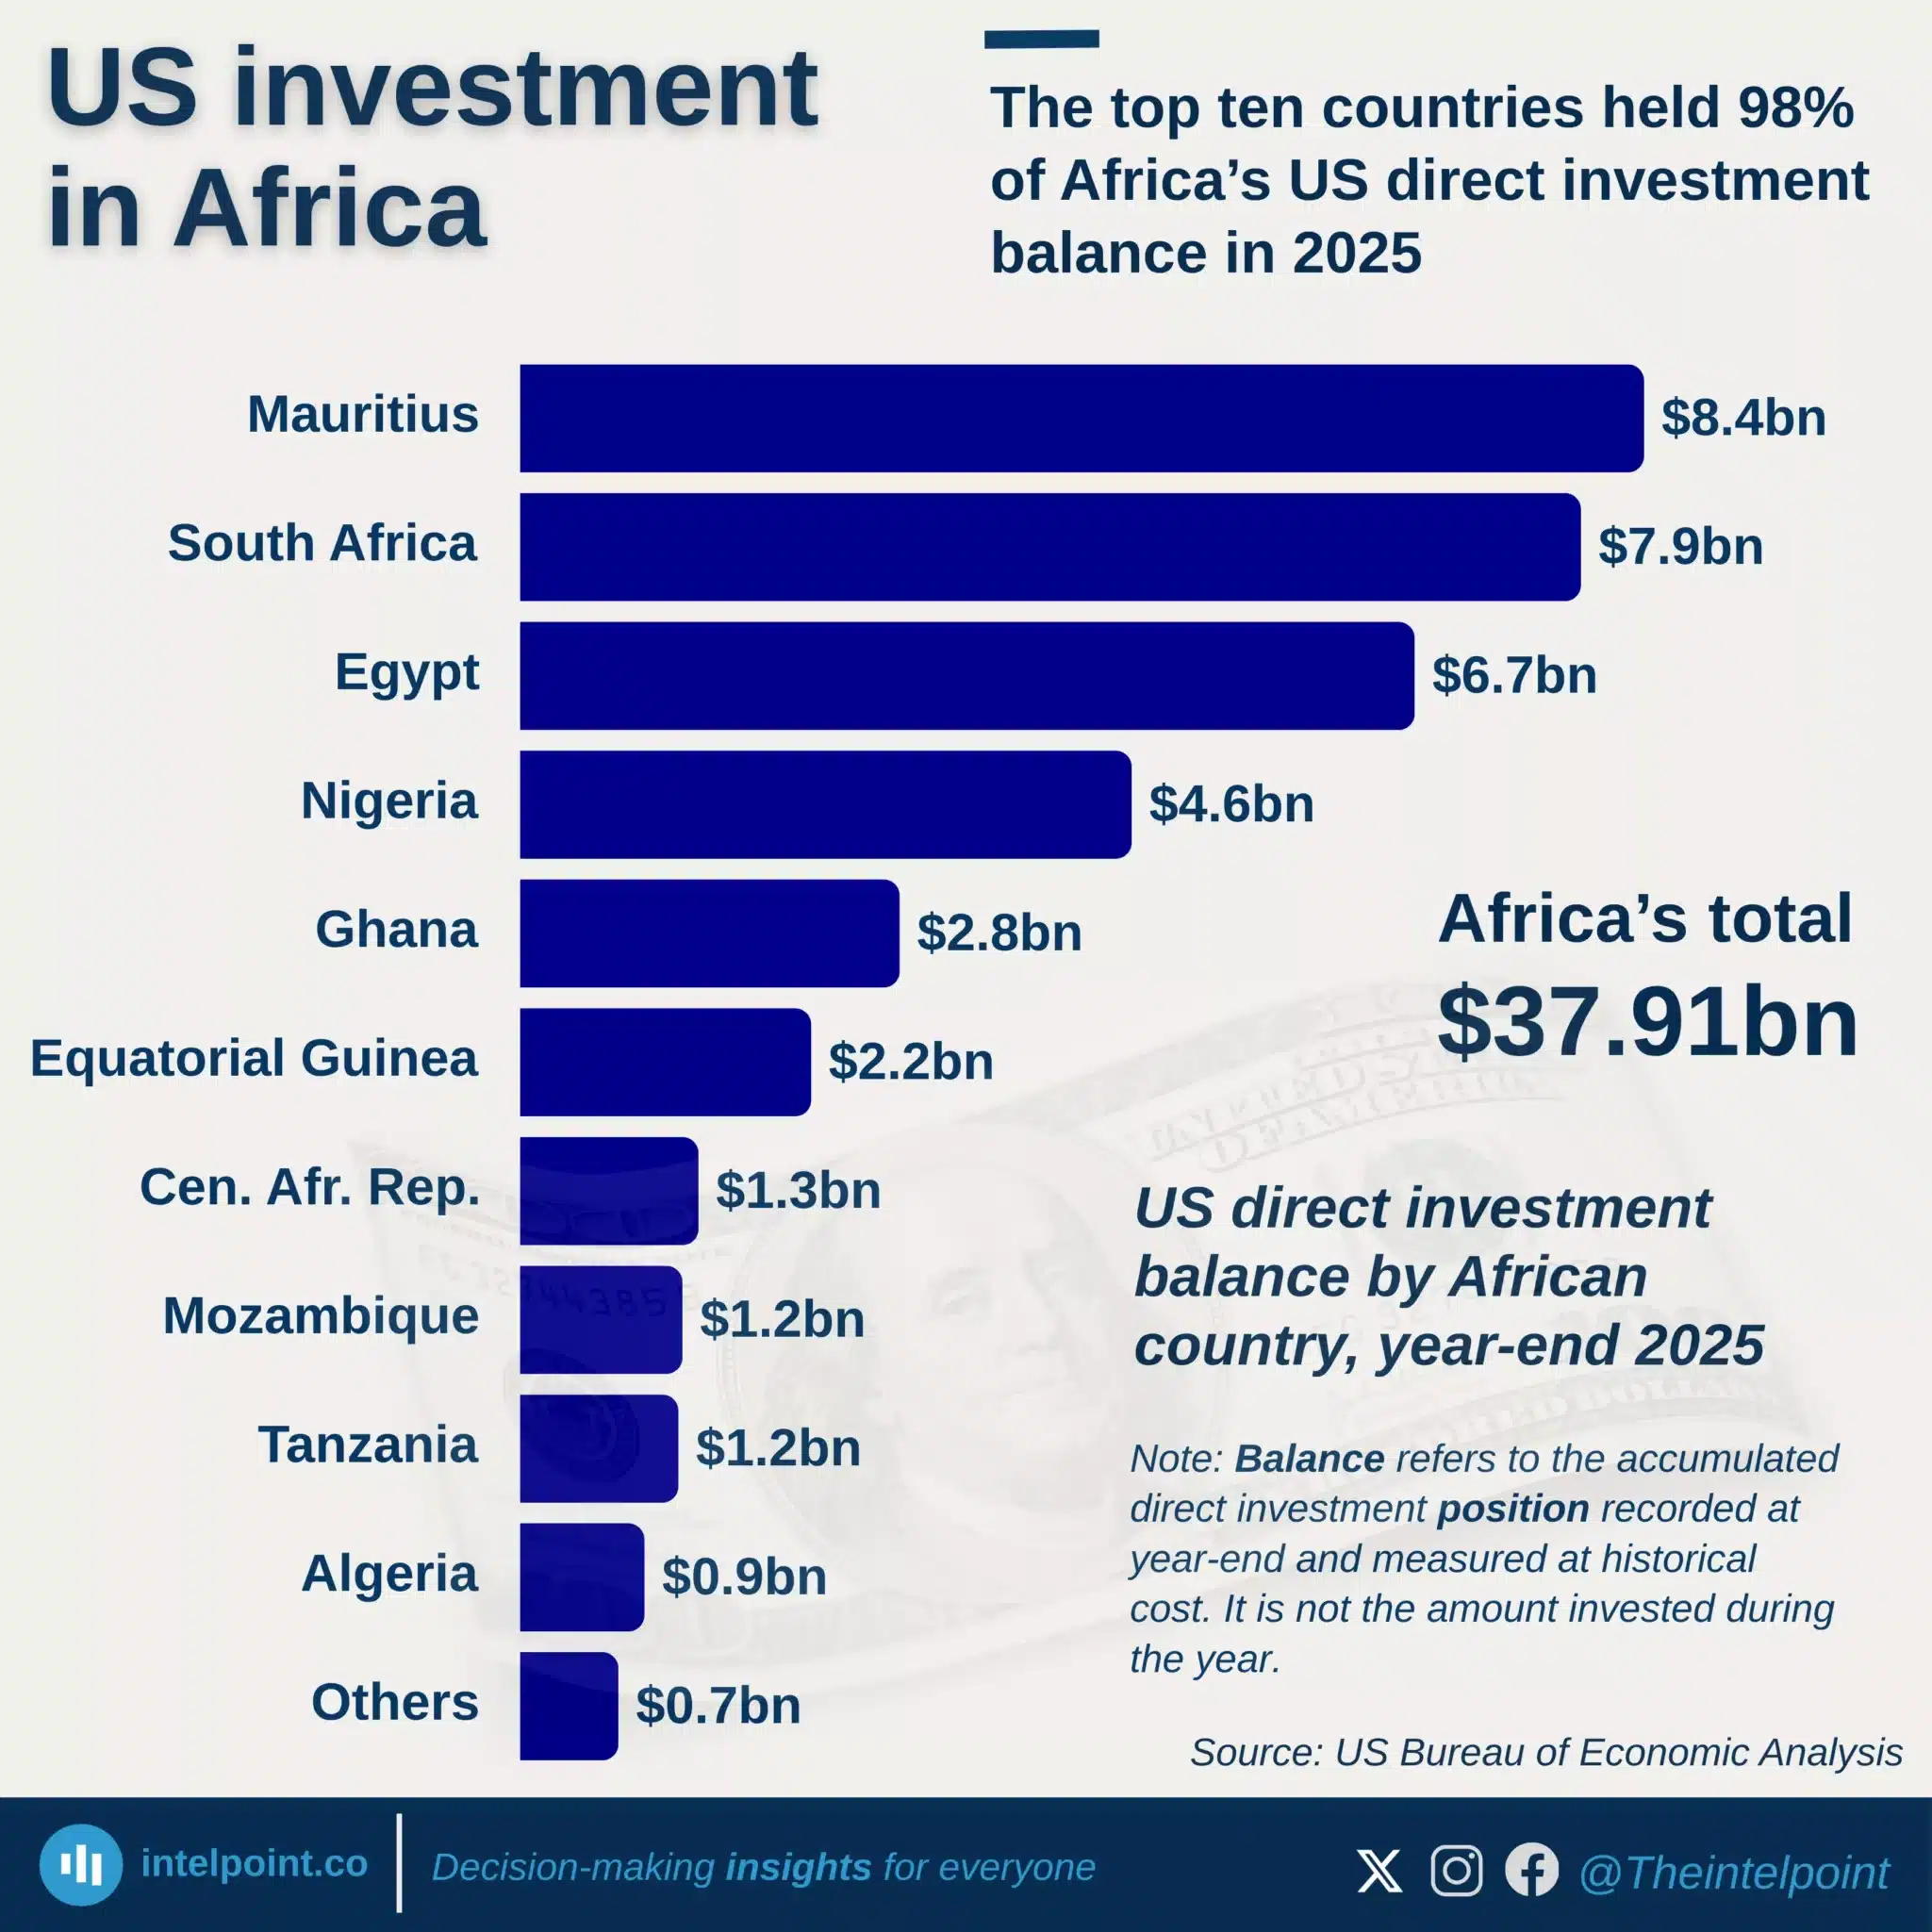
The top ten countries held 98% of Africa’s US direct investment balance in 2025
  • Mauritius held Africa’s largest US direct investment balance in 2025, at $8.4 billion.
  • South Africa followed with $7.9 billion, ahead of Egypt’s $6.7 billion and Nigeria’s $4.6 billion.
  • Africa’s total balance fell by 8.4% to $37.91 billion, its third consecutive annual decline.
  • The top ten countries held 98% of Africa’s total, leaving only $0.7 billion across the rest.
  • Manufacturing led South Africa’s balance, mining dominated Egypt’s, and holding companies accounted for most of Nigeria’s.

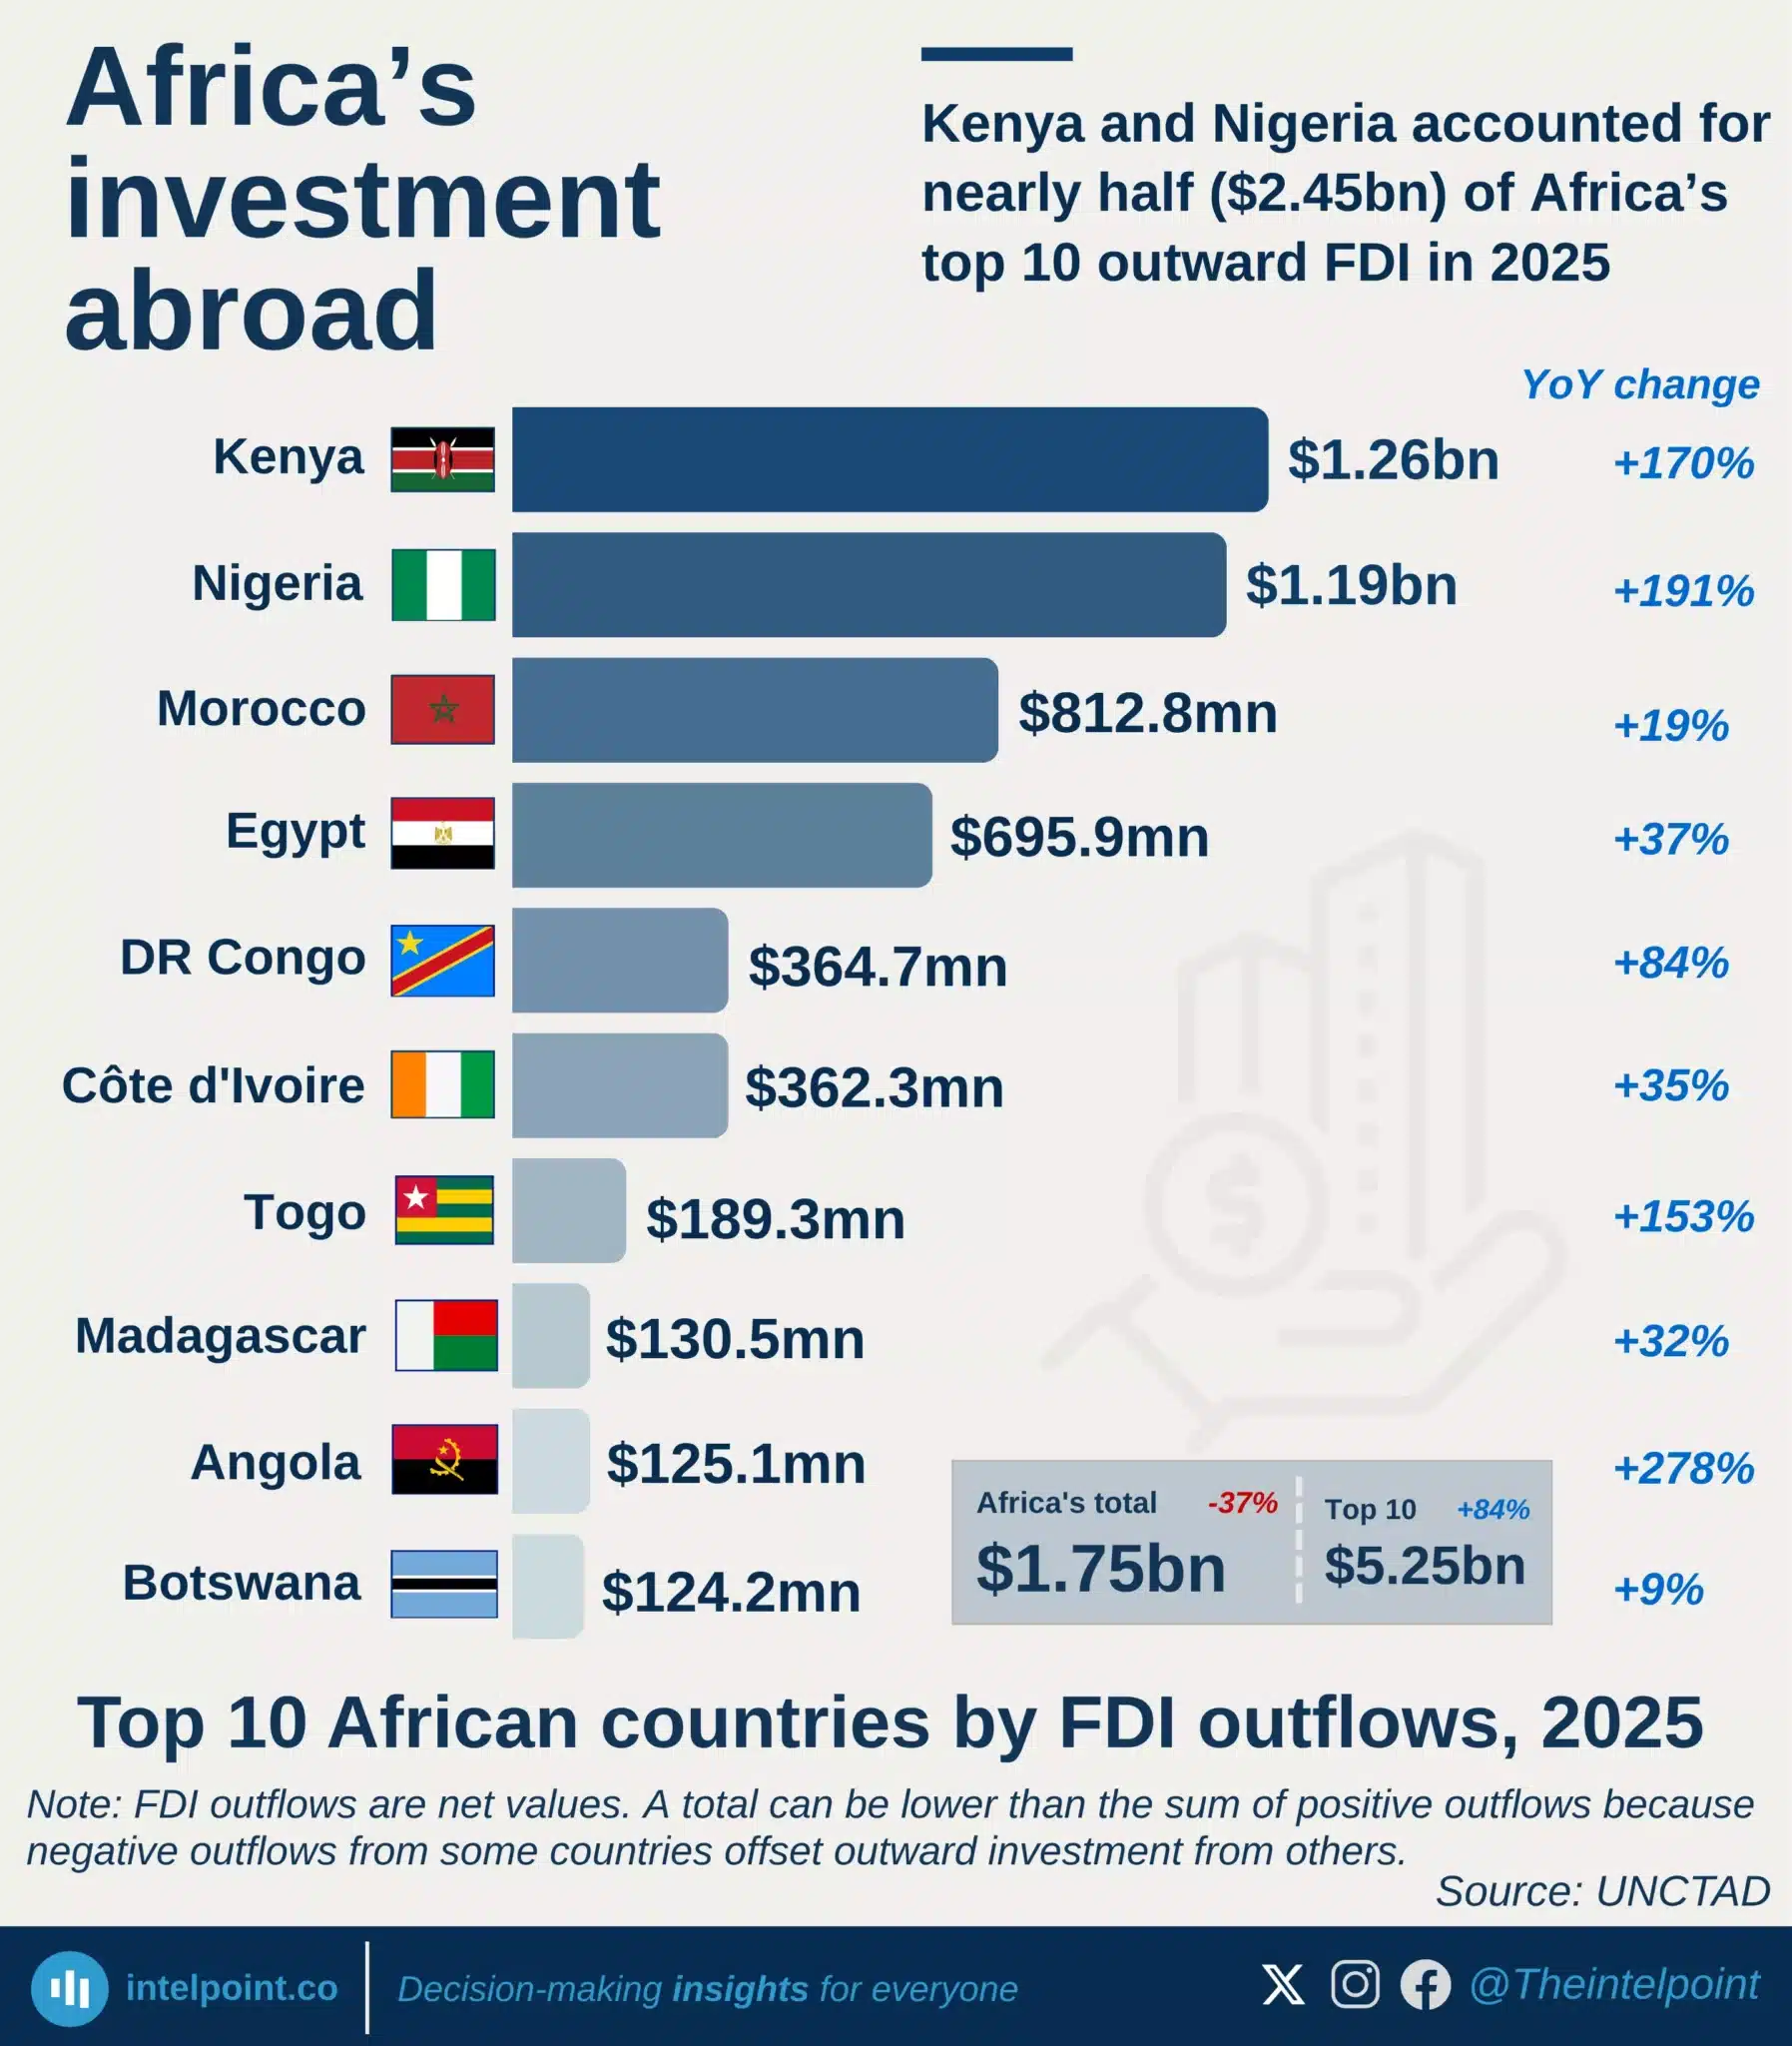
Kenya and Nigeria accounted for nearly half ($2.45bn) of Africa’s top 10 outward FDI in 2025
  • Kenya led Africa’s outward FDI in 2025, recording $1.26bn.
  • Nigeria followed closely with $1.19bn, after a 191% increase.
  • Together, Kenya and Nigeria accounted for $2.45bn of the top 10 total.
  • Morocco and Egypt completed the top four, with $812.8m and $695.9m.
  • Angola recorded the fastest growth among the top 10, rising 278%.
  • Africa’s total outflow was lower because negative outflows offset gains elsewhere.

POPULAR TOPICS
SIGN UP TO OUR NEWSLETTER
Get periodic updates about the African startup space, access to our reports, among others.
Subscribe Here
Subscription Form

A product of Techpoint Africa. All rights reserved