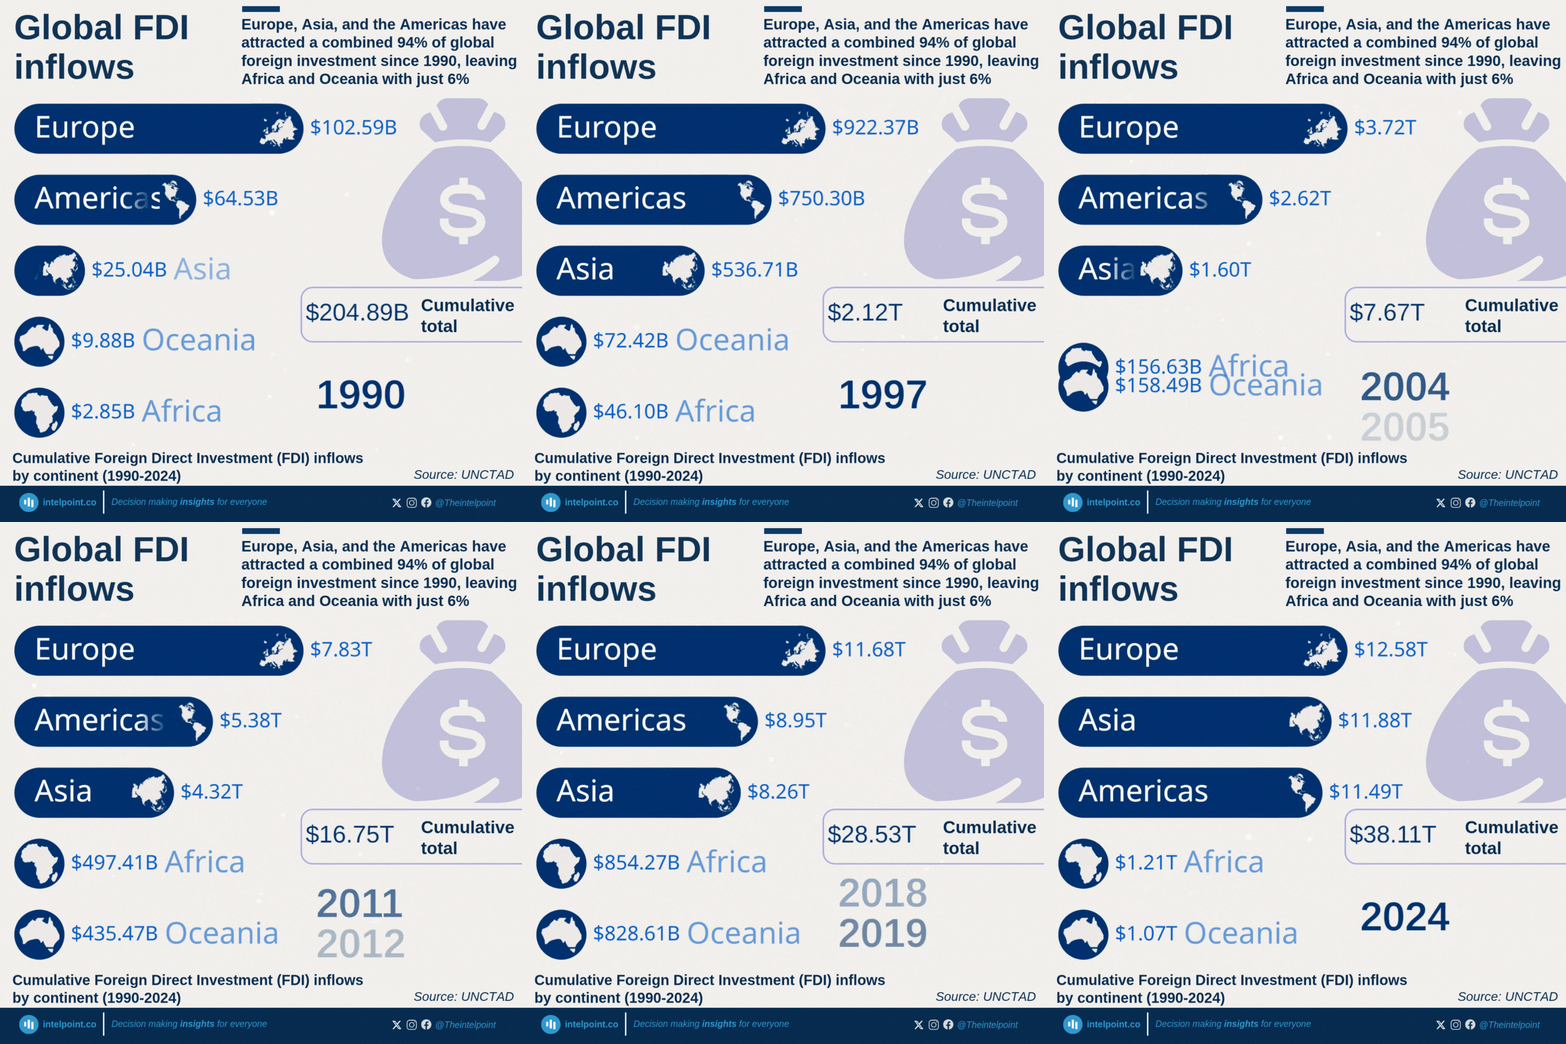
Europe, Asia, and the Americas have attracted a combined 94% of global foreign investment since 1990, leaving Africa and Oceania with just 6%

  • Europe ($12.58 trillion), Asia ($11.88 trillion), and the Americas ($11.49 trillion) are nearly tied after 35 years, each capturing roughly a third of global FDI
  • Asia grew from just $25 billion annually in 1990 to consistently attracting $600-700 billion per year, showing the most stable growth pattern
  • Major crises (2001, 2008-09, 2020, and 2022) caused dramatic swings, with Europe even recording negative flows in 2022
  • Africa and Oceania combined received just 6% of total FDI, remaining far behind despite Africa's recent acceleration to $97 billion in 2024

Over the past 35 years, global foreign direct investment has been dominated by a tight race between Europe, Asia, and the Americas, each attracting over $11 trillion in cumulative FDI inflows.

Europe maintained a narrow lead at $12.58 trillion despite extreme volatility, including massive swings during the 2008 financial crisis and even negative flows in 2022.

Asia demonstrated the most consistent upward trajectory, growing from negligible levels in 1990 to become the second-largest recipient, at $11.88 trillion, while the Americas captured $11.49 trillion despite sharp boom-bust cycles.

Despite being home to 1.4 billion people, Africa captured only $1.21 trillion (3%), although recent growth reached $97 billion in 2024. Africa and Oceania remain distant participants in this investment race, collectively receiving less than $2.5 trillion—barely 6% of the global total—highlighting the stark regional disparities in capital flows that have shaped economic development over the past three decades.
Source:

UNCTAD, Intelpoint

Period:

1990-2024
HTML code to embed chart
Want a bespoke report?
Reach out
Tags
Related Insights

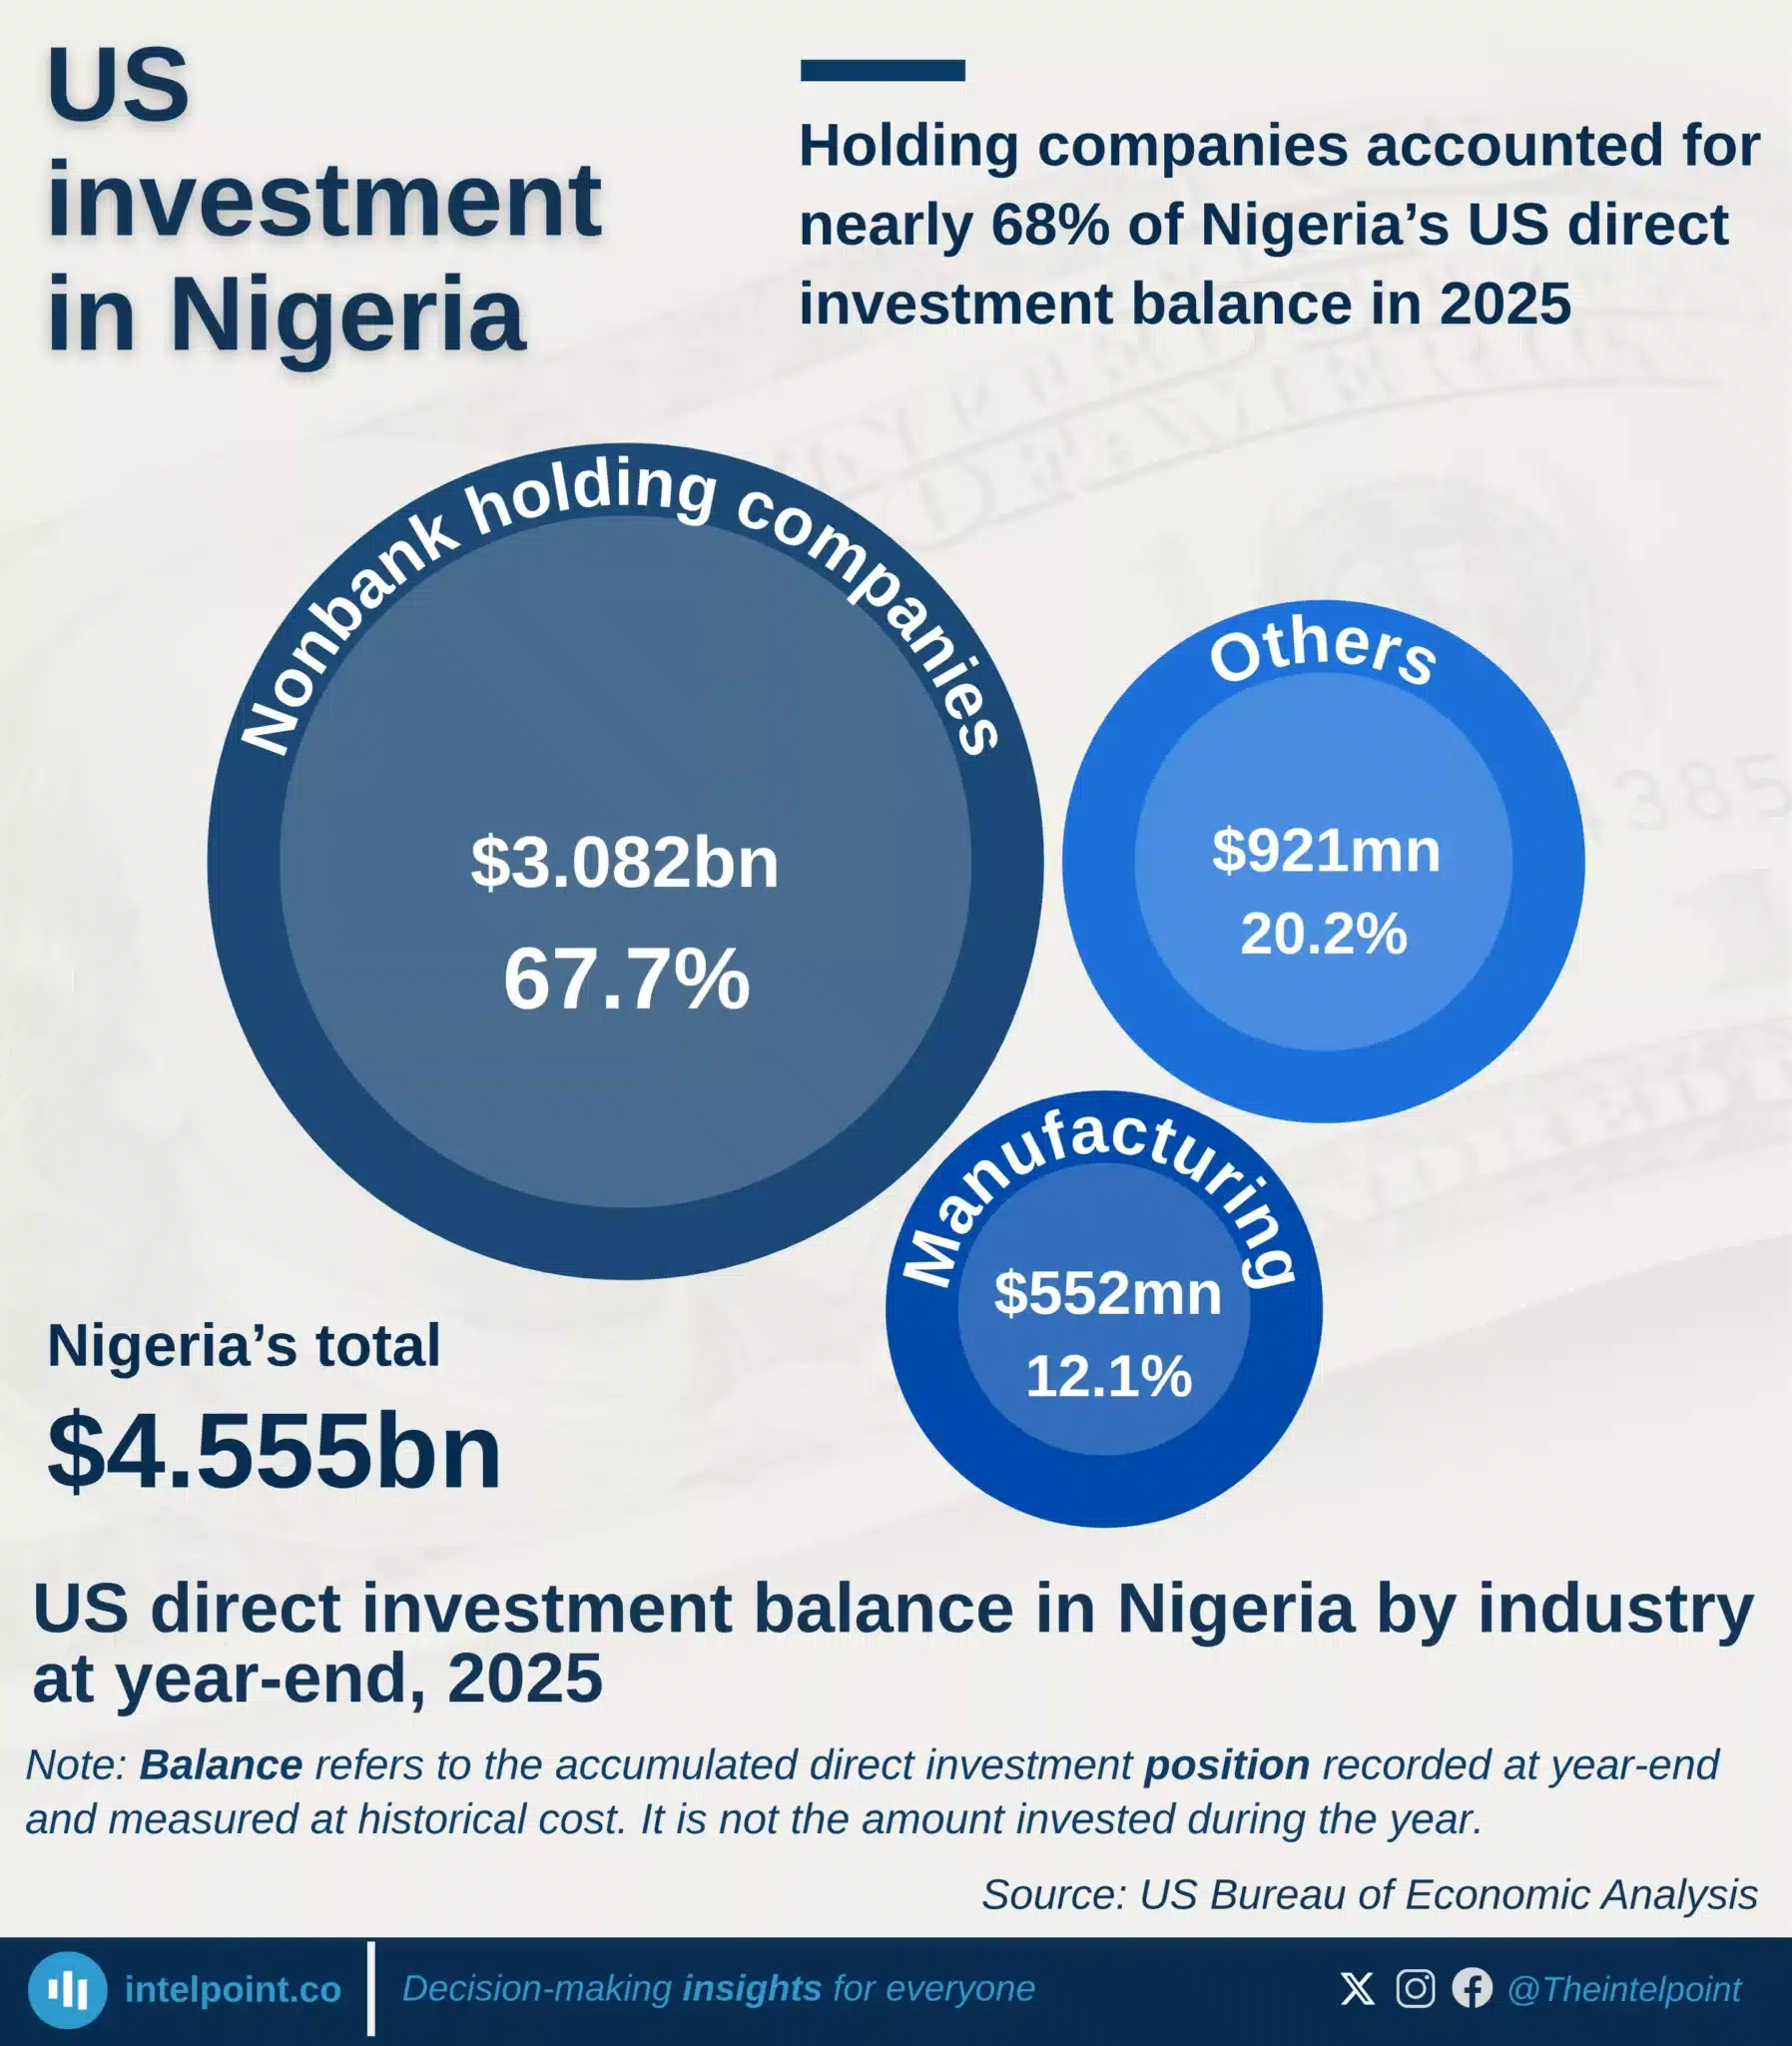
Holding companies accounted for nearly 68% of Nigeria’s US direct investment balance in 2025
  • Nigeria held Africa’s fourth-largest US direct investment balance in 2025, at $4.56 billion.
  • The balance fell by $1.98 billion from $6.54 billion in 2024, a decline of 30.3%.
  • Nonbank holding companies accounted for $3.08 billion, or 67.7% of Nigeria’s total balance.
  • Manufacturing represented $552 million, or 12.1%, while other industries accounted for $921 million.
  • Holding-company assets may ultimately be deployed in other sectors, so the classification does not show their final use.

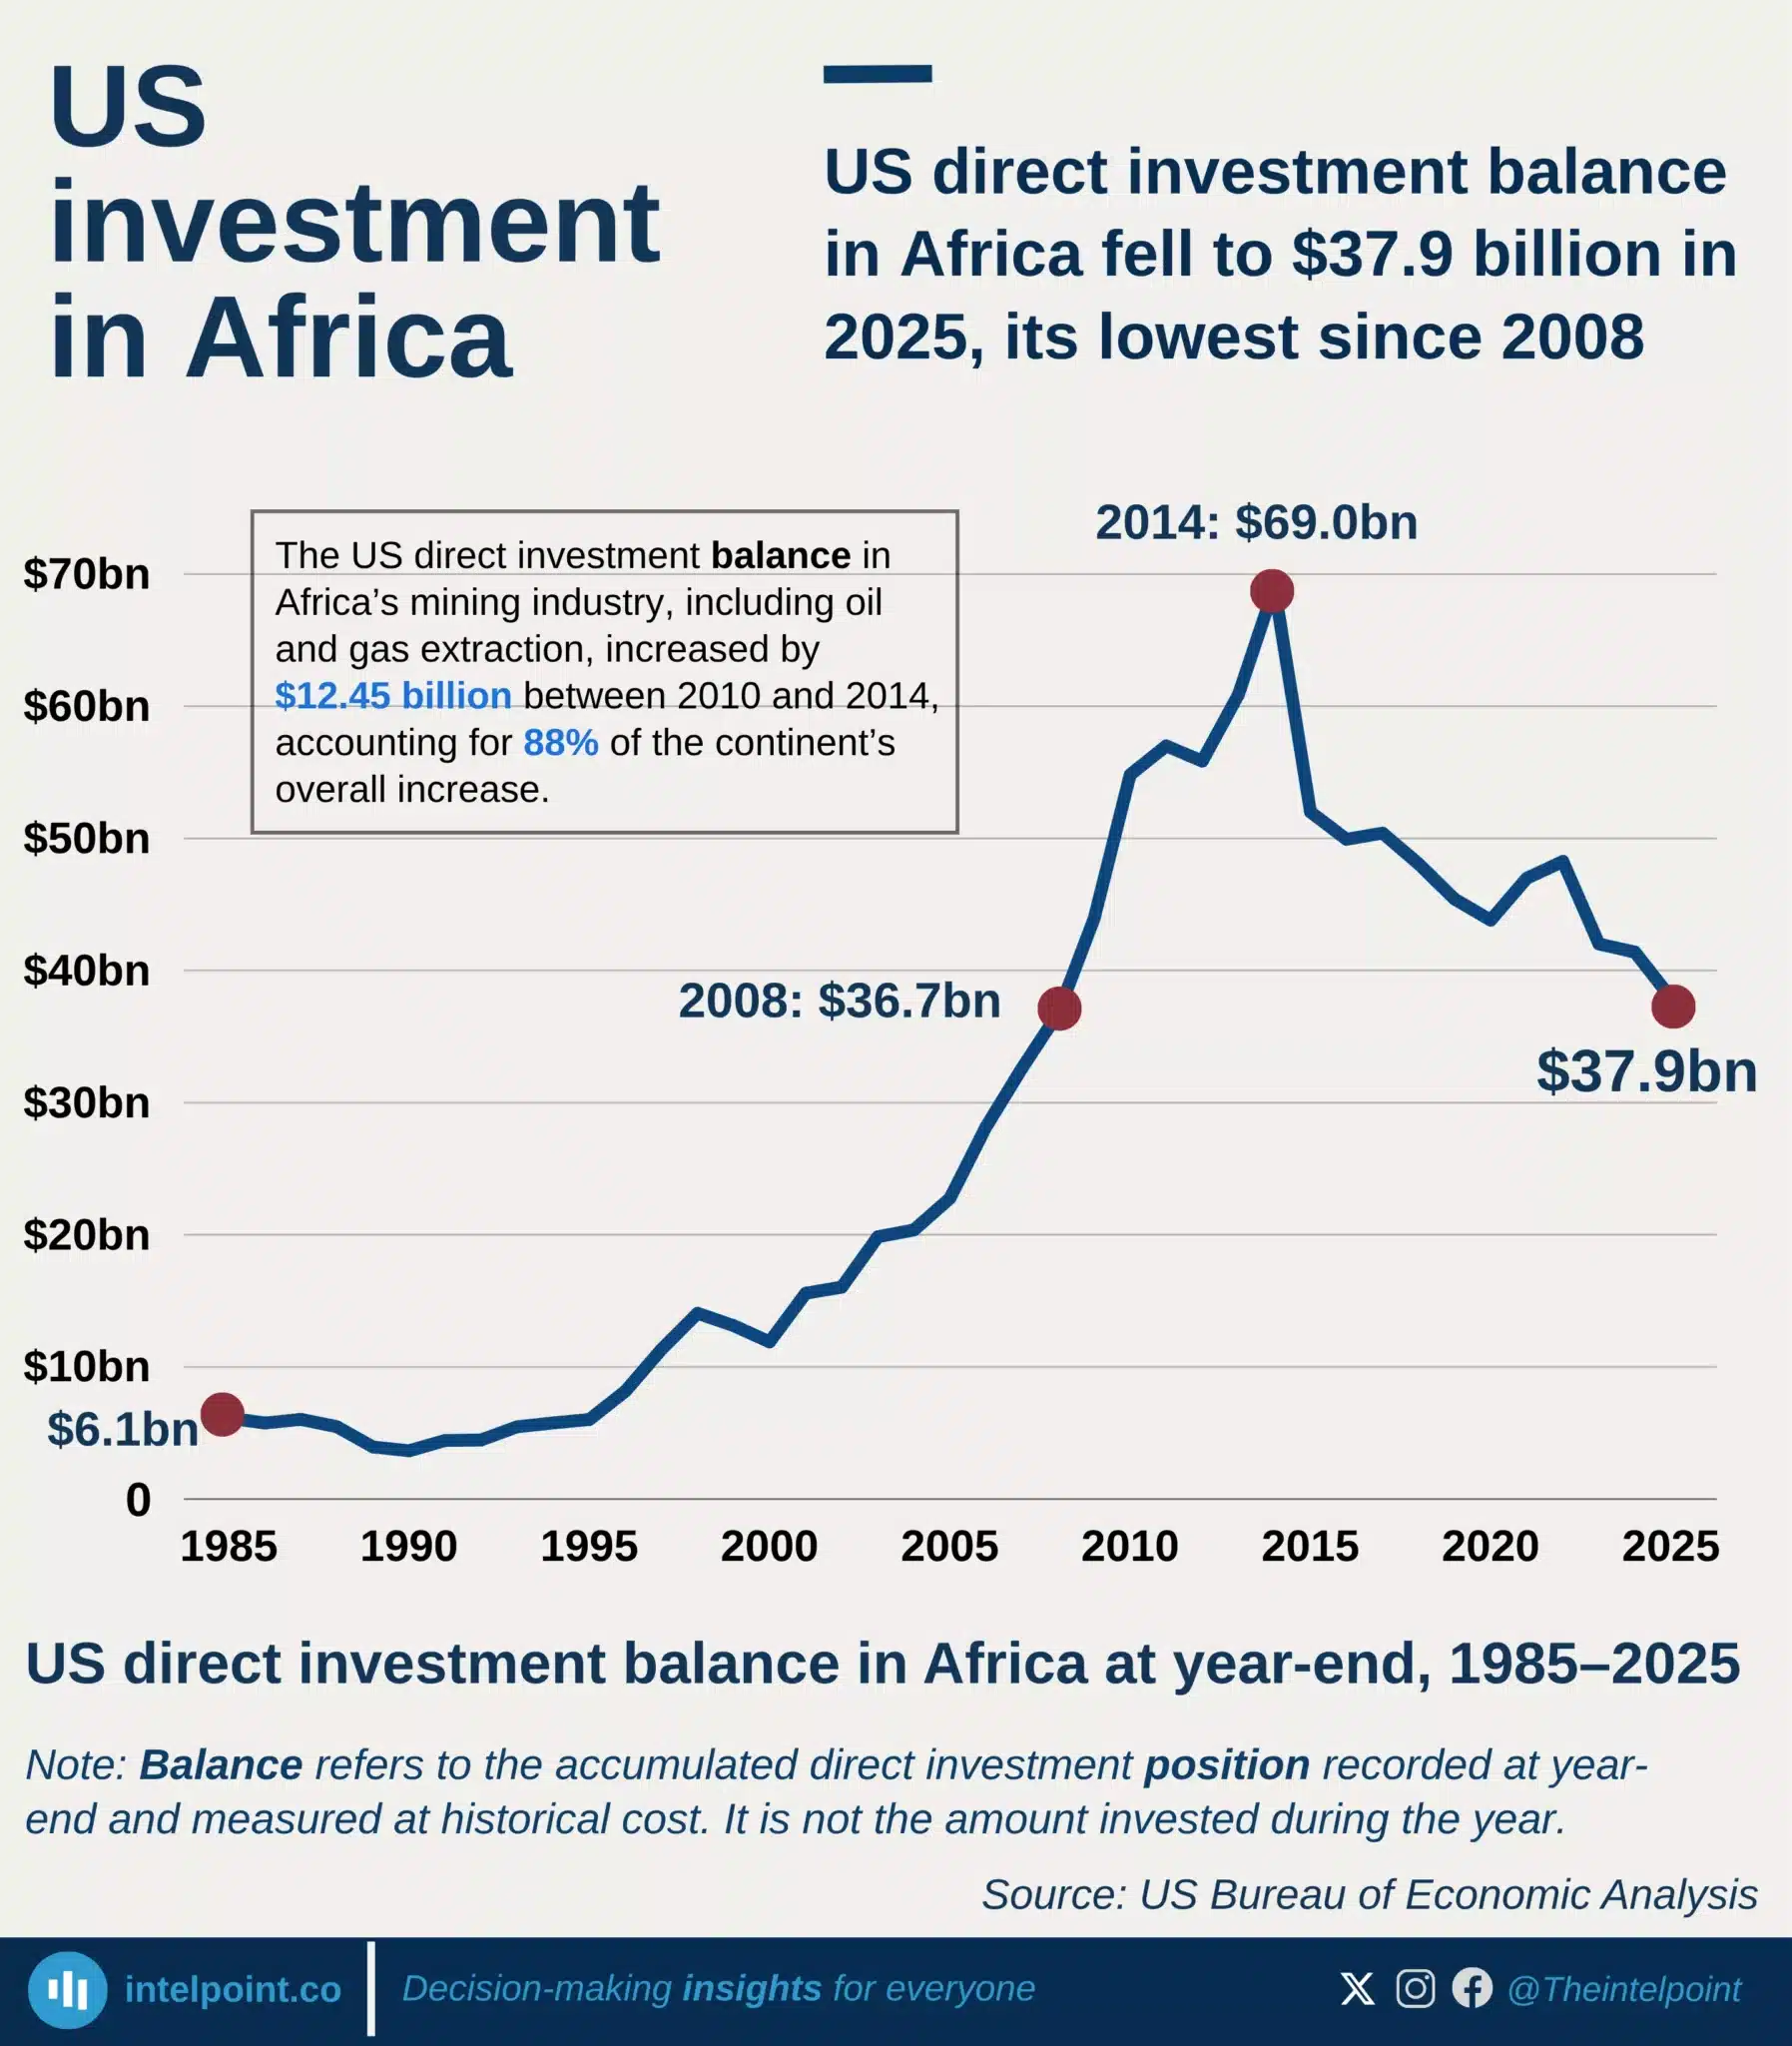
US direct investment balance in Africa fell to $37.9 billion in 2025, its lowest since 2008
  • US direct investment in Africa peaked at $69 billion in 2014 after expanding rapidly from the mid-2000s.
  • By 2025, the balance had fallen 45.1% from its peak to $37.9 billion, its lowest since 2008.
  • Mining drove the cycle, accounting for 88% of the 2010–2014 increase and 97% of the subsequent decline.
  • Africa’s share of the global US direct investment balance remained below 3% throughout 1985–2025.
  • The post-2014 decline was interrupted by brief recoveries in 2017 and 2021–2022.

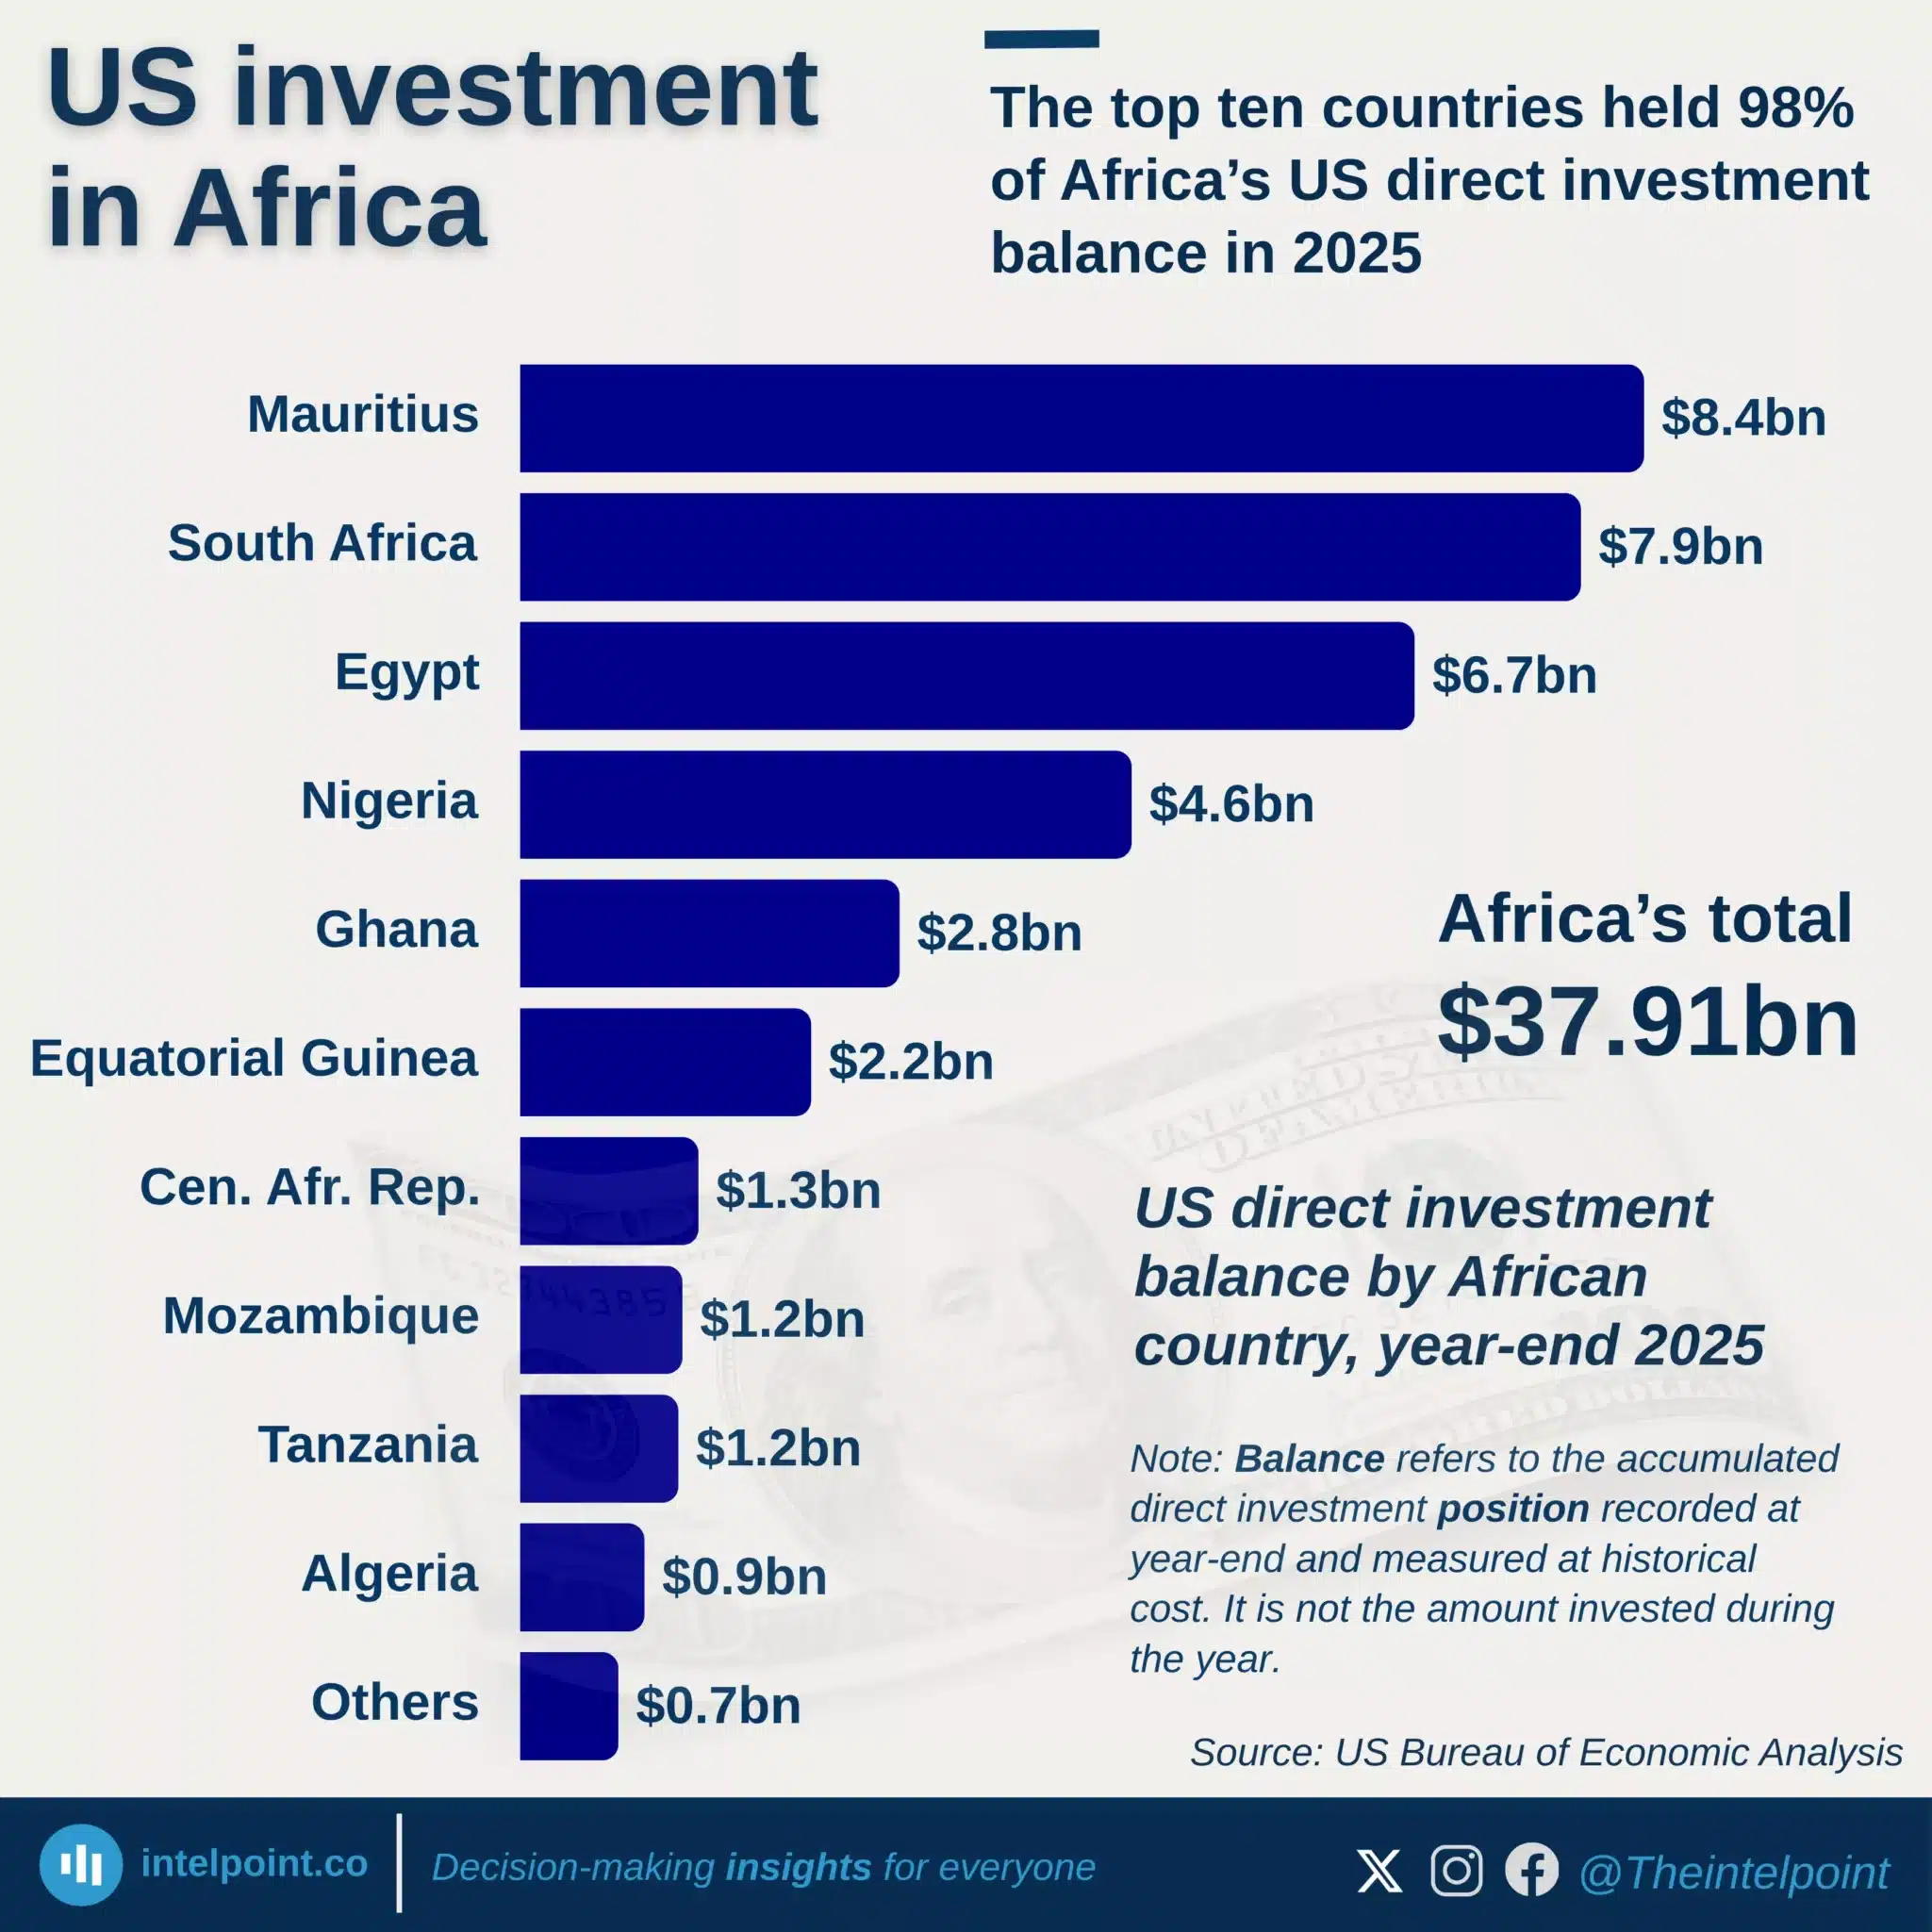
The top ten countries held 98% of Africa’s US direct investment balance in 2025
  • Mauritius held Africa’s largest US direct investment balance in 2025, at $8.4 billion.
  • South Africa followed with $7.9 billion, ahead of Egypt’s $6.7 billion and Nigeria’s $4.6 billion.
  • Africa’s total balance fell by 8.4% to $37.91 billion, its third consecutive annual decline.
  • The top ten countries held 98% of Africa’s total, leaving only $0.7 billion across the rest.
  • Manufacturing led South Africa’s balance, mining dominated Egypt’s, and holding companies accounted for most of Nigeria’s.

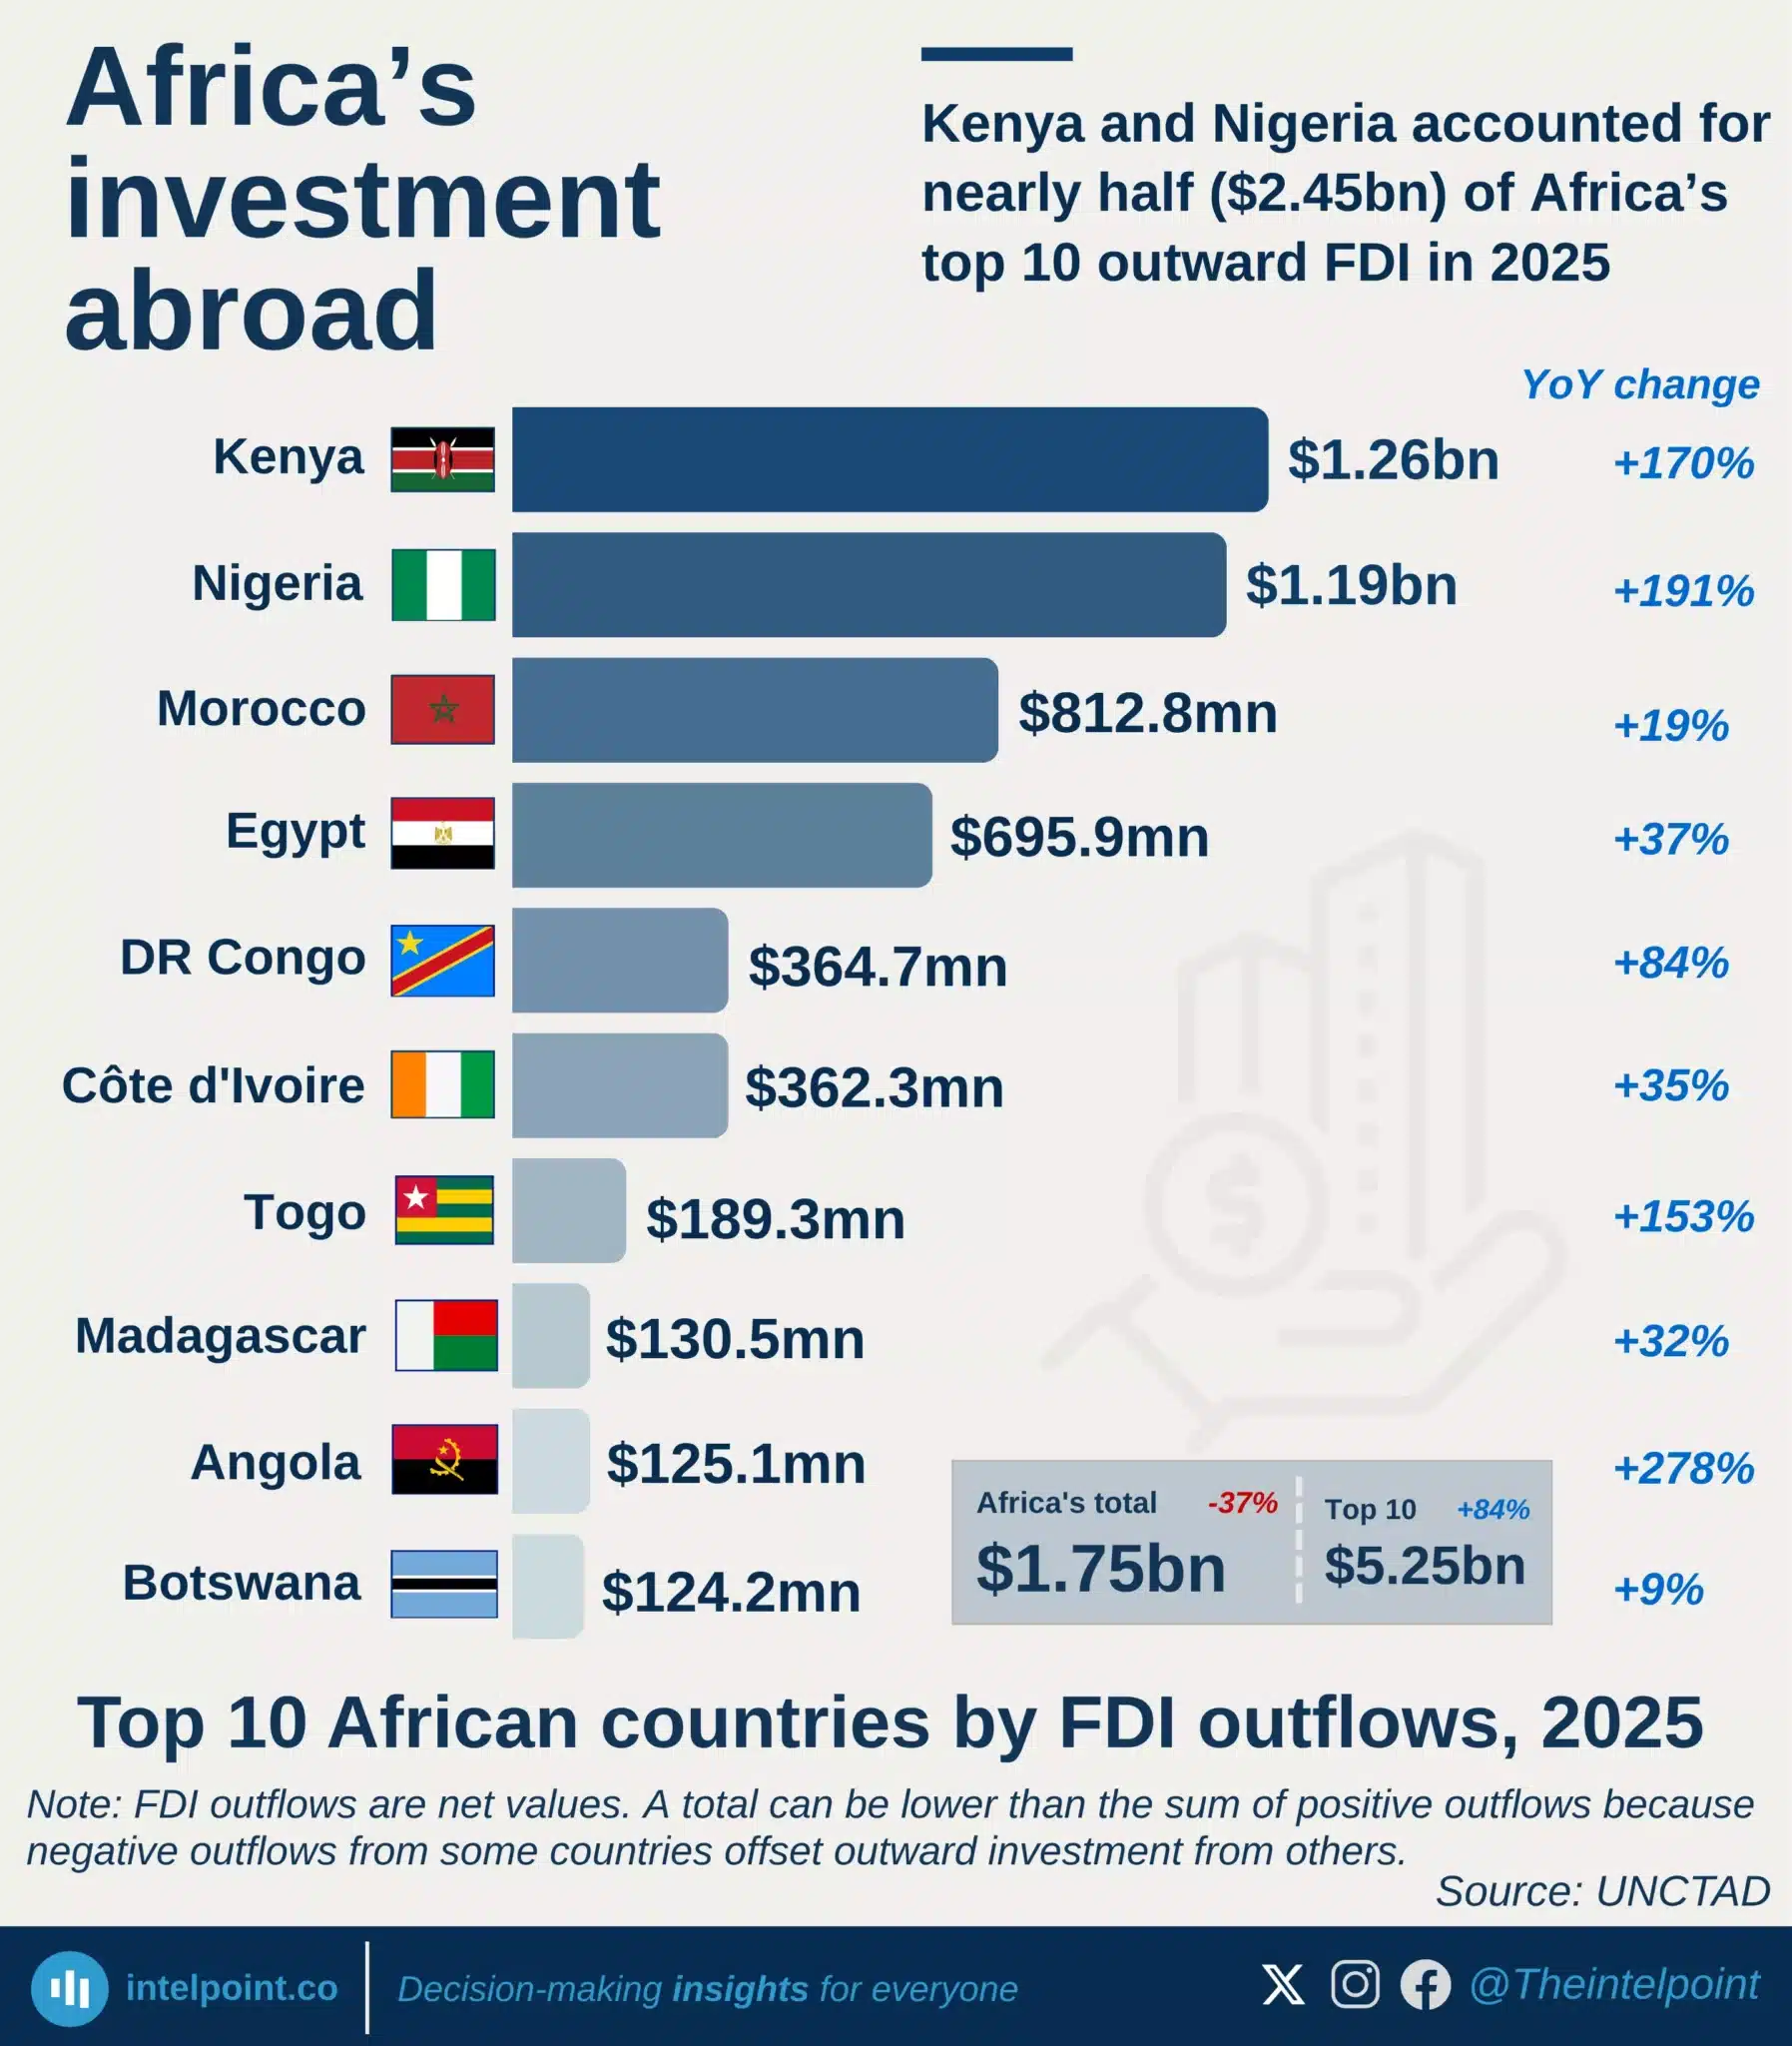
Kenya and Nigeria accounted for nearly half ($2.45bn) of Africa’s top 10 outward FDI in 2025
  • Kenya led Africa’s outward FDI in 2025, recording $1.26bn.
  • Nigeria followed closely with $1.19bn, after a 191% increase.
  • Together, Kenya and Nigeria accounted for $2.45bn of the top 10 total.
  • Morocco and Egypt completed the top four, with $812.8m and $695.9m.
  • Angola recorded the fastest growth among the top 10, rising 278%.
  • Africa’s total outflow was lower because negative outflows offset gains elsewhere.

Nigeria’s FDI inflow crossed $4bn for the first time since 2014
  • Nigeria’s FDI inflows rose to $4.01 billion in 2025, the highest level since 2014.
  • The 2025 figure represents a 148% increase from the revised $1.61 billion recorded in 2024.
  • Despite the rebound, Nigeria remains far below its 2011 peak of $8.91 billion.
  • Nigeria’s strongest FDI period was 2005 to 2014, when inflows stayed above $4 billion every year.

Nigeria’s FDI inflows rose to 4th in Africa after a 148% increase, while Egypt remained the continent’s top destination
Egypt remained Africa’s top FDI destination with $15.45bn. Nigeria ranked 4th after FDI inflows rose 148% to $4.01bn. Guinea had the biggest top-10 jump, rising 454% to $7.76bn. Africa’s top 10 accounted for 73% of total FDI inflows.

POPULAR TOPICS
SIGN UP TO OUR NEWSLETTER
Get periodic updates about the African startup space, access to our reports, among others.
Subscribe Here
Subscription Form

A product of Techpoint Africa. All rights reserved