Mineral fuels dominate China’s imports from Nigeria, accounting for nearly 60% of the total trade value

Key Takeaways:

  • In 2023, China imported $1.41 billion worth of mineral fuels and oils from Nigeria, making it the leading import category.
  • The top three import categories (mineral fuels, ores, and salt/earth materials) together made up nearly 89% of the total import value.
  • Nigeria’s exports to China are largely raw materials and natural resources, with minimal contribution from manufactured goods.
  • The top ten product categories accounted for almost 99% of China’s total imports from Nigeria.
  • Agricultural and animal products such as oil seeds, raw hides, and spices also formed part of Nigeria’s export portfolio.
  • China’s total imports from Nigeria were valued at $2.37 billion in 2023.

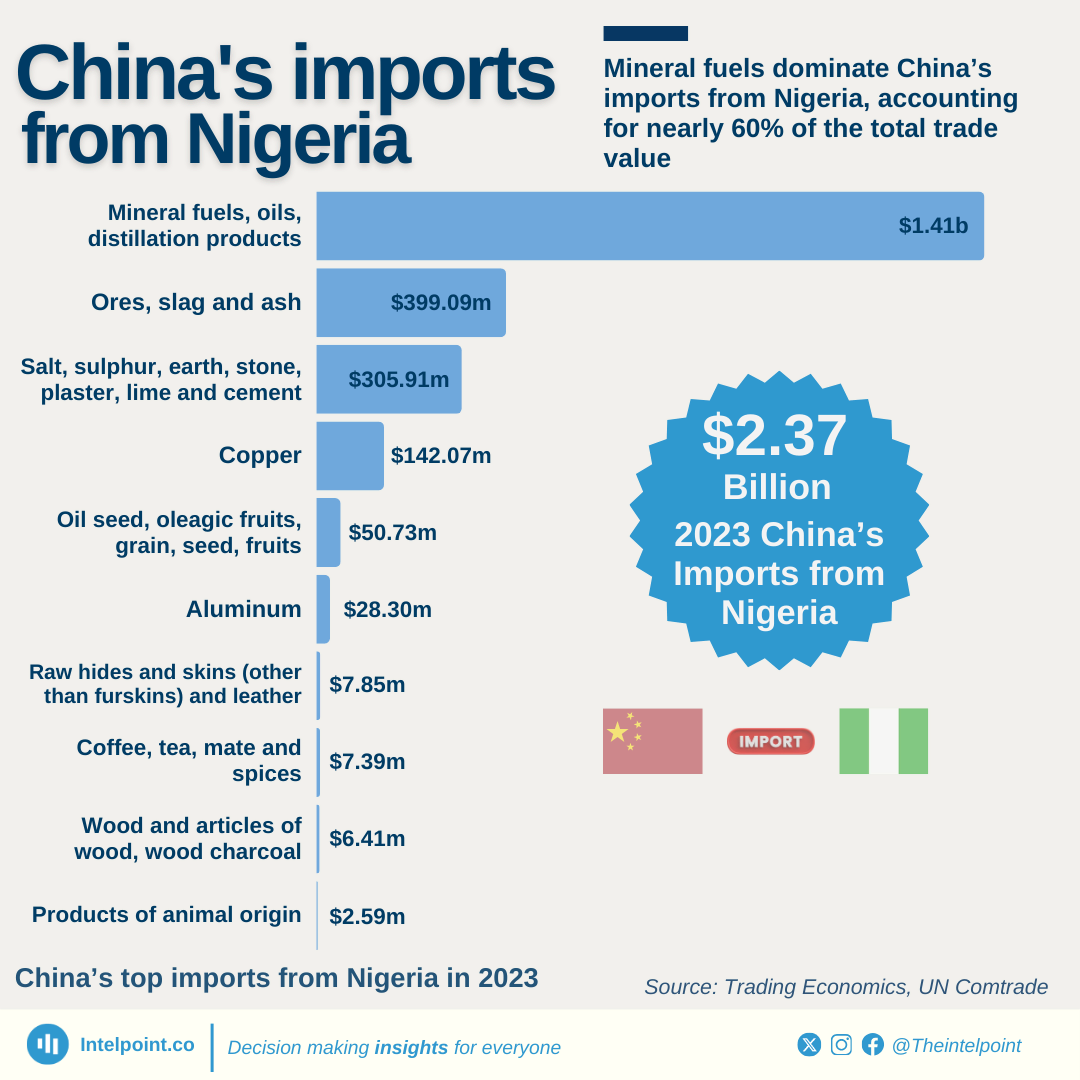
In 2023, mineral fuels, oils, and distillation products were China’s largest imports from Nigeria, valued at $1.41 billion. This was followed by imports of ores, slag, and ash, which amounted to $399.09 million, and salt, sulphur, earth, stone, plaster, lime, and cement, valued at $305.91 million. Copper imports totaled $142.07 million, reflecting China's demand for industrial inputs.

Nigeria also exported a range of agricultural and animal products to China, including oil seeds ($50.73 million), raw hides and skins ($7.85 million), and coffee, tea, maté, and spices ($7.39 million).

Source:

Trading Economics, UN Comtrade

Period:

2023
HTML code to embed chart
Want a bespoke report?
Reach out
Tags
Related Insights

Jumia’s GMV fell 37.6% between 2019 and 2024, reaching its lowest level in six years
  • Jumia's highest sales are typically recorded in the fourth quarter of the year due to Jumia Black Friday, except in 2022.
  • Black Friday sales generally run through November.
  • GMV represents the total value of orders for products and services, including shipping fees and VAT, before discounts and irrespective of cancellations or returns.
  • GMV tracks platform usage and is not influenced by whether sales are first-party or third-party, or by the payment method used.
  • The lowest GMV in six years was recorded in 2024 at $720 million.
  • A major factor behind the GMV decline is foreign exchange depreciation, as 8 out of 10 local currencies in Jumia’s markets lost value against the US dollar, especially in Nigeria.

JumiaPay adoption rose from 13.8% in 2018 to 44.4% in 2024, but remains under 50%
  • Jumia launched JumiaPay in 2016 as a third-party payment solution.
  • Jumia partnered with Mastercard in 2016, and in 2019, Mastercard invested €50 million.
  • In June 2024, Jumia ended its commercial deal with Mastercard Asia/Pacific but still accepts Mastercard as payment method.
  • JumiaPay is available in nine countries, including Nigeria, Ghana, Kenya, and Egypt.
  • The JumiaPay app offers bill payments, airtime recharge, transport ticketing, and financial services.
  • JumiaPay’s digital and financial services category is its fastest-growing by GMV.
  • JumiaPay’s highest transaction share was 44.4% in 2024.
 

Jumia’s customers fell 35.7% from its 2022 peak to 5.4M in 2024, while orders dropped 33.2% from their 2021 high
  • Jumia's highest active customers was recorded in the year 2022 with a total of 8.4 million users.
  • Jumia's highest number of orders was recorded in 2021 with a total of 39.4 million orders.
  • Jumia's lowest order record was in 2023, with numbers as low as 23.2 million, its lowest in seven years.
  • Jumia's fastest growing categories in terms of items sold are the food delivery and the FMCG, supported by the momentum of the grocery sub-category.
  • Fashion is the largest category of which orders are made in terms of items sold.
  • Jumia's largest markets are in Nigeria and Egypt.

South Africa leads as Africa’s digitally delivered services exports hit $41.3 billion in 2024, less than 1 percent of the world total
  • Africa exported $41.3 billion in digital services in 2024, less than 1 percent of the world total.
  • South Africa was the continent’s top exporter with $7.05 billion.
  • Morocco ($6.74 billion) and Ghana ($5.18 billion) followed closely.
  • Egypt ($4.03 billion) and Mauritius ($3.53 billion) also ranked among the top five.
  • The top five countries together made up about two-thirds of Africa’s exports.

For every $1 Nigeria earned from exporting digital services between 2005 and 2024, it spent almost $10 on imports
  • Nigeria exported $10.81 billion in digital services between 2005 and 2024.
  • Imports during the same period reached $105.34 billion.
  • The result was a trade deficit of $94.53 billion over 20 years.
  • Exports rose from just $40 million in 2005 to $1.55 billion in 2024.
  • Imports were almost ten times larger than exports, showing a persistent imbalance.

Financial services dominated Nigeria’s $1.5bn digital services exports in 2024
  • Financial services dominate Nigeria’s digitally delivered exports, contributing $1.15bn (over 74%).
  • Telecommunications ($184m) and insurance & pension services ($147m) follow, though far smaller.
  • Computer, information, and IP services registered almost no exports, highlighting untapped digital potential.
  • Nigeria’s digital exports remain highly concentrated in finance, leaving other sub-sectors underdeveloped.

POPULAR TOPICS
SIGN UP TO OUR NEWSLETTER
Get periodic updates about the African startup space, access to our reports, among others.
Subscribe Here
Subscription Form

A product of Techpoint Africa. All rights reserved