China's top 10 African export destinations take about 66% of its exports to the continent in 2025

Key Takeaways

  • Nigeria leads by a clear margin, receiving the highest export value at $24.91bn.
  • Large, diversified economies dominate the top tier, with South Africa and Egypt ranking among the biggest destinations.
  • Resource-linked trade remains significant, with countries like Liberia and Algeria absorbing substantial export value.
  • Trade reach is geographically diverse, spanning West, East, and North Africa, including GhanaTanzaniaKenyaMorocco, and Guinea.

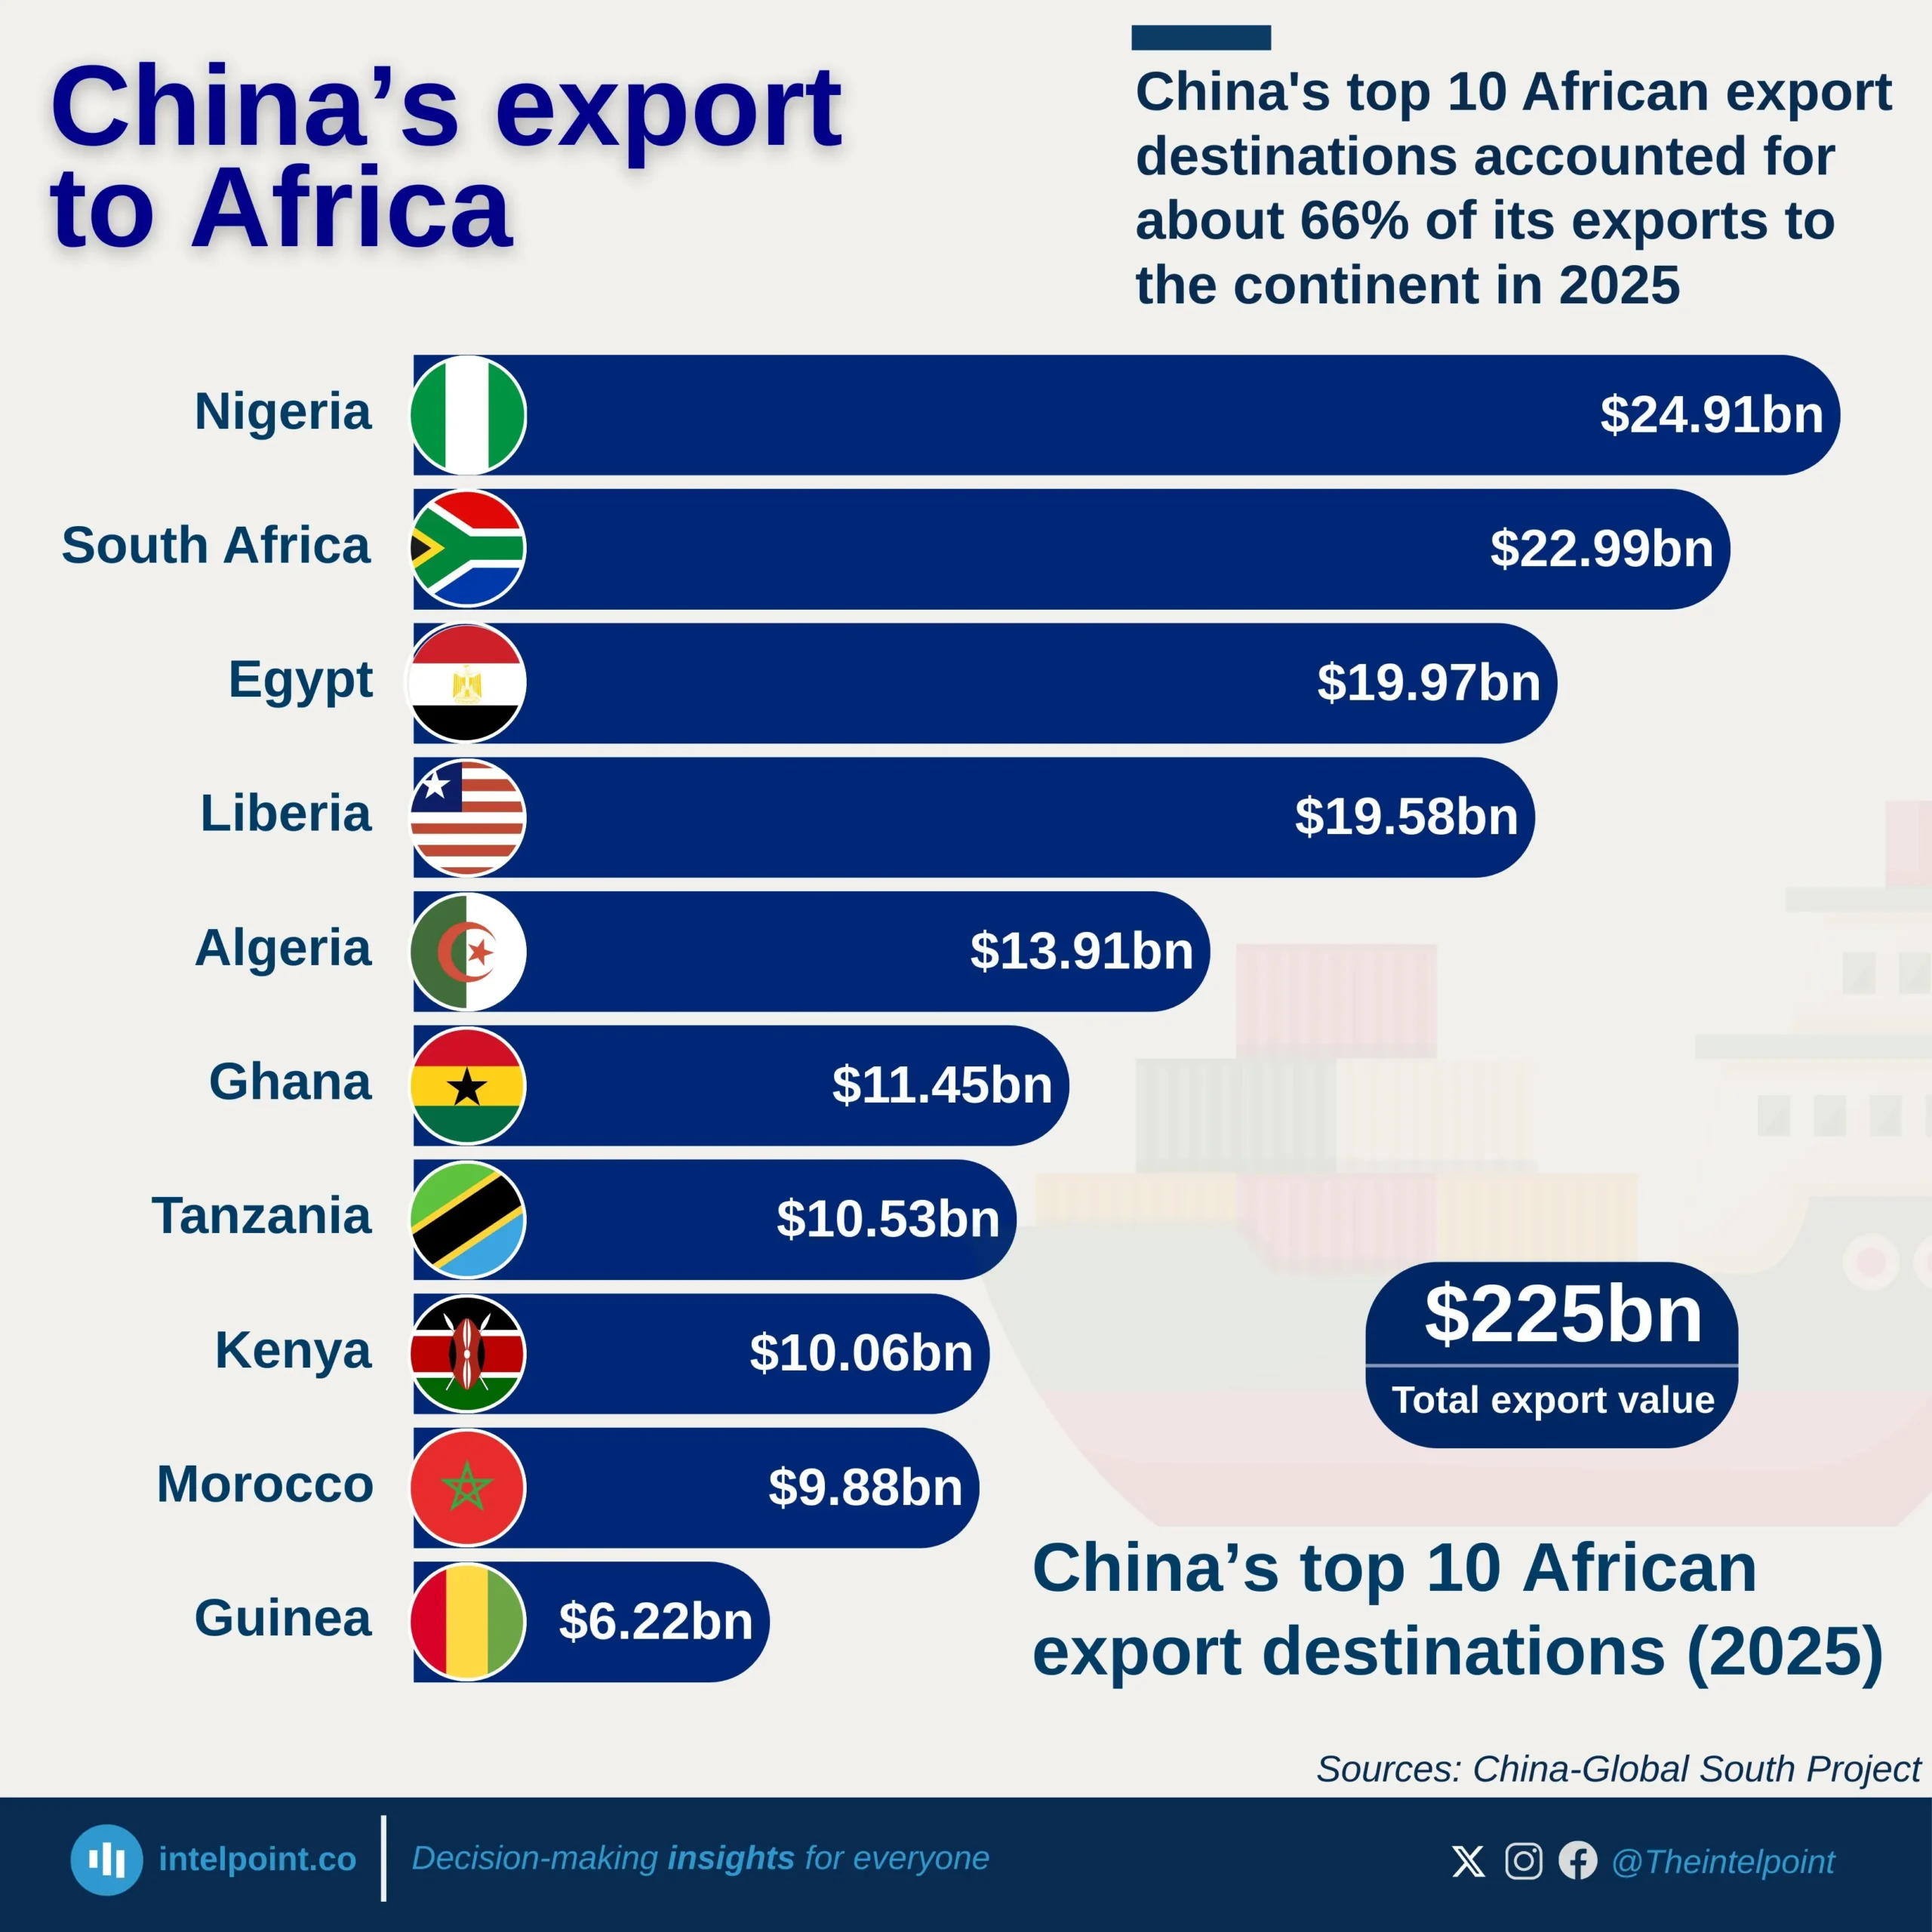
China’s export flows to Africa in 2025 exhibit a pronounced concentration among a relatively small group of countries, with the largest markets accounting for a substantial share of total trade. Nigeria ranks first, followed closely by South Africa and Egypt, reflecting the importance of market size, economic scale, and trade connectivity in shaping export distribution.

Beyond the top tier, export destinations span multiple regions and economic structures, from resource-driven economies to major regional trade hubs. This distribution highlights both concentration at the top and broad geographic reach, showing that while a few countries dominate trade volumes, China’s export network extends widely across the continent.

Source:

China Global South Project

Period:

2025
HTML code to embed chart
Want a bespoke report?
Reach out
Tags
Related Insights

After three years of decline, China-Nigeria export trade hit a new peak of $24.9bn in 2025
  • Export value more than doubled from $9.72 billion in 2016 to $24.91 billion in 2025.
  • Trade rose steadily between 2016 and 2019, then surged sharply in 2021.
  • Exports declined for three consecutive years (2022–2024) after the 2021 peak.
  • 2025 marks the highest export value in the ten-year period.

Post-pandemic trade reset lifts China–Africa exports to a record $225bn in 2025
  • Exports more than doubled in a decade, with trade rising from $92.27 billion in 2016 to $225 billion in 2025, a 144% increase.
  • The largest single jump occurred between 2020 and 2021, when exports surged by more than $34 billion.
  • From 2021 to 2024, exports climbed every year, reaching $178.91 billion before the latest surge.
  • The increase from $178.91 billion in 2024 to $225 billion in 2025 signals a new growth surge after several years of gradual increases.

Agricultural products led Kenya’s 2024 export economy, with coffee, tea, and spices generating $1.7 bn
  • Agriculture dominated Kenya’s exports, with coffee, tea, and spices alone contributing $1.7 billion, the largest single export category.
  • Mineral fuels were a surprisingly strong second, delivering $1.1 billion, and showing Kenya’s growing role in regional fuel distribution.
  • Horticultural exports (flowers, live plants, and trees) contributed $790 million, reinforcing Kenya’s global strength in floriculture.
  • All other export categories fall below $300 million individually, reflecting a long list of small but diverse export segments such as textiles, vegetables, and pharmaceuticals.

Mining led South Africa’s 2024 exports with 18.7%, as gems and precious metals generated over $20 bn
  • Gems and precious metals were the largest single export category, contributing $20.6 billion.
  • Ores and industrial minerals followed closely with $17.2 billion, showing the country’s reliance on mining.
  • Vehicles and machinery were significant non-mineral exports, with a combined $18.3 billion.
  • Agricultural and light industry products like fruits, nuts, and beverages contributed modestly, strengthening mining and manufacturing’s position as the core export drivers.

Cocoa accounted for 4.6% of Nigeria’s 2024 exports, making it the country’s second-largest export after oil
  • Mineral fuels (including crude oil) accounted for $49.3 billion, or 86.8% of total exports in 2024.
  • Non-oil exports remained marginal, with the second-largest item, cocoa, contributing only 4.6%.
  • Fertilisers, ores, slag, ash, and oilseeds collectively made up less than 5%, indicating limited diversification.
  • All other export categories each contributed 1% or less, underscoring Nigeria’s narrow export base.

Nigeria's energy goods imports have stayed low and stable for 7 years, while exports increased from ₦37B to ₦263B
  • Nigeria’s energy goods exports rose from ₦37.3B in 2017 to ₦262.9B in 2024, before falling to ₦154.2B in H1 2025.
  • Imports remained consistently low, ranging from ₦24.2M to ₦353.1M throughout the period.
  • Export growth outpaced imports, showing a widening trade surplus in energy goods.
  • The 2024 spike in exports represents the highest export value within the nine-year window.
  • Energy imports stayed below ₦400M yearly, indicating low dependency on foreign energy goods.

POPULAR TOPICS
SIGN UP TO OUR NEWSLETTER
Get periodic updates about the African startup space, access to our reports, among others.
Subscribe Here
Subscription Form

A product of Techpoint Africa. All rights reserved