Zimbabwe’s GDP per capita recorded a 472% increase over the 25-year period from 2000 to 2024

key takeaways:

  • Zimbabwe’s GDP per capita nearly quintupled since 2000, marking a 472% increase over 25 years.
  • The country's GDP per capita declined consistently from 2001 to 2008.
  • It soared to $3,448.1 in 2017, which is still the highest in the country's history.
  • The GDP per capita plummeted to $2,271.9 in 2019, recording a (34.1%) decrease.

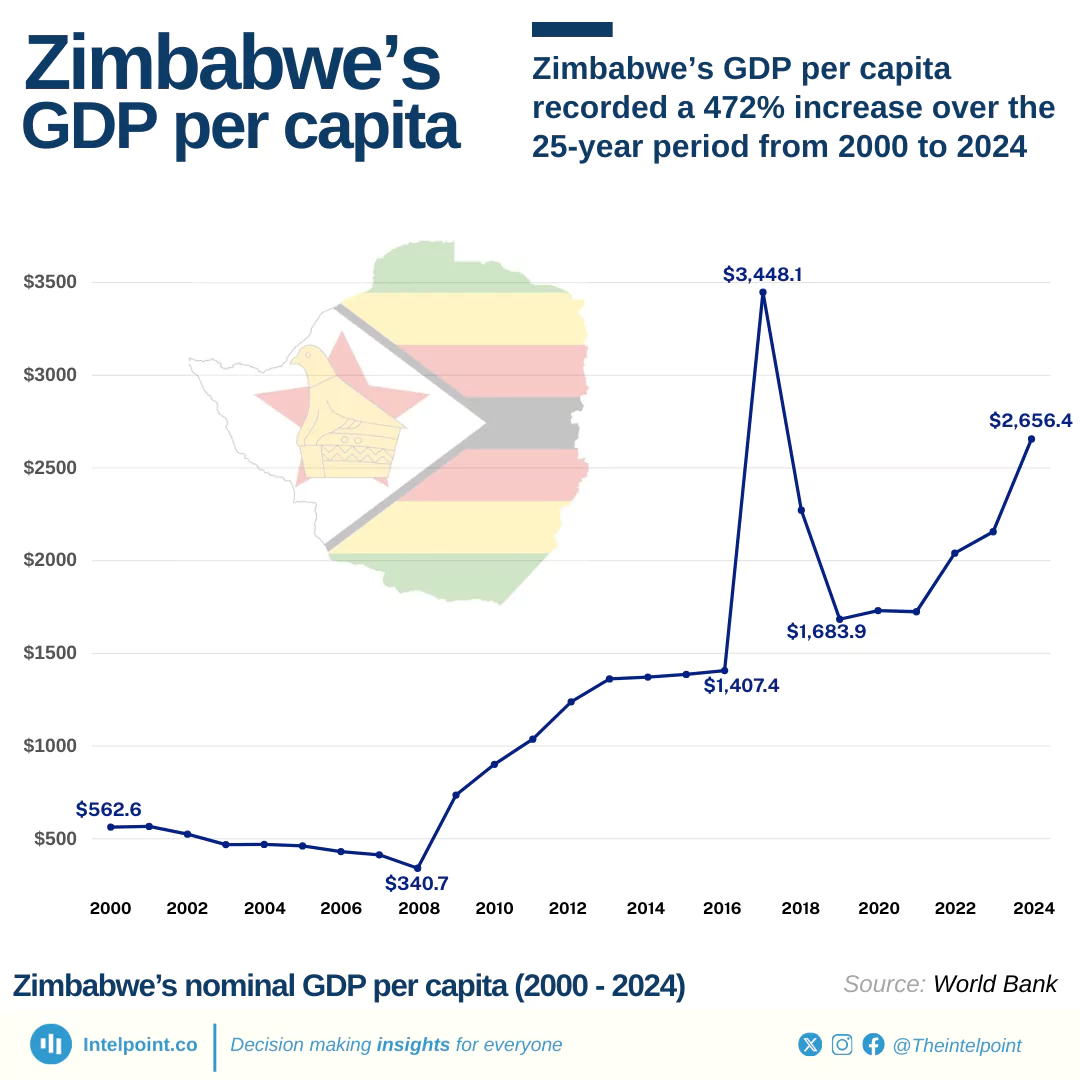
At the turn of the millennium, Zimbabwe’s nominal GDP per capita was roughly $562.6, a reflection of lingering economic strain. By 2008, the economy had plunged into a full-scale collapse, with GDP per capita plummeting to $340.7 as inflation skyrocketed into hyperinflation.

In April 2009, Zimbabwe abandoned its own currency and adopted a multi-currency system, chiefly using the US dollar. This marked a turning point. GDP per capita recovered to around US $735.4 in 2009 and continued climbing to approximately US $1,037.2 by 2011. Between 2012 and 2017, GDP per capita rose steadily from about US $1,238.6 to a peak of US $3,448.1, which is still the highest in the country's history.

The country experienced a dip in 2018 and the GDP per capita fell to $2,271.9, marking [a] $1,176.2 (34.1%) decrease, and further declining to $1,683.9 in 2019, a $507.7 (22.4%) decrease. The economy showed resilience and the GDP per capita was able to increase to $1,730.5 in 2020 despite Covid 19. By 2024, Zimbabwe achieved a remarkable turnaround. The GDP per capita rose to $2,656.4, recording more than fivefold growth in 25 years.

Source:

World Bank

Period:

2000-2024
HTML code to embed chart
Want a bespoke report?
Reach out
Tags
Related Insights

Two-thirds of IDA’s commitments in one year went to Africa, led by Nigeria’s $3.1bn
  • Africa received 66% of IDA’s FY2025 commitments.
  • Africa’s total IDA allocation was $22.4 billion out of $33.8 billion.
  • Nigeria was the largest borrower from the DA globally, with $3.1 billion in loans.
  • Bangladesh ranked second with $3 billion.
  • Six of the top ten borrowers were African countries.
  • Nigeria accounted for 9.3% of total FY2025 IDA commitments.

Oyo has reduced external debt by 36% and domestic debt by 22% under Makinde
  • Oyo reduced external and domestic debt by the end of 2025.
  • External debt fell faster than domestic debt.
  • External debt declined more consistently over the period.
  • Oyo’s local debt peaked around 2022–2023 before falling back.
  • The state appears to have prioritised reducing FX exposure.

Africa has been the world's biggest World Bank borrower since 2017, owing $152 billion as of 2024
  • Africa has been the world's biggest World Bank borrower since 2017, and the gap is widening.
  • Three crises drove it: an infrastructure gap, the 2014 commodity crash, and COVID-19.
  • The World Bank leaned in deliberately — 66% of all IDA funds went to Africa in 2025 alone.
  • It's not really "Africa's debt" — it's Nigeria's, Kenya's, Ethiopia's, Egypt's, Tanzania's, and Morocco's.
  • Every other region is slowing down, but Africa's curve is still climbing.

Obasanjo led Nigeria's biggest GDP per capita rise at 268% in 8 years
  • Nigeria’s GDP per capita rose strongly from 1999 to 2014, then reversed.
  • The 2014 peak remains the defining turning point.
  • Obasanjo’s years show the fastest sustained climb from a very low base.
  • Yar’Adua’s short tenure still maintained upward momentum.
  • Jonathan’s period delivered the peak level, not the fastest growth rate.
  • Buhari’s tenure marks the longest clear decline in GDP per capita.
  • Tinubu’s period begins with another sharp fall.

Under Sanwo-Olu, Lagos cut its external debt and more than doubled its domestic debt
  • Lagos cut external debt, but increased domestic debt.
  • The drop in external debt was meaningful, but the rise in domestic debt was much larger.
  • Stronger IGR gave Lagos more room to borrow and repay.
  • The state chose local funding over heavier dollar exposure.

Lagos's external debt has reduced by nearly three times more than the other six states combined
  • Lagos's debt reduction is larger than the other six combined.
  • Oyo posted the fastest reduction rate.
  • The biggest percentage cut did not equal the biggest dollar cut.
  • Debt reduction was concentrated, not broad-based.
  • Higher state revenues likely created room for repayments.
  • Lagos had the strongest fiscal capacity among the states shown.
  • Smaller debt stocks made percentage declines easier for some states.

POPULAR TOPICS
SIGN UP TO OUR NEWSLETTER
Get periodic updates about the African startup space, access to our reports, among others.
Subscribe Here
Subscription Form

A product of Techpoint Africa. All rights reserved