Top 10 Rice producing countries in the world from 1990 - 2024

  • 1990-2000: In this decade, China and India accounted for over 50% of the world's total output, with other dominant rice producers being Indonesia, Vietnam, and Bangladesh, with production figures falling between 20 and 30 million metric tons.
  • 2001-2010: China and India remained the two top producers, with China producing 140 million metric tons annually and India 100 million metric tons annually. 
  • 2011-2020: China and India continue to lead at about 150 million and 105 million metric tons, respectively. 
  • 2021-2024: China and India continued to lead. China reached 144.62 million metric tons in 2023/2024, and India accounted for 137.83 million metric tons.

From 1990 to the present, rice remains one of the staple foods whose production has changed tremendously. Global milled rice production in 2022 reached about 513.5 million metric tons, with China leading with 208.49 million metric tons and India a close second with 137.83 million metric tons. This article explores changes in rice production from 1990 through 2024 and the most prominent countries in this highly essential industry.

Here’s a detailed table summarizing the trends of the happiest African countries from 2000-2024

Period Rice Production by Country Rice Consumption by Country Key Trends
1990-2000 China, India, Indonesia, Bangladesh, Vietnam China, India, Indonesia, Bangladesh, Vietnam China and India dominated the world production and consumption of rice. The contribution of Southeast Asia, comprising Indonesia, Bangladesh, and Vietnam, was also immense in terms of production and consumption.
2001-2010 China, India, Indonesia, Bangladesh, Vietnam China, India, Indonesia, Bangladesh, Vietnam China and India remained at the forefront; Indonesia and Bangladesh gradually improved their production and consumption.
2011-2020 China, India, Indonesia, Bangladesh, Vietnam China, India, Indonesia, Bangladesh, Vietnam China and India maintained their positions; Bangladesh's production and consumption grew, while Vietnam's remained stable. 
2021-2024 China, India, Indonesia, Bangladesh, Vietnam China, India, Indonesia, Bangladesh, Vietnam China and India remained at the top of the charts, while Bangladesh's production and consumption are on the rise, Indonesia has declined, and Vietnam's has fallen back in production but sustained its consumption.

Trends of Rice Producing Countries from 1990-2024

1990-2000: Early Stability

In the same decade, China and India led the world in rice production, accounting for over 50% of the total. China produced about 130 million metric tons, while India produced 90 million metric tons. 

Southeast Asian countries, like Indonesia, Vietnam, and Bangladesh, were also important and held production figures between 20 and 30 million metric tons. Rice is traditionally grown, and good weather conditions have seen global production averaging 400 million metric tons annually.

2001-2010: Technological Advancements

China and India were followed as leaders, with China producing 140 MMT per annum and India accounting for 100 MMT yearly. Others, like Indonesia, Bangladesh, and Vietnam, emerged from high-yielding rice varieties and irrigation facilities that boosted their production. This decade, the world's total production reached 450 MMT yearly, as new agricultural methods yielded more yield.

2011-2020: Growth with Challenges

China and India continued to lead, producing around 150 million and 105 million metric tons, respectively. Countries like Indonesia and Bangladesh also showed growth, while global production averaged 480 million metric tons annually. 

Several challenges, such as climate variability, existed during this period. Still, modern farming techniques and greater use of fertilizers overcame these challenges, sustaining production levels.

2021-2024: Ongoing Growth Amid Climate Concerns

In 2023/2024, China and India maintained their leading positions at 144.62 million metric tons and 137.83 million metric tons, respectively. Bangladesh, Indonesia, and Vietnam followed suit in Southeast Asia. Global rice production reached about 520.4 million metric tons, while climate change, technological innovations, and government policies affected the growth.

Conclusion

From 1990 to 2024, China and India held the first two positions in rice production, accounting for more than half of the world's total. Other important rice producers in Southeast Asia include Indonesia, Vietnam, and Bangladesh. Advances in agricultural technology and practices, including the introduction of high-yielding varieties of rice and better irrigation, have made increases in rice production possible. 

However, weather conditions and environmental factors still affect yield; hence, sustainable farming practices are needed. These trends are increasingly dependent on modern rice production techniques, dominant positions, and the influence of environmental factors on rice production.

FAQs

What Is the Trend in Rice Production?

Global rice production increased by 11.0 million tons in the 2024/25 market year compared to the previous year, reaching a record high of 533.7 million tons on a milled basis.

Which Country Produces the Most Rice in 2024?

China is the world's leading rice producer, followed by India and Indonesia.

What Are the Top 10 Countries in Africa That Produce Rice?

Nigeria, Egypt, Madagascar, Côte d'Ivoire, Guinea, Sierra Leone, Liberia, Burkina Faso, Mali, and Senegal are the top rice-producing countries in Africa.

Who Is the Largest Exporter of Rice in the World 2024?

India is the world's largest rice exporter, followed by Thailand and Vietnam.
Source:

USDA Foreign Agricultural Service

Period:

2022/2023
HTML code to embed chart
Want a bespoke report?
Reach out
Tags
Related Insights

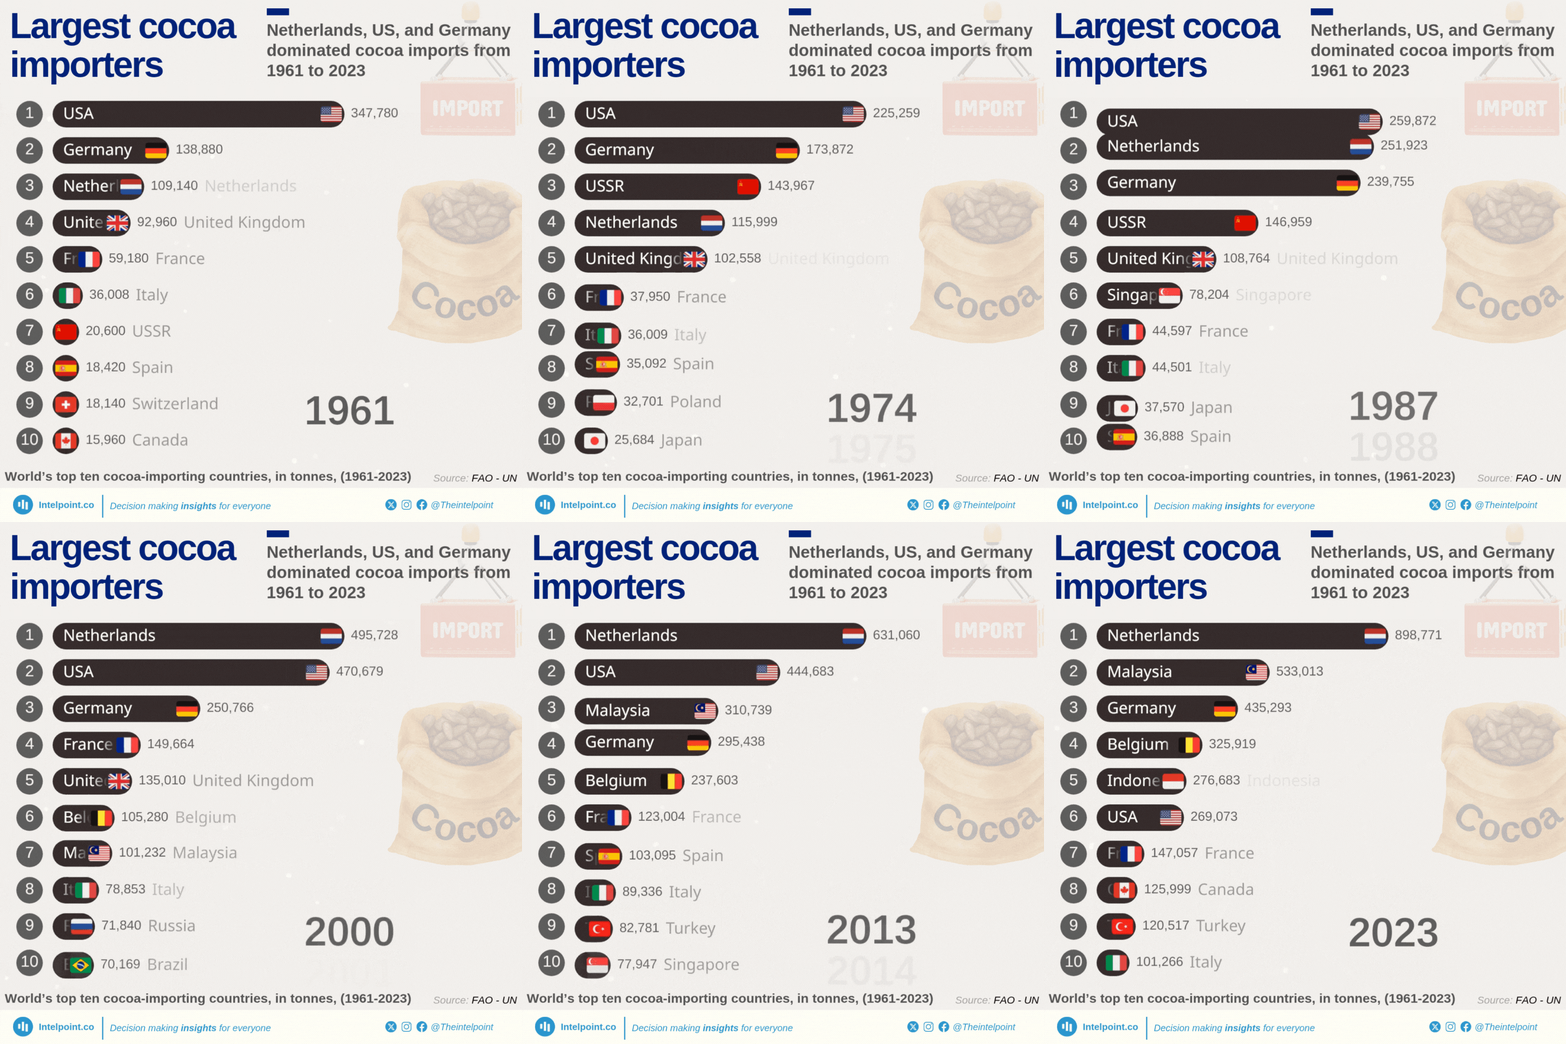
Netherlands, US, and Germany dominated cocoa imports from 1961 to 2023
  • Netherlands imported the most cocoa beans — 25.48 million tonnes (1961–2023)
  • US (21.1M) and Germany (16.8M) followed in total volume
  • These three countries dominated the top 5 nearly every year
  • Malaysia, UK, France, and Belgium also ranked high over time
  • USSR stayed in the top 10 despite dissolving in 1991
  • Global cocoa imports grew from 1M tonnes in 1961 to nearly 4M in 2023

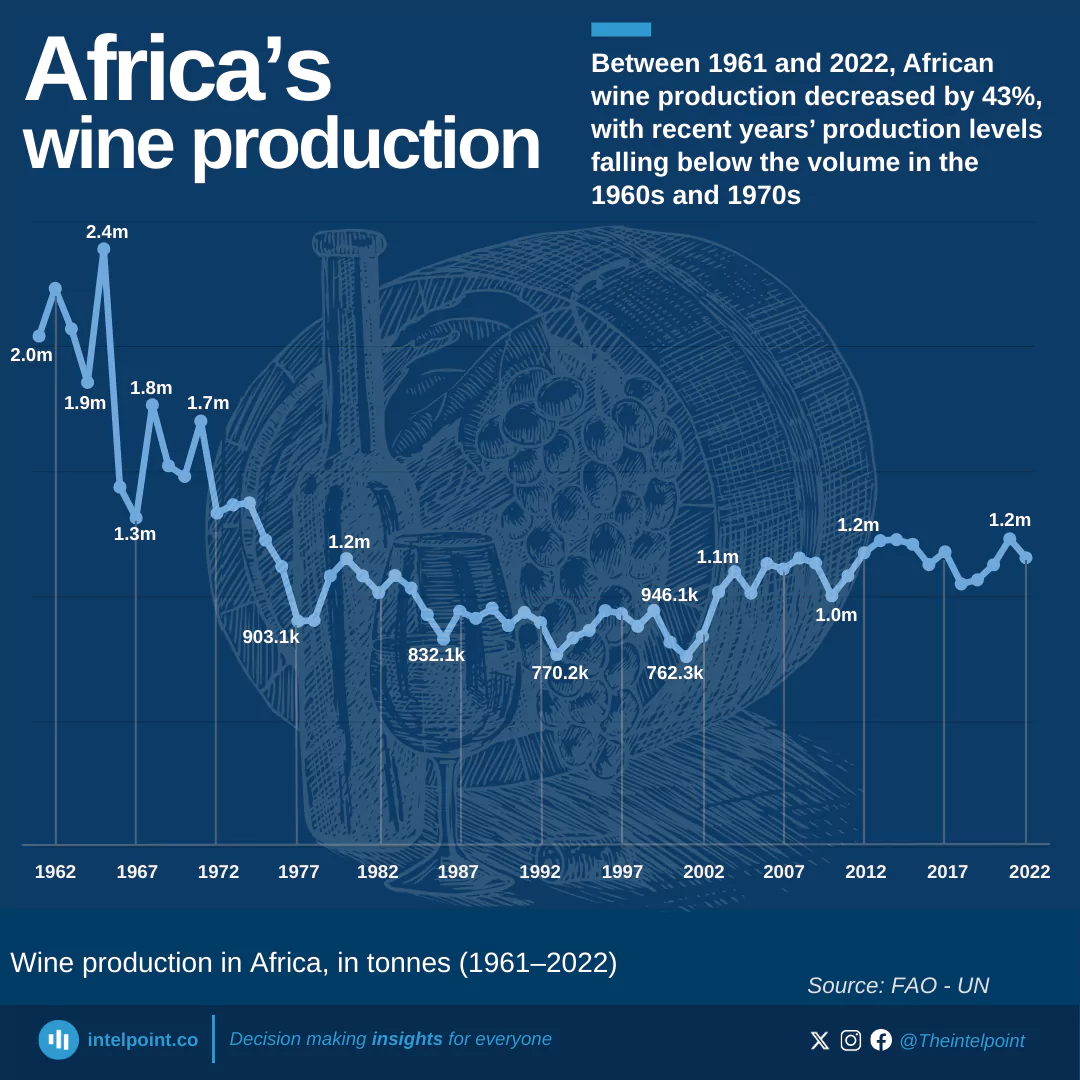
Between 1961 and 2022, African wine production decreased by 43%, with recent years’ production levels falling below the volume in the 1960s and 1970s
Key Takeaways:
  • African wine production peaked in 1965 at 2.39 million tonnes, the highest level recorded during the entire period.
  • The most dramatic single-year drop occurred between 1965 and 1966, when production fell by 40%, from 2.39 to 1.44 million tonnes.
  • A gradual recovery began in the early 2000s, with production consistently exceeding 1 million tonnes from 2003 onward.
  • The most recent peak occurred in 2021, with production reaching 1.23 million tonnes, a 48.5% decline from the 1965 high.
  • Despite this partial recovery, current production levels remain well below the highs of the 1960s.
  • As of 2022, African wine production stood at 1.16 million tonnes, representing a 43% decrease from 1961.

Egypt produced over 10.2 million tonnes of tomatoes at its 2009 peak, topping Africa for 63 straight years
  • Egypt led every single year from 1961 to the most recent year — 63 years of dominance.
  • Egypt peaked at over 10.2 million tonnes in 2009, no other African country came close.
  • As of 2023, Egypt ranked 5th globally, just ahead of Italy and behind the US.
  • Nigeria hit its highest level in 2015, with 4.2 million tonnes.
  • Nigeria was the only country that got within 1.5 million tonnes of Egypt in 13 different years.
  • Countries like Algeria, Morocco, and Tunisia remained consistent but far behind Egypt and Nigeria.
  • Egypt’s lead is backed by large-scale irrigation and strong export systems.
  • In 1987, Africa supplied 11.7% of the world’s tomatoes. But by 2023, its share dropped to 8.8%.

How Africa’s cotton production moved: Egypt’s long rule and West Africa’s rise
  • Egypt dominated African cotton production for decades, from the 1960s to the early 2000s, standing far ahead of other African countries in both volume and quality.
  • The early 2000s marked a major turning point, as West African countries — especially Burkina Faso and Mali — began to overtake Egypt in total production.
  • Burkina Faso emerged as the new cotton leader between 2005 and 2015, topping production in key years like 2005, 2006, 2008, 2009, and 2012–2015, and later reclaiming the top spot in 2020 and 2022.
  • Mali built its cotton strength after 2015, becoming Africa’s number one producer multiple times, peaking at over 334,000 tonnes in 2019.
  • Benin and Côte d’Ivoire quietly closed the gap throughout the 2010s, consistently ranking in the top three, even though they didn’t dominate the number one spot.

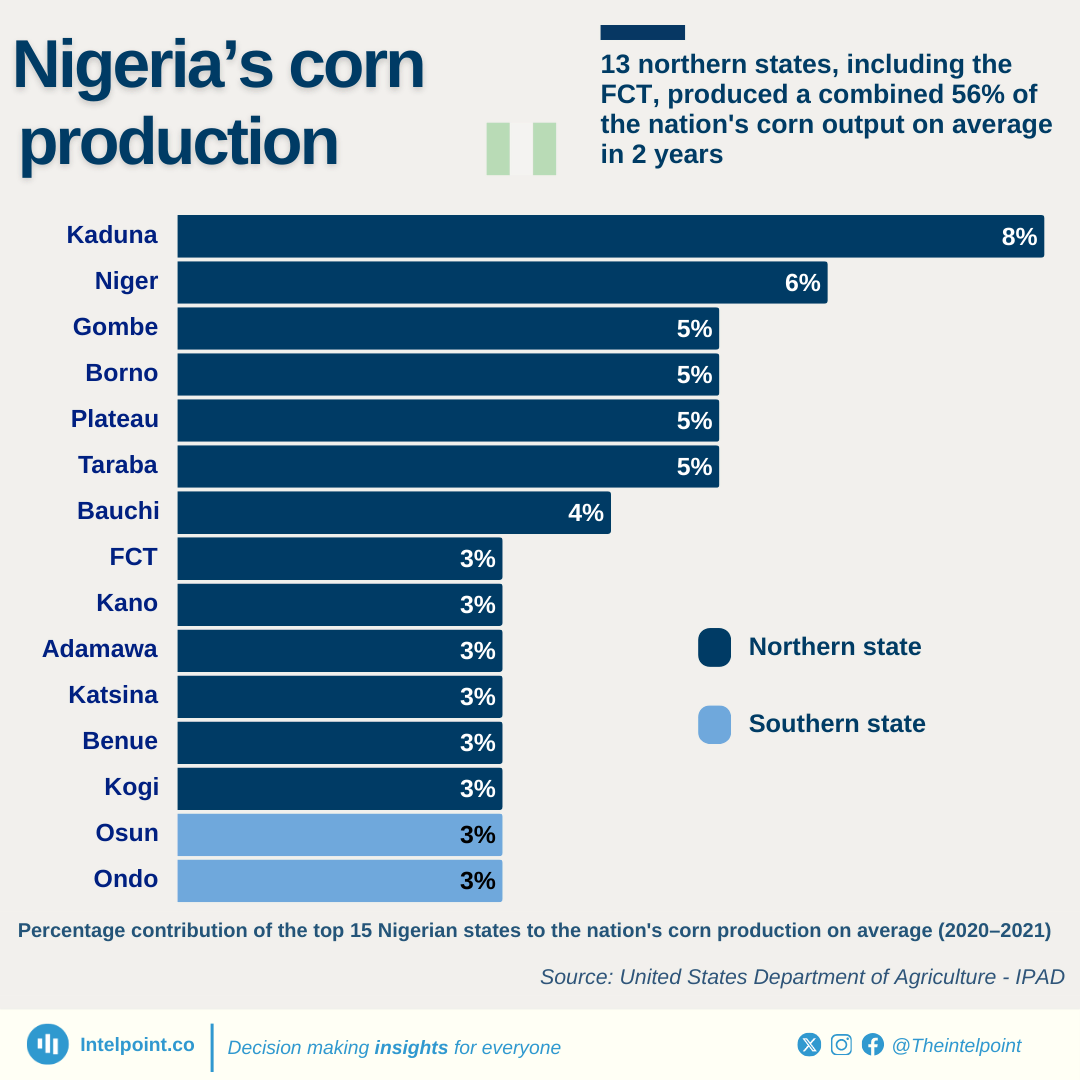
13 northern states, including the FCT, produced a combined 56% of the nation's corn output on average in 2 years
Key Takeaways:
  • Kaduna led national corn production on average, contributing 8% of total output, between 450,000 and 947,000 metric tons.
  • Niger, Gombe, Borno, Plateau, and Taraba followed closely, each accounting for 5–6% of the total output on average.
  • Corn production is heavily concentrated in the North-Central and North-East regions.
  • Kaduna and Niger together accounted for 14% of Nigeria’s corn output on average.
  • The top 10 corn-producing states, all located in northern Nigeria, on average contributed 47% of the national total.
  • Southern states such as Osun and Ondo contributed modest but notable shares, each representing 3% of national production on average.

India has led global cashew production for 35 of the past 62 years
Nigeria held the top spot in global cashew production from 2001 to 2010. This highlights a period of strong agricultural output, though the country has since been overtaken by India and Côte d'Ivoire. In recent years, Côte d'Ivoire has emerged as the world’s leading cashew producer, holding the top spot for three consecutive years as of 2022. This shift highlights the country's growing role in global cashew production. India and Mozambique once dominated global production, with India leading for 35 of the past 62 years.

POPULAR TOPICS
SIGN UP TO OUR NEWSLETTER
Get periodic updates about the African startup space, access to our reports, among others.
Subscribe Here
Subscription Form

A product of Techpoint Africa. All rights reserved