The USA’s $1.1 trillion deficit is four times larger than India’s trade deficit

Key takeaways

  • The United States leads with a massive $1.1 trillion in trade deficit, over four times larger than India's $245.5 billion deficit
  • India and the United Kingdom follow, each exceeding $230 billion in trade deficits, reflecting high import reliance
  • The USA’s trade imbalance alone surpasses the combined deficits of the other nine countries on this list
  • Six of the top ten countries with the largest deficits are European economies

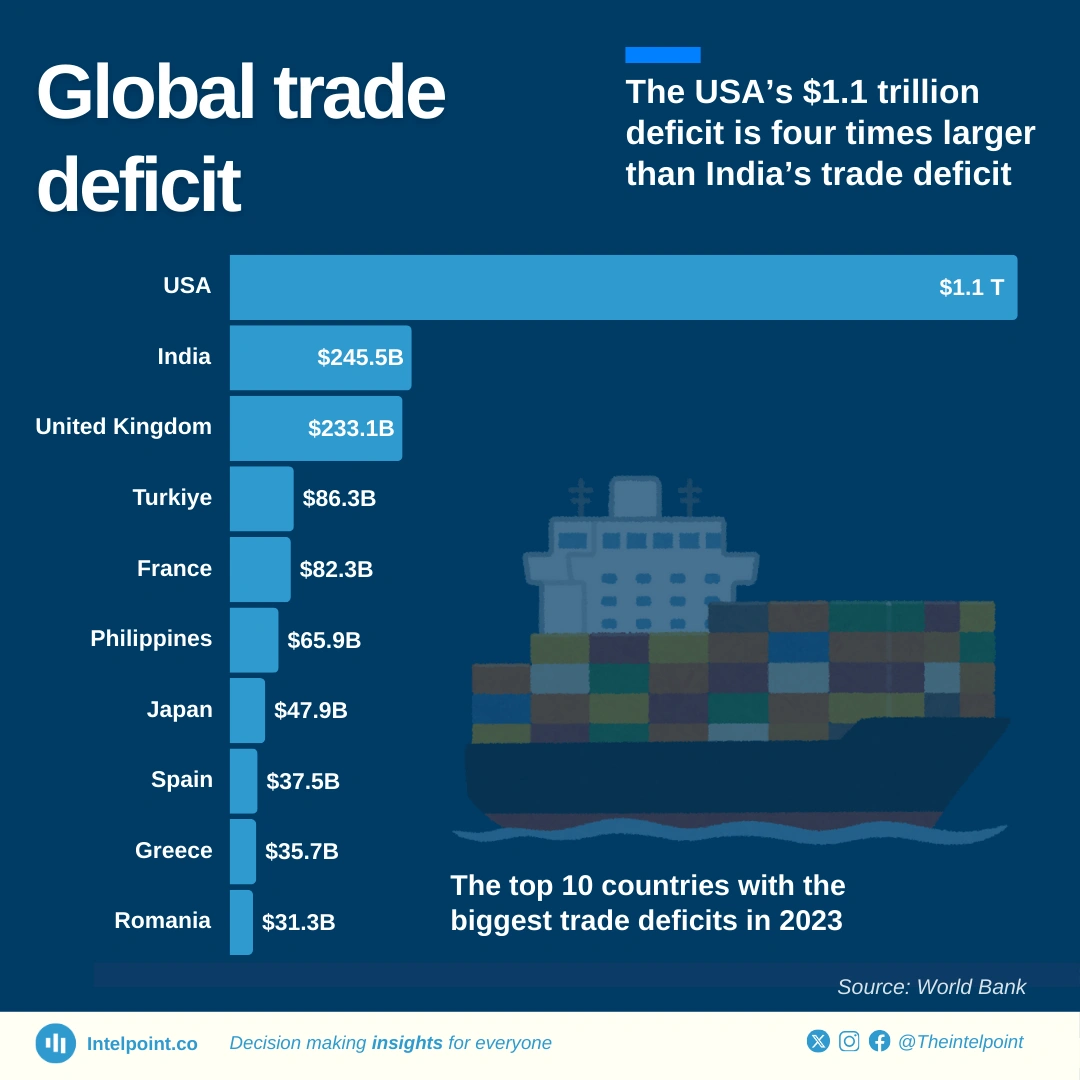
Global trade deficits vary widely, with the United States standing out at $1.1 trillion, more than four times larger than India’s $245.5 billion deficit. The USA’s trade deficit alone exceeds the combined deficits of the remaining nine countries, underscoring its high import consumption. The UK follows closely behind India with a $233.1 billion deficit, highlighting a reliance on imports. Japan, Spain, Greece, and Romania maintain deficits below $50 billion in a list dominated by European economies.

Source:

World Bank

Period:

2023
HTML code to embed chart
Want a bespoke report?
Reach out
Tags
Related Insights

Over 80% of Nigeria’s imports in 2024 came from manufacturing and oil products
Key takeaways:
  • Manufactured goods accounted for 44.2% of Nigeria’s total imports.
  • Petroleum products (excluding crude oil) made up 38% of the import value.
  • Raw materials represented 11% of the total import value.
  • Agricultural imports contributed 6.2% to the overall import value.
  • The total import value stood at ₦60.59 trillion in 2024, from ₦30.86 trillion in 2023.
  • The energy resources sector made a negligible amount in import value, while no record was made for the crude oil sector.

The United States imported over $5.7 billion in goods from Nigeria in 2024, with mineral fuels and oils accounting for 93%
Key Takeaways:
  • Mineral fuels and oils dominated the US' imports from Nigeria, totalling $5.28 billion.
  • Total US imports from Nigeria reached $5.70 billion in 2024.
  • Non-oil sectors contributed approximately $423 million to the total US imports from Nigeria.
  • US imports from Nigeria cut across 70 distinct product categories.
  • The average value across all import categories was $81.4 million.
  • The top 10 imported goods made up 99.1% of the total imported value.

Mineral fuels, oils, and distillation products accounted for 43.65% of the US' total export to Nigeria
Key Takeaways:
  • Mineral fuels and oils led the US' exports to Nigeria at $1.82B, making up over 43% of the total.
  • Vehicles and automotive parts followed at $677.65 million, with machinery and nuclear reactors contributing $487.23 million.
  • Total US exports to Nigeria reached $4.17 billion in 2024.
  • The top 10 export categories made up 90.7% of the total export value.
  • The top three US export categories to Nigeria accounted for nearly 72% of total exports.

The top 3 countries accounted for nearly half of the US' agricultural exports in 2024, valued at $83.35 billion
Key takeaways:
  • Mexico ranked as the leading destination for the US' agricultural exports in 2024, with a total value of $30.32 billion (17.2% of total agricultural exports).
  • North American neighbours, Mexico and Canada, collectively accounted for 33.3% of total US agricultural exports.
  • China was the third-largest market, importing $24.65 billion (14%) of the US' agricultural products.
  • Asian markets, including China, Japan, South Korea, Taiwan, the Philippines, and Vietnam, collectively absorbed 31.7% of the US' agricultural exports.
  • The top three markets (Mexico, Canada, and China) made up 47.3% of the US' total agricultural export value.
  • The top 10 markets accounted for 74.8% of the US' agricultural exports, totalling $131.85 billion.

Cocoa products accounted for 30% of the US' agricultural imports from Sub-Saharan Africa in 2024
Key Takeaways:
  • Cocoa products, including paste, butter, and beans dominated the US' agricultural imports from Sub-Saharan Africa in 2024, making up nearly one-third of the total.
  • Other major import categories included coffee, seafood, oilseed meals, and tree nuts, rounding out the top six.
  • The top 10 agricultural imports accounted for 74% of all the US' agricultural imports from the region.
  • Each of the top 10 products had an import value exceeding $120 million.
  • From SSA, Côte d'Ivoire and Ghana were the leading suppliers of cocoa products to the US in 2024.
  • The top three products together represented 41% of the total agricultural imports from the region.

Wheat accounted for 46.43% of the United States’ agricultural exports to Nigeria in 2024
Key Takeaways:
  • The United States exported $318.7 million worth of agricultural products to Nigeria in 2024.
  • Wheat accounted for nearly half of the US' agricultural exports to Nigeria, valued at $148 million.
  • The trade balance substantially favours the United States, with exports to Nigeria ($318.7 million) nearly double imports ($114.7 million).
  • The top three products account for 74.49% of all agricultural exports to Nigeria.

POPULAR TOPICS
SIGN UP TO OUR NEWSLETTER
Get periodic updates about the African startup space, access to our reports, among others.
Subscribe Here
Subscription Form

A product of Techpoint Africa. All rights reserved