The US remained the dominant producer of bio-diesel, with 15.25 million metric tons produced in 2023

  • Only 37 countries produced bio-diesel in 2023.
  • No African country produced bio-diesel.
  • The US remained the dominant producer of bio-diesel with 15.25 million metric tons produced in 2023, which is 36% of the total quantity produced globally.
  • Germany was the top exporter of bio diesel with 2.18 million metric tons.

Bio-diesel, a renewable, biodegradable fuel manufactured from vegetable oils, animal fats, or recycled cooking grease is an alternative to petroleum diesel and can be used in diesel engines.
Only 37 countries in the world produced bio-diesel in 2023, and no African country was on the list. The implication is that bio-diesel production and usage in Africa remain relatively low, compared to other continents like Europe, Asia, and the Americas.

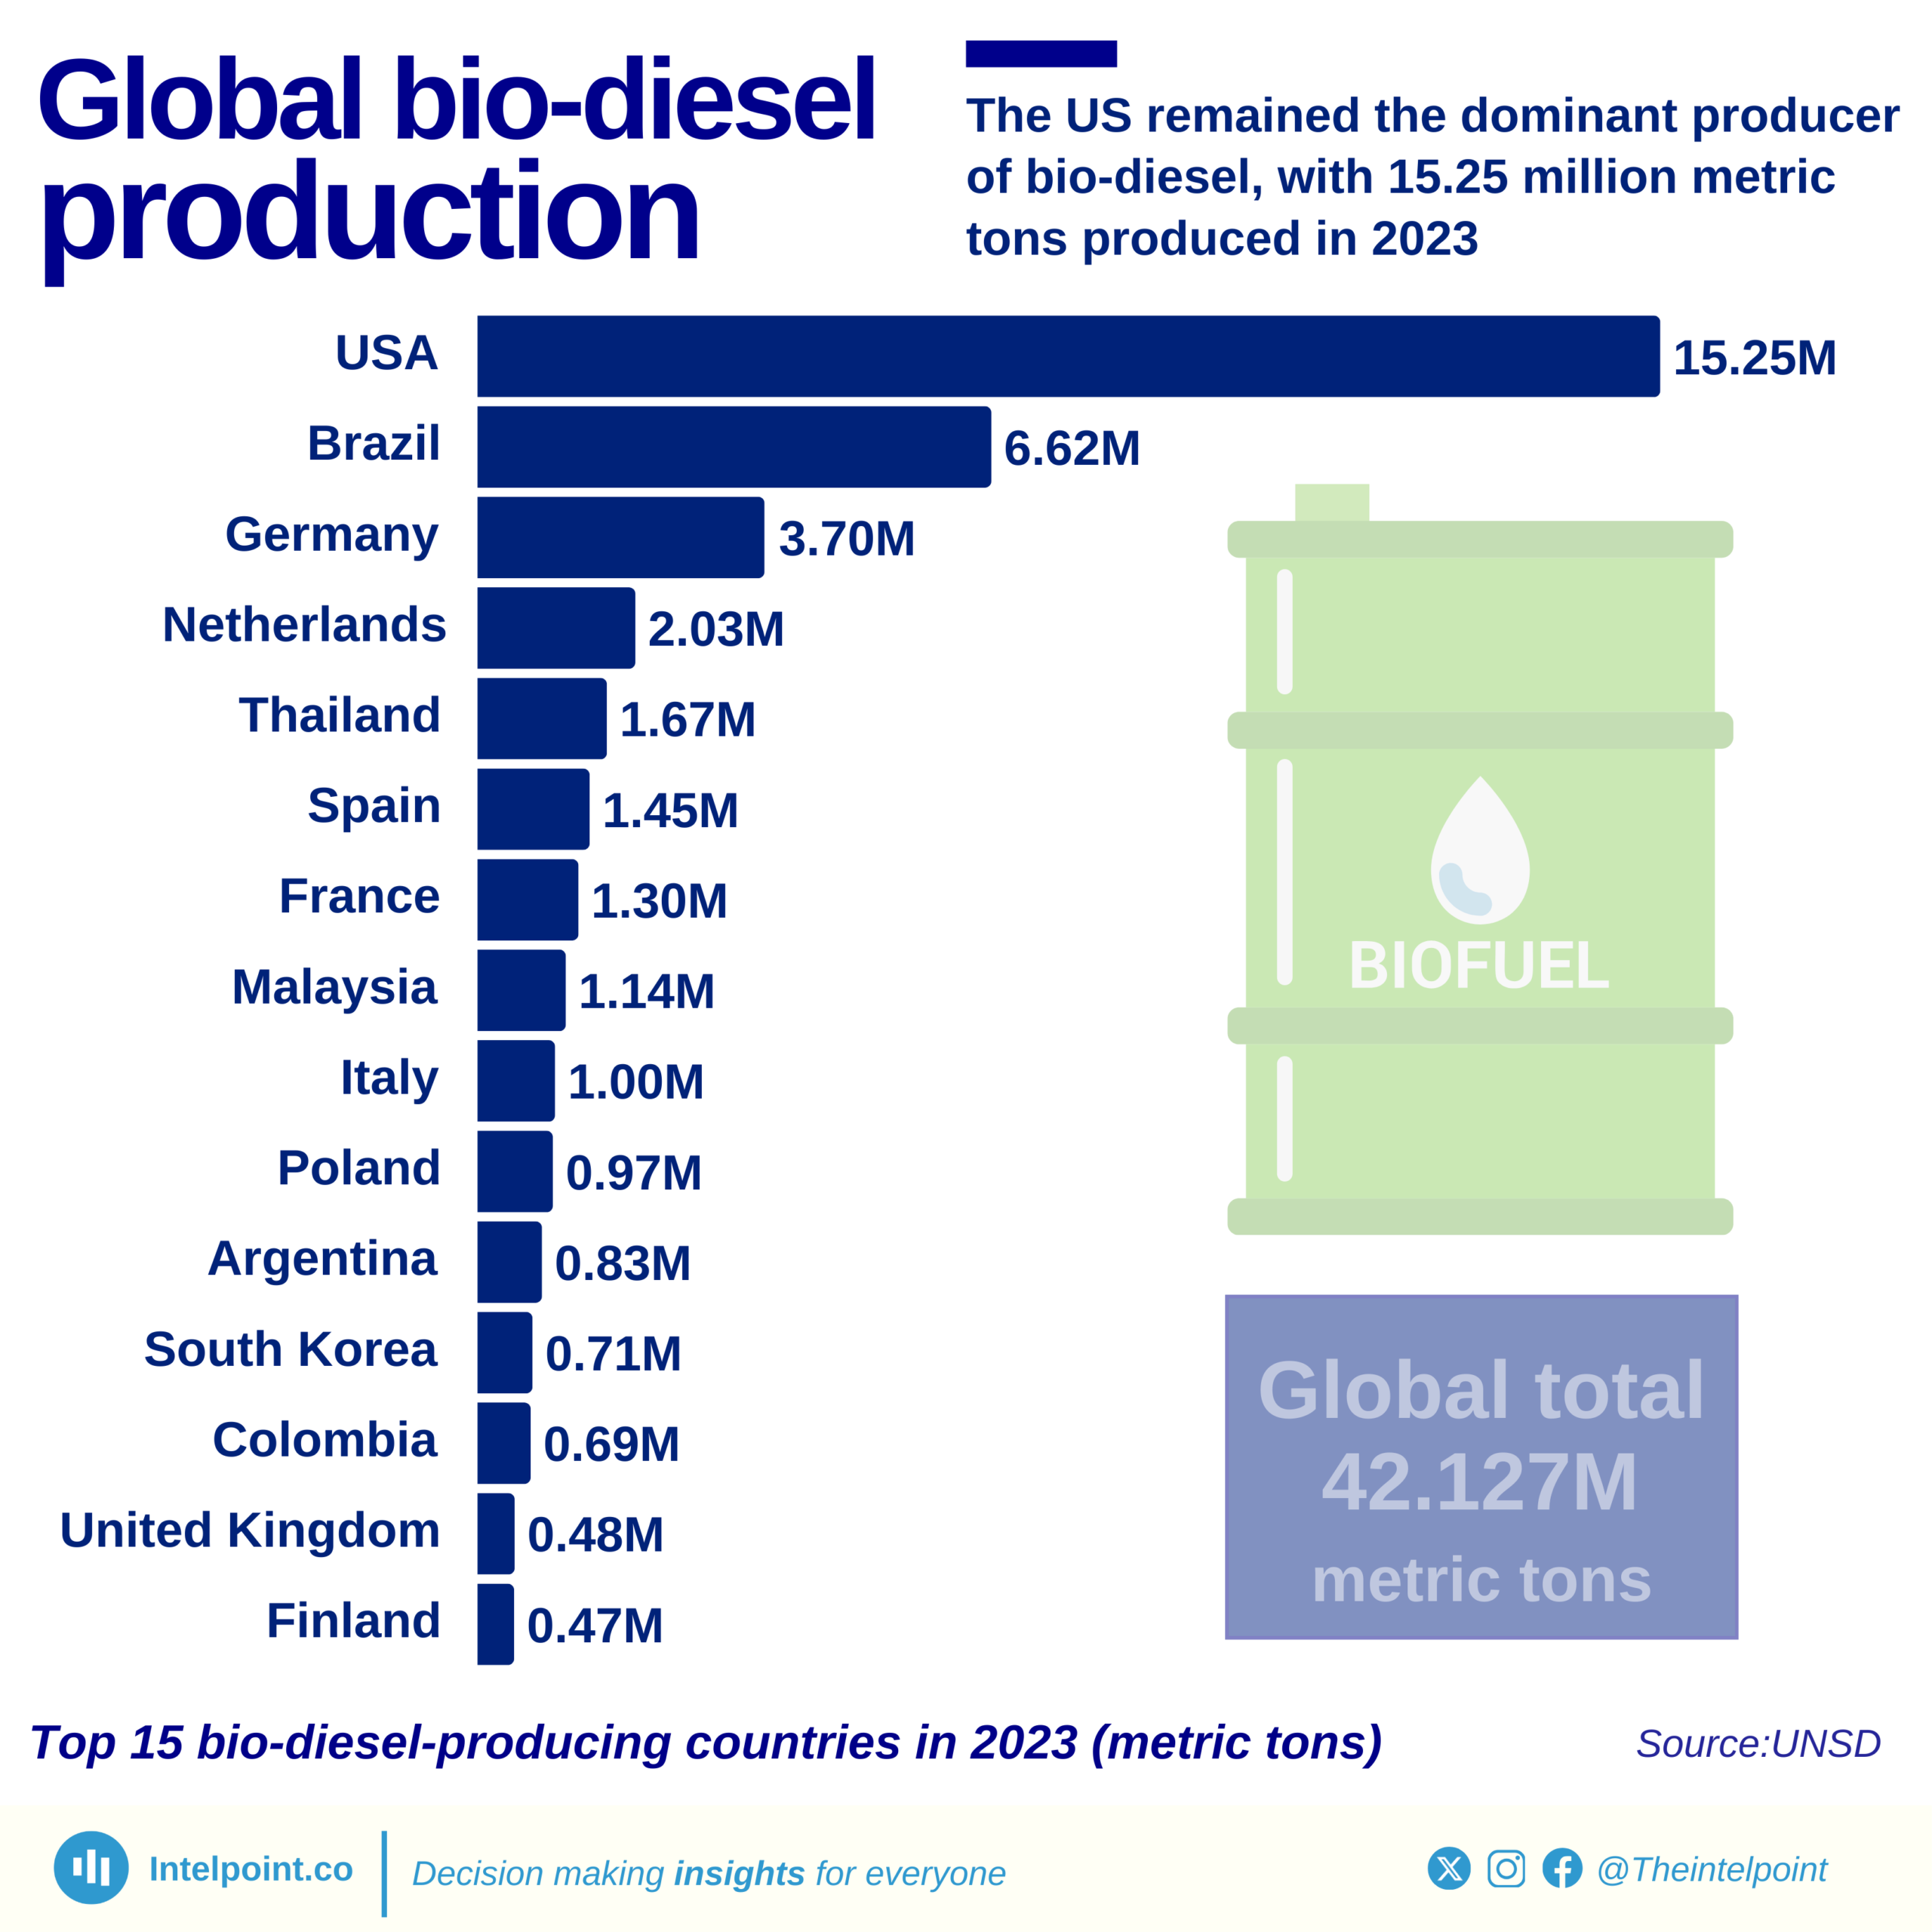
The United States of America remained the dominant producer of bio-diesel with 15.25 million metric tons produced in 2023, which is 36% of the total quantity produced globally. Brazil, Germany and the Netherlands produced 6.62 million metric tons, 3.70 million metric tons, and 2.03 million metric tons, respectively. These three countries collectively produced 29.3% of the global total.

With 15.25 million metric tons produced by the United States of America, one might assume that the country would be the major exporter of bio-diesel globally, but the country did not export at all as always. Germany was the top exporter of bio-diesel, with 2.18 million metric tons exported.

Source:

United Nations Statistics Division

Period:

2023
HTML code to embed chart
Want a bespoke report?
Reach out
Tags
Related Insights

Dangote Refinery’s fuel price hits an all-time-high, rising from ₦699 to ₦1,175 in four months
Fuel prices from Dangote Refinery reached an all-time high of ₦1,175 per litre in March 2026. The lowest recorded price in the period was ₦699 per litre in December 2025, showing a wide price swing. The jump from ₦699 to ₦1,175 happened in roughly four months.
  • Prices earlier in the timeline hovered mostly between ₦820 and ₦987 during late 2024 and much of 2025.
  • The December 2025 price cut was aimed at making locally refined fuel more competitive against imports.
  • After the price drop, fuel costs began rising again in early 2026, reaching ₦995 by early March before climbing further.
  • Global geopolitical tensions affecting oil markets contributed to the upward pressure on prices.

Malacca and Hormuz handle about 24% and 22% of global oil supply, respectively
  • The Strait of Malacca is the world’s most important oil chokepoint, carrying about 24–25% of global oil supply in recent years.
  • The Strait of Hormuz moves around 20–23% of global oil supply, making it the second-largest energy transit chokepoint.
  • The Cape of Good Hope carries about 9–10% of global oil flows, and its share tends to increase when other chokepoints face disruptions.
  • The Bab el-Mandeb saw a sharp drop in oil flow share from about 9% in 2023 to around 4% in 2024, reflecting security concerns affecting shipping in the Red Sea corridor.
  • Oil transported through the Suez Canal and the SUMED pipeline system dropped significantly after 2023, falling from about 8.6% to below 5%, showing how quickly routes shift during geopolitical tensions.
  • The Strait of Malacca’s share has remained consistently high and stable, indicating its structural importance to Asian energy demand.
  • Alternative routes like the Cape of Good Hope in South Africa are longer but strategically crucial, especially when Middle Eastern chokepoints become unstable.

Nigeria’s crude oil export value surges over 400% from 2020 to a record ₦55.3tn in 2024
  • Export values have grown over 400%, rising from ₦11.8 trillion in 2013 to a peak of ₦55.3 trillion in 2024, a fivefold increase driven by rising oil prices and a weaker naira.
  • 2015 and 2016 were the hardest years, with export values crashing as low as ₦6.8 trillion in 2015, reflecting the brutal impact of the global oil price collapse on Nigeria's most critical export.
  • The most explosive growth came from 2023 onwards, with values surging past ₦29 trillion in 2023 and peaking at ₦55.3 trillion in 2024, largely driven by the naira depreciation following Nigeria's 2023 foreign exchange reforms.
  • The first nine months of 2025 saw a slower pace than the previous year, with ₦37.7 trillion recorded between Q1 and Q3, lower than the ₦41.5 trillion recorded during the same period in 2024.

The national grid collapses an average of 7 times annually under Tinubu, down from 13 times under Buhari
  • The highest number of grid collapses in the past 16 years occurred in 2010, with 42 incidents recorded.
  • During Goodluck Jonathan’s administration, Nigeria’s grid collapsed an average of 24.4 times a year, the highest among the three administrations.
  • Under Muhammadu Buhari, the annual average dropped to 12.8 collapses per year, indicating improved grid stability compared to earlier years.
  • Under Bola Ahmed Tinubu, the average has fallen further to about 6.7 collapses annually.
  • 2016 recorded the highest number of collapses during the Buhari administration, with 28 incidents.
  • The most stable years in the dataset were 2020 and 2021, with only four collapses each.

Nigeria’s power grid is 69.9% powered by thermal plants
  • Thermal energy dominates Nigeria’s grid, supplying 69.9% of total power.
  • Hydro plants contribute 30.1%, making them the country’s second major source.
  • The heavy reliance on thermal generation shows Nigeria’s grid is still largely fossil-fuel driven.
  • Hydro remains a crucial but secondary source, supporting overall supply stability.

Nigeria's DisCos recorded ₦360bn revenue gap after collecting ₦1.12tn from ₦1.49tn billed in H1 2025
  • DisCos billed approximately ₦1.49 trillion but collected only ₦1.12 trillion in H1 2025.
  • Ikeja and Eko DisCos generated the highest revenues, collecting ₦206.22 billion and ₦210.59 billion, respectively.
  • Revenue collection gaps remain significant, with Jos, Kaduna, and Yola posting the weakest collection performances.
  • The wide gap between billings and actual collections suggests persistent challenges in customer payment compliance, metering, and distribution efficiency.

POPULAR TOPICS
SIGN UP TO OUR NEWSLETTER
Get periodic updates about the African startup space, access to our reports, among others.
Subscribe Here
Subscription Form

A product of Techpoint Africa. All rights reserved