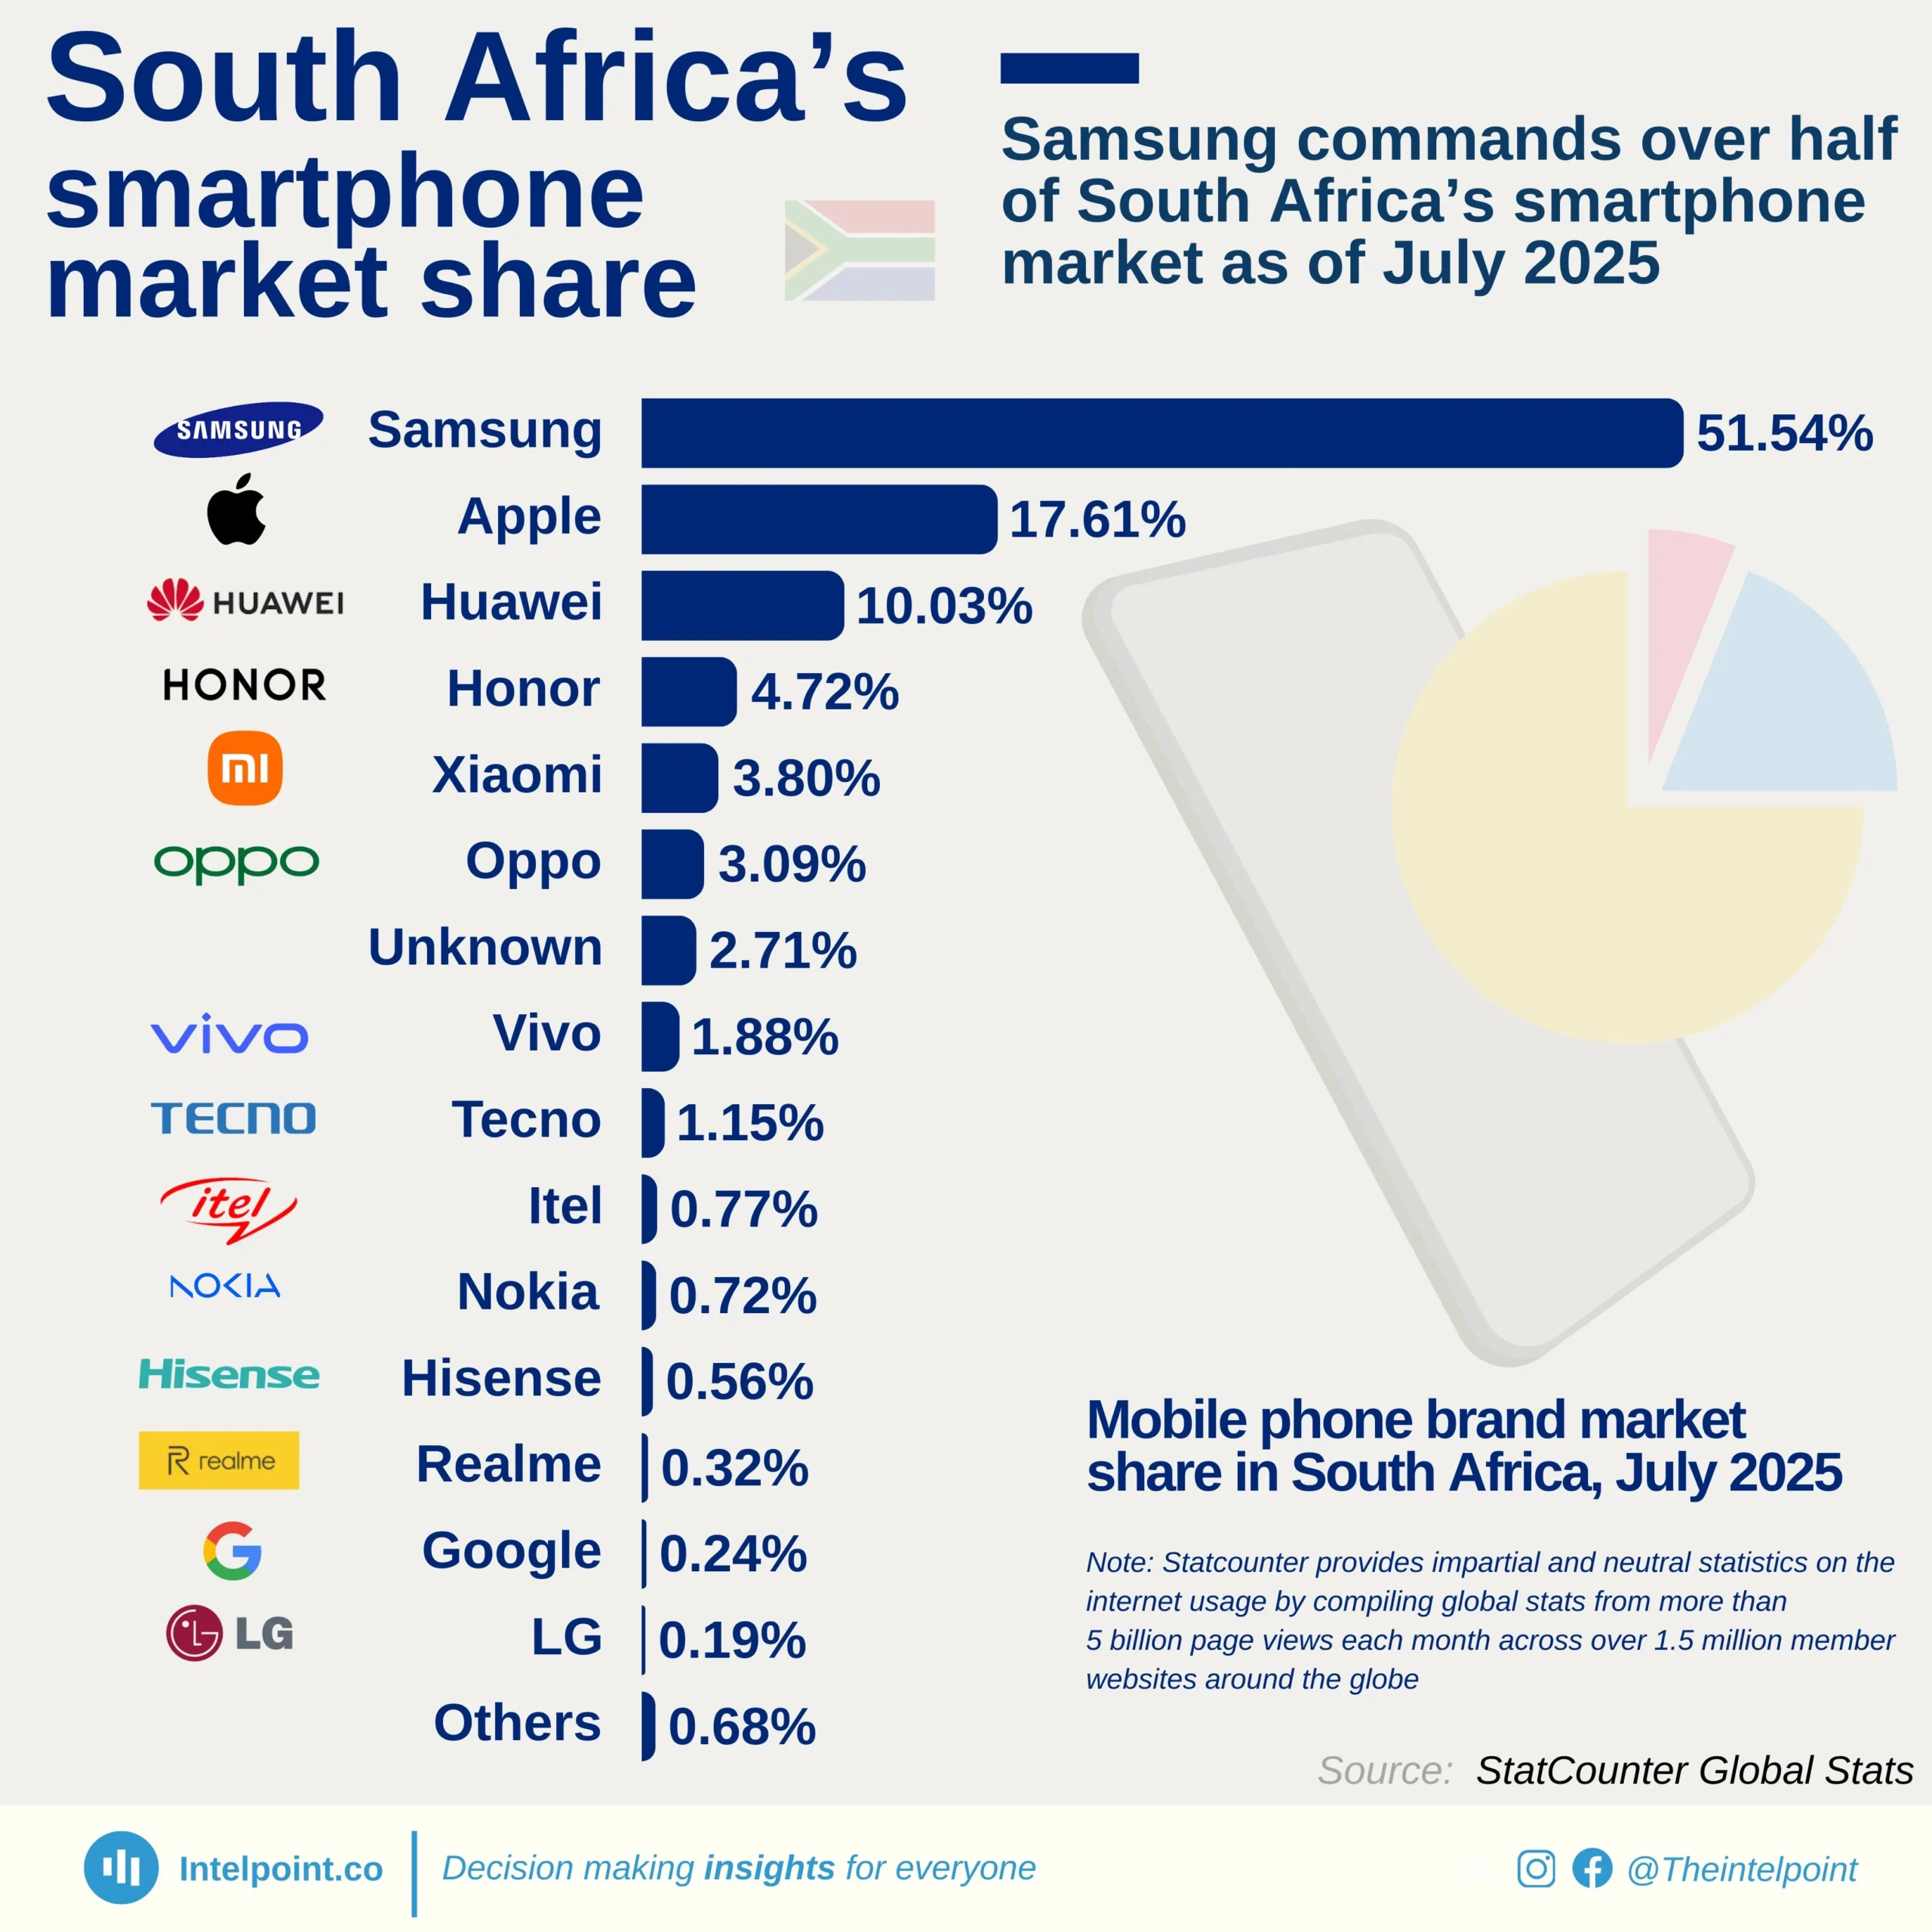
Samsung commands over half of South Africa’s smartphone market at 51.5% as of July 2025

Key Takeaways

  • Samsung controls more than half of the South African smartphone market, more than all other brands combined.
  • Apple holds 17.61%, less than half of Samsung’s share, but remains the clear premium alternative.
  • Despite global challenges, Huawei captures 10.03%, placing third in the market.
  • Honor, Xiaomi, and Oppo collectively hold approximately 11.6%, while smaller brands like Tecno, Itel, and Nokia struggle below 2% each.

South Africa’s smartphone market is overwhelmingly dominated by Samsung, which captures more than 1 in every 2 devices in use (51.54%). Apple trails far behind with 17.61%, reflecting its strong appeal among higher-income consumers but limited overall penetration. Huawei, despite facing global restrictions, maintains a solid 10.03% share, showing resilience and brand loyalty in the market.

Other players like Honor (4.72%), Xiaomi (3.8%), and Oppo (3.09%) are gaining ground but remain relatively niche. Meanwhile, budget brands such as Tecno (1.15%) and Itel (0.77%), which perform well elsewhere in Africa, have minimal presence in South Africa, indicating a market tilted more towards premium and mid-range smartphones than ultra-low-cost options.
Source:

StatCounter Global Stat

Period:

July 2025
HTML code to embed chart
Want a bespoke report?
Reach out
Tags
Related Insights

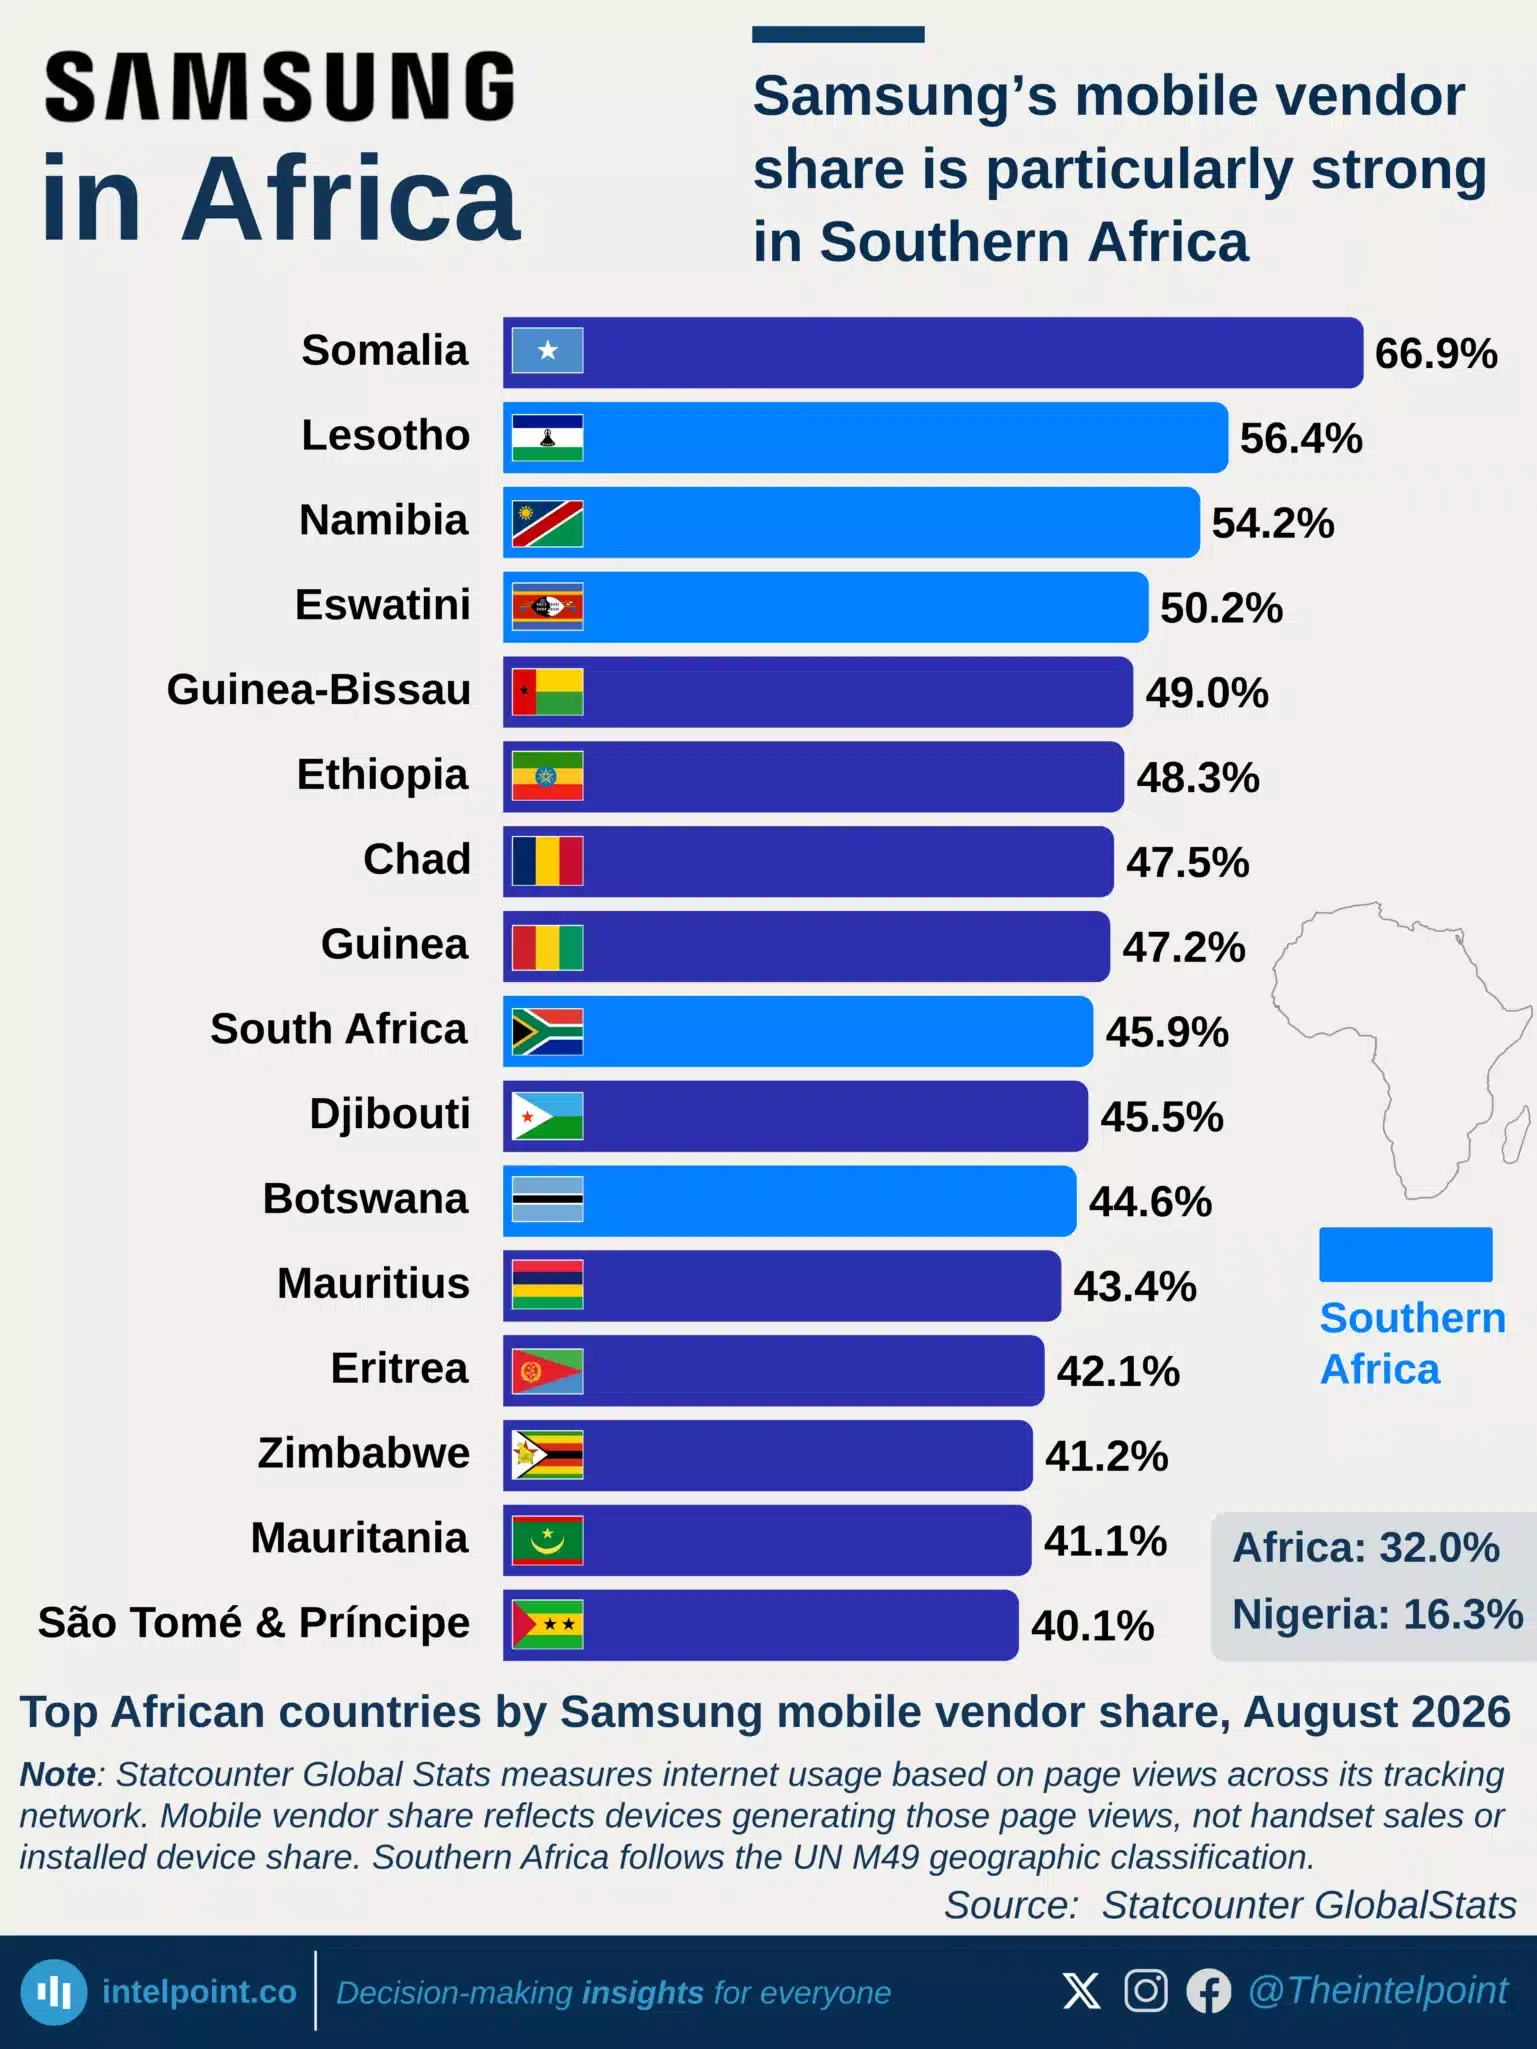
Samsung’s mobile vendor share is particularly strong in Southern Africa
  • Samsung exceeds 50% share in 4 African countries, led by Somalia at 66.9%.
  • Its share exceeds 40% in 16 countries, including Ethiopia, South Africa, Botswana and Zimbabwe.
  • Southern Africa shows particularly high Samsung usage, with all five UN M49 countries above 44%.
  • Samsung’s share is much lower in major markets, including Nigeria (16.3%), Egypt (22.9%) and Ghana (24.7%).
  • Samsung holds a 32.0% share across Africa, based on mobile web traffic rather than device sales.

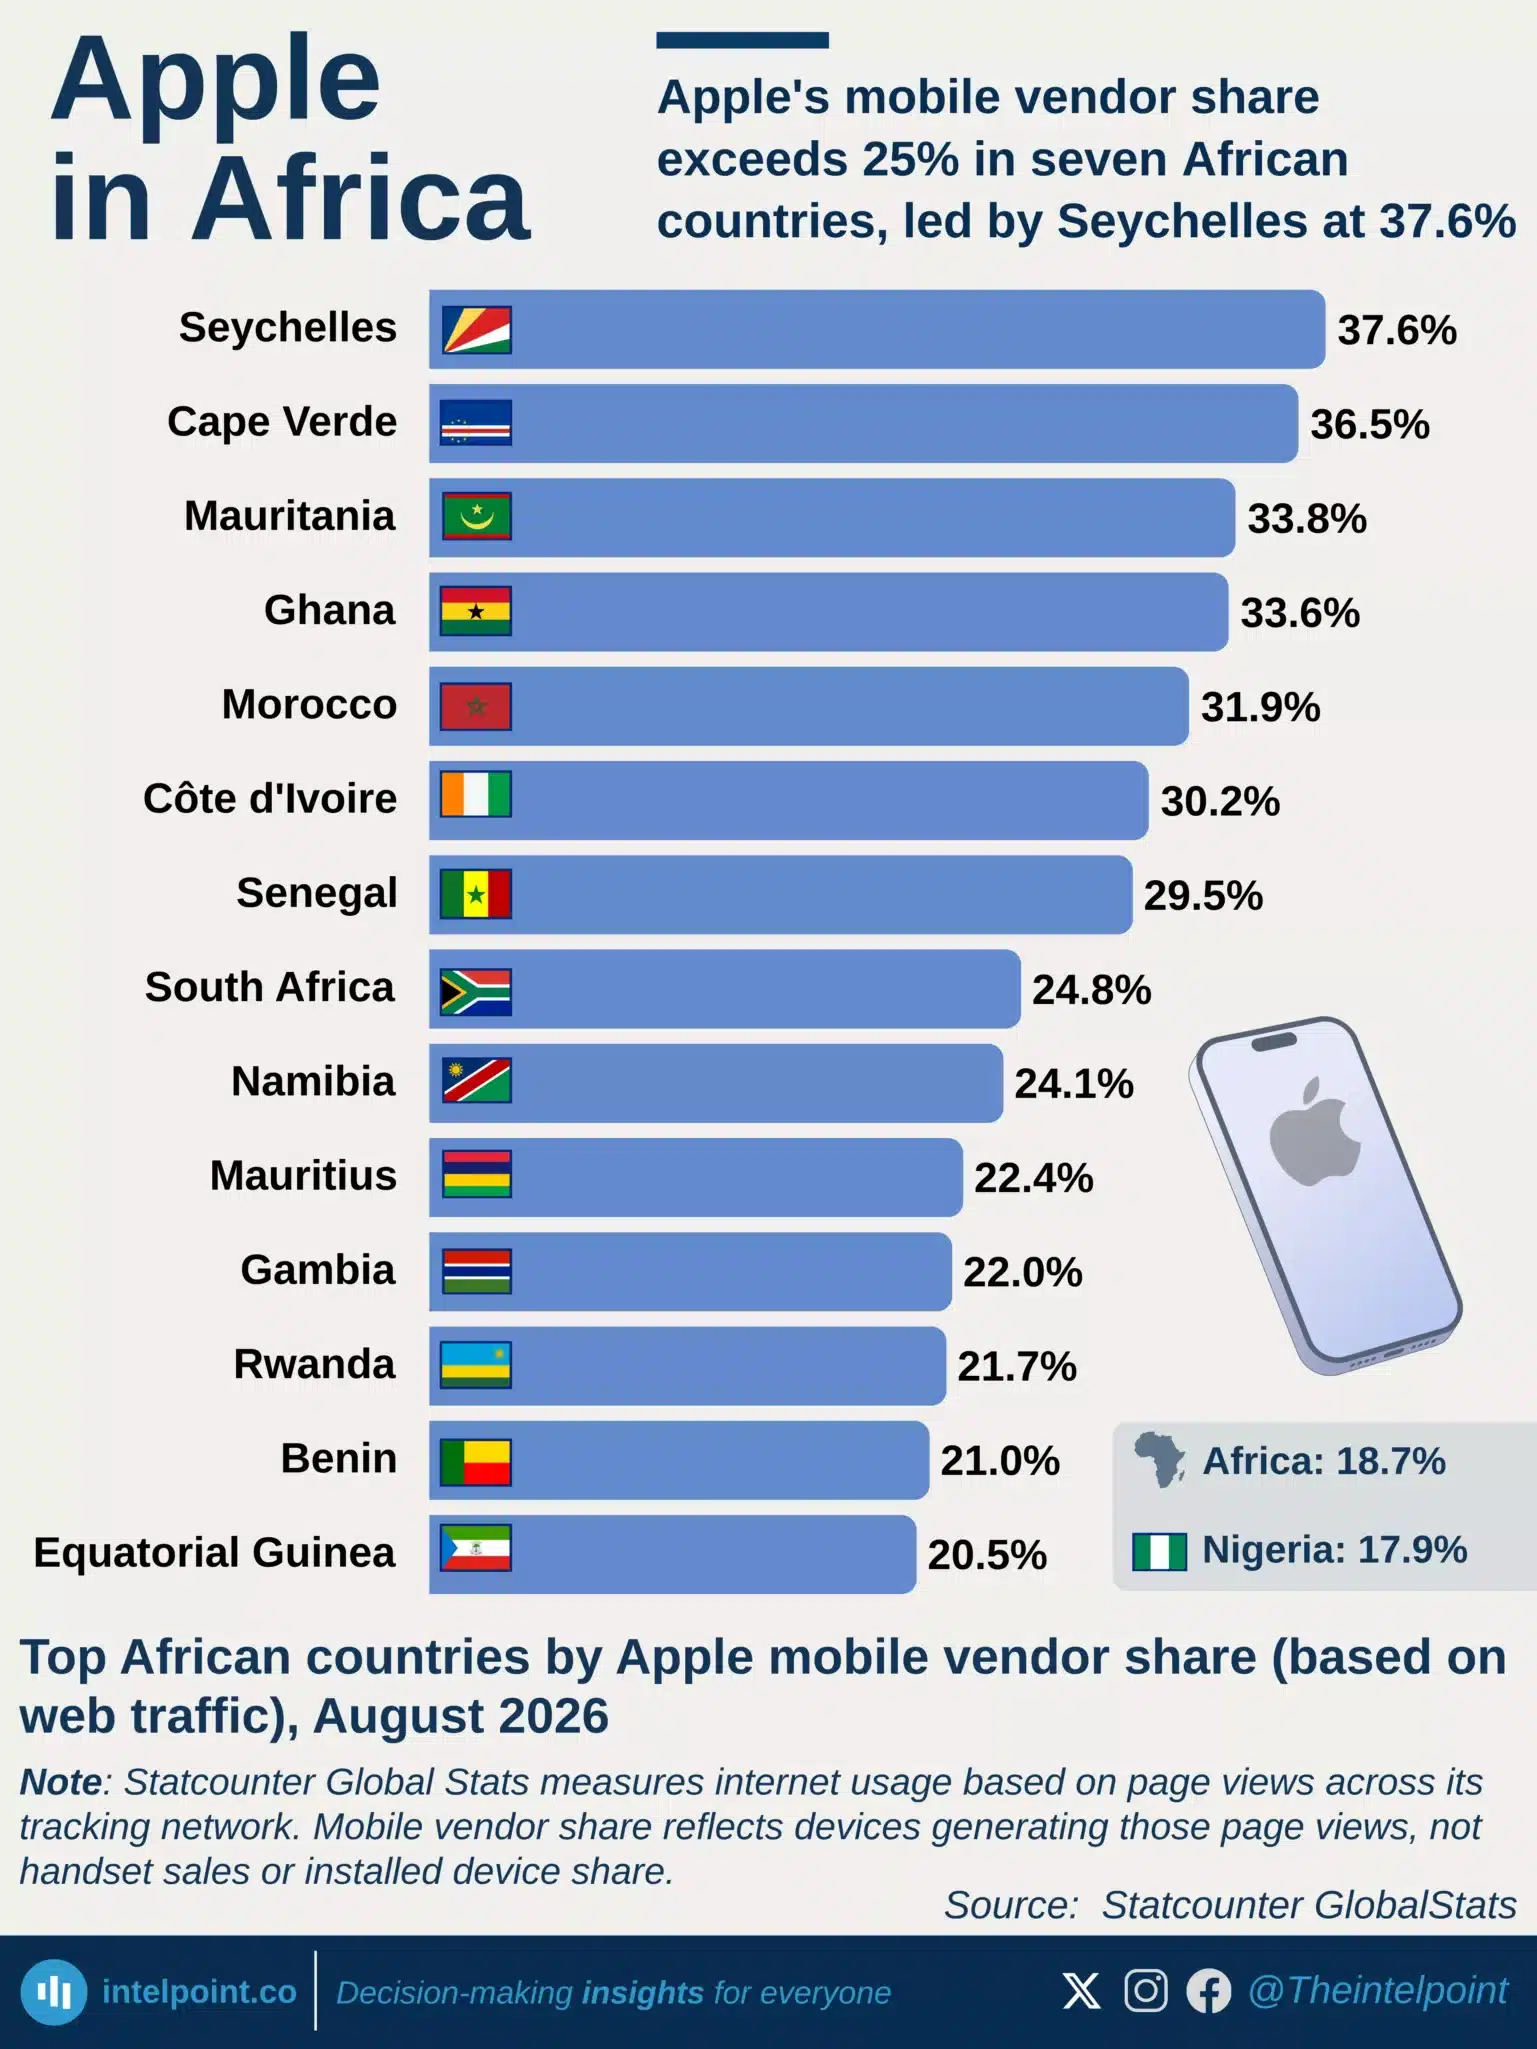
Apple's mobile vendor share exceeds 25% in seven African countries, led by Seychelles at 37.6%
  • Apple exceeds 25% share in 7 African countries, led by Seychelles at 37.6%.
  • Cape Verde and Mauritania follow, at 36.5% and 33.8%, respectively.
  • South Africa trails just below 25%, with a 24.8% share.
  • Nigeria’s 17.9% share is close to Africa’s 18.7% average, despite its market size.
  • These figures measure web traffic, not device sales or installed smartphone base.

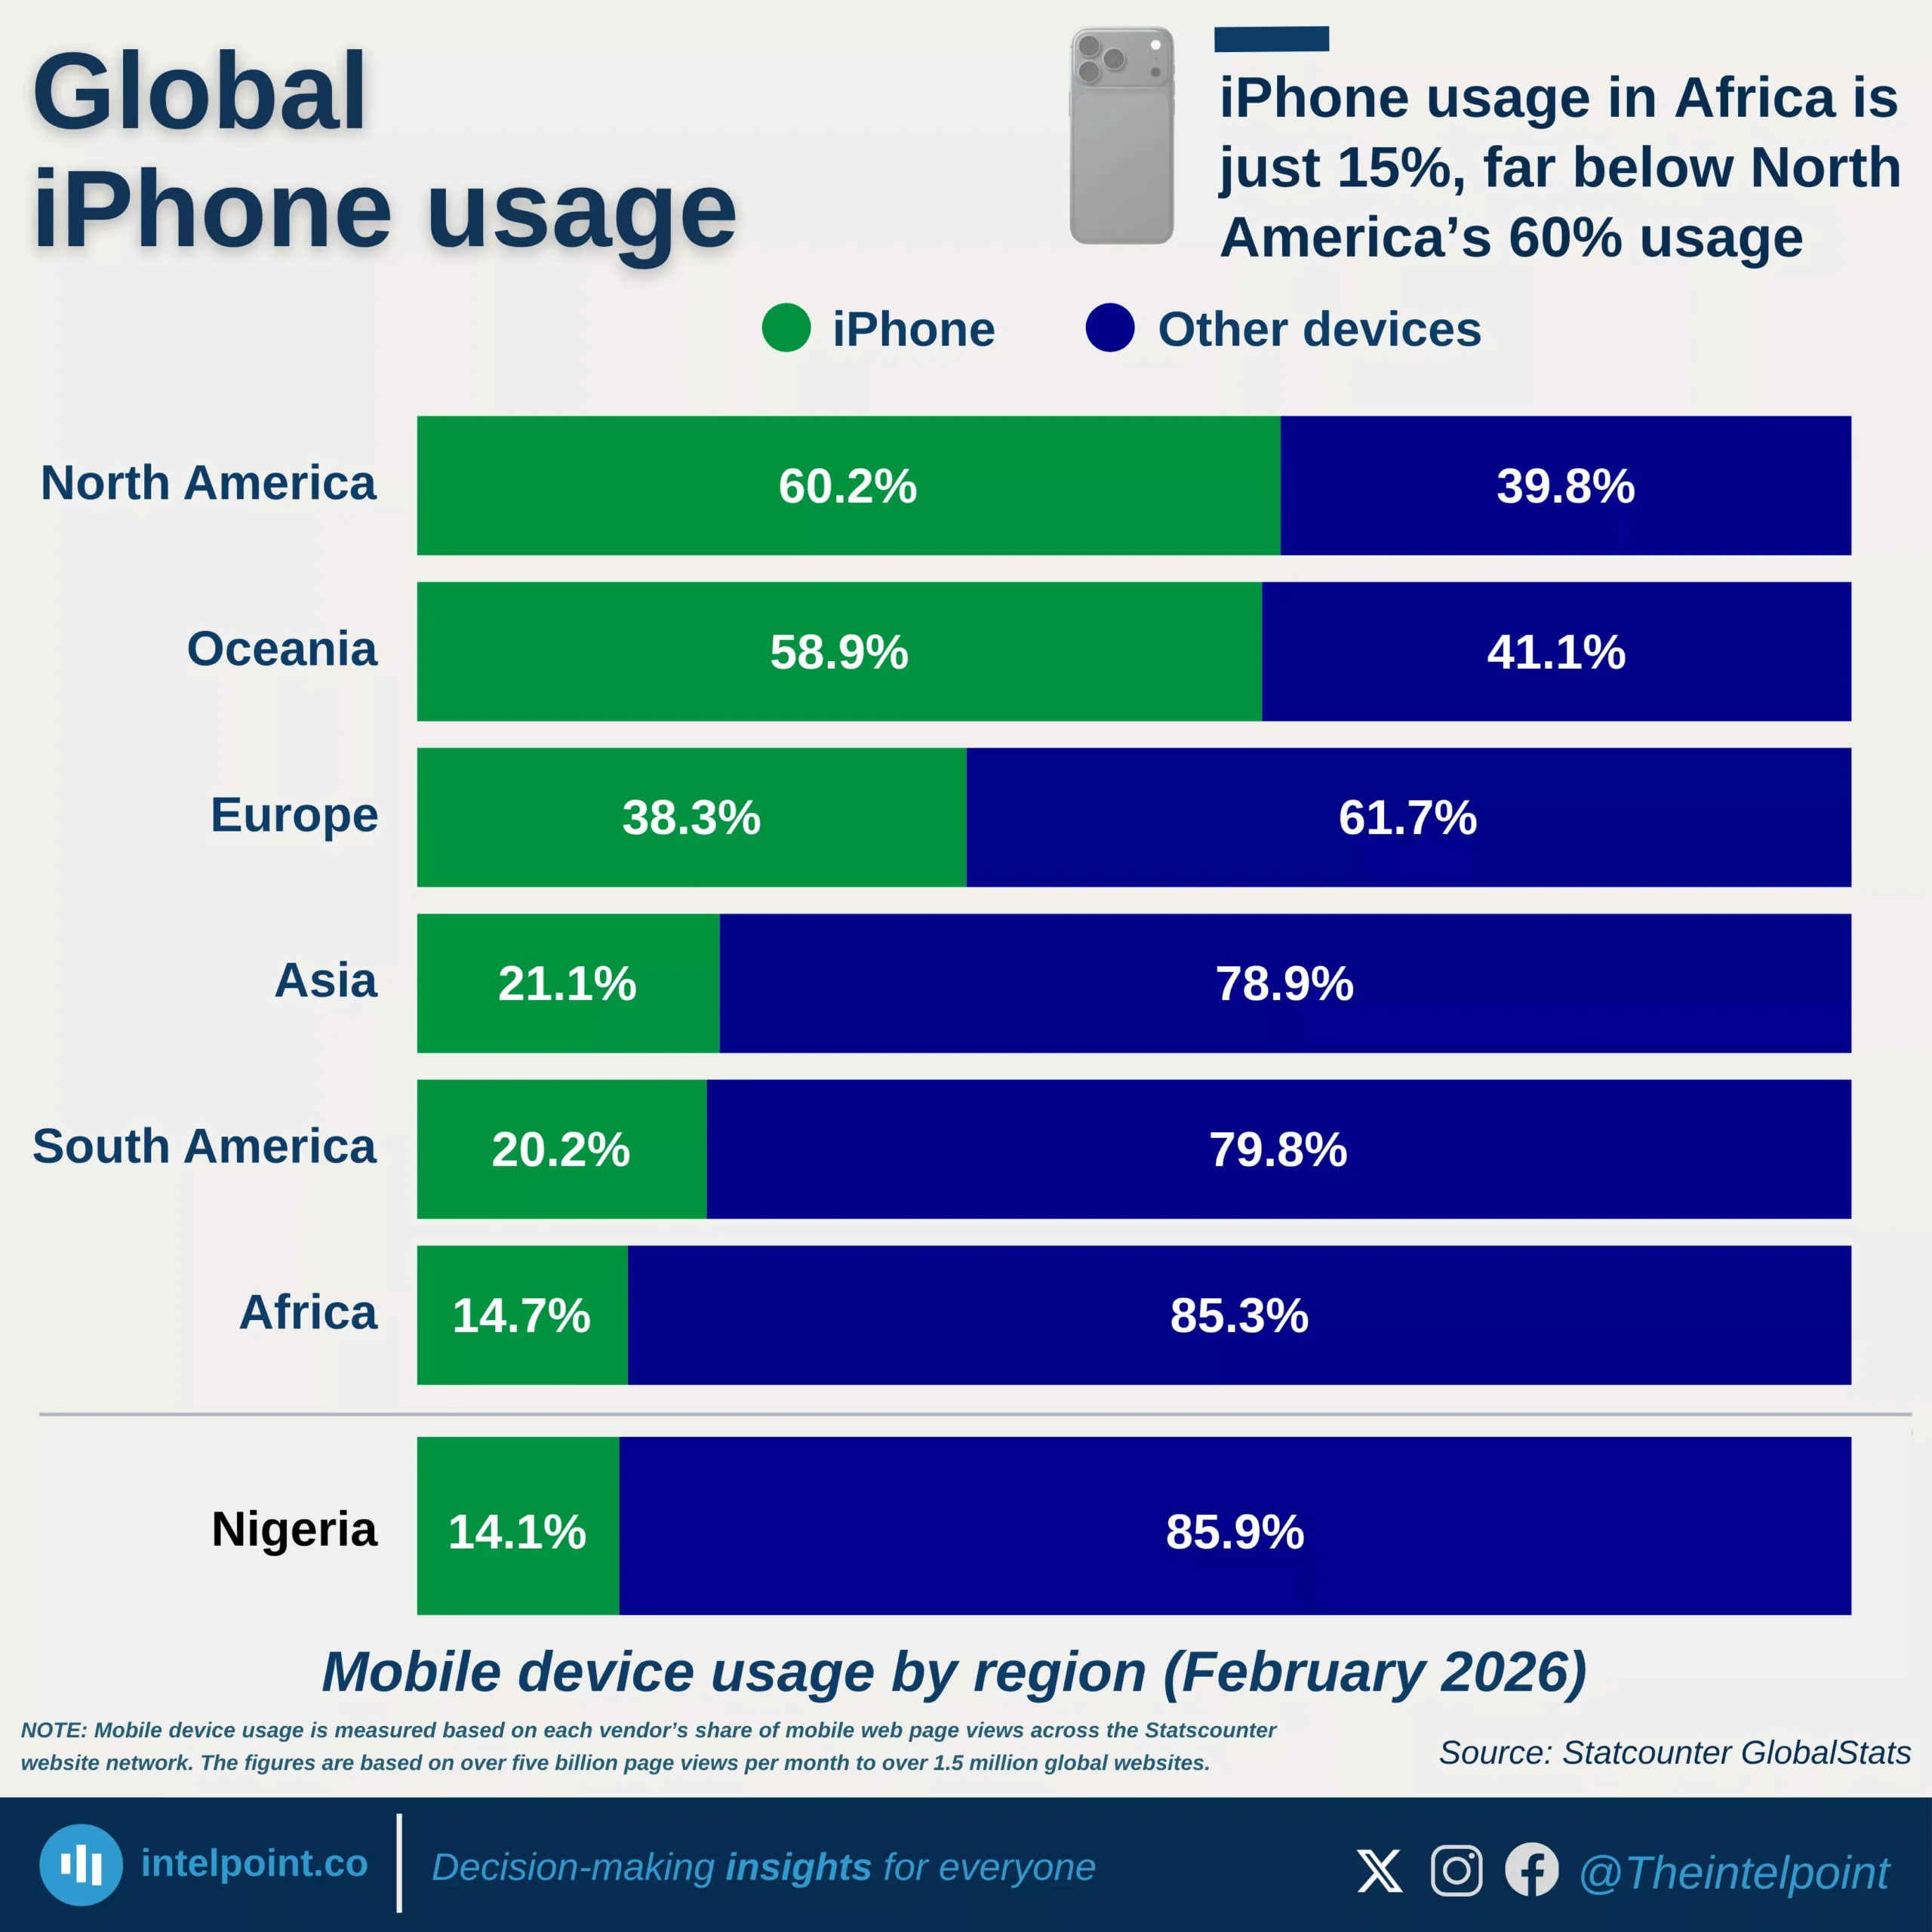
iPhone usage in Africa is just 15%, far below North America’s 60% usage
  • North America leads globally with 60.2% iPhone usage, making it the largest iPhone market.
  • Oceania follows at 58.9%, showing similar consumer preferences to North America.
  • Africa has the lowest iPhone share (14.7%), highlighting a significant adoption gap.
  • Nigeria aligns with the continental trend at 14.1%, reinforcing that the gap is structural, not country-specific.

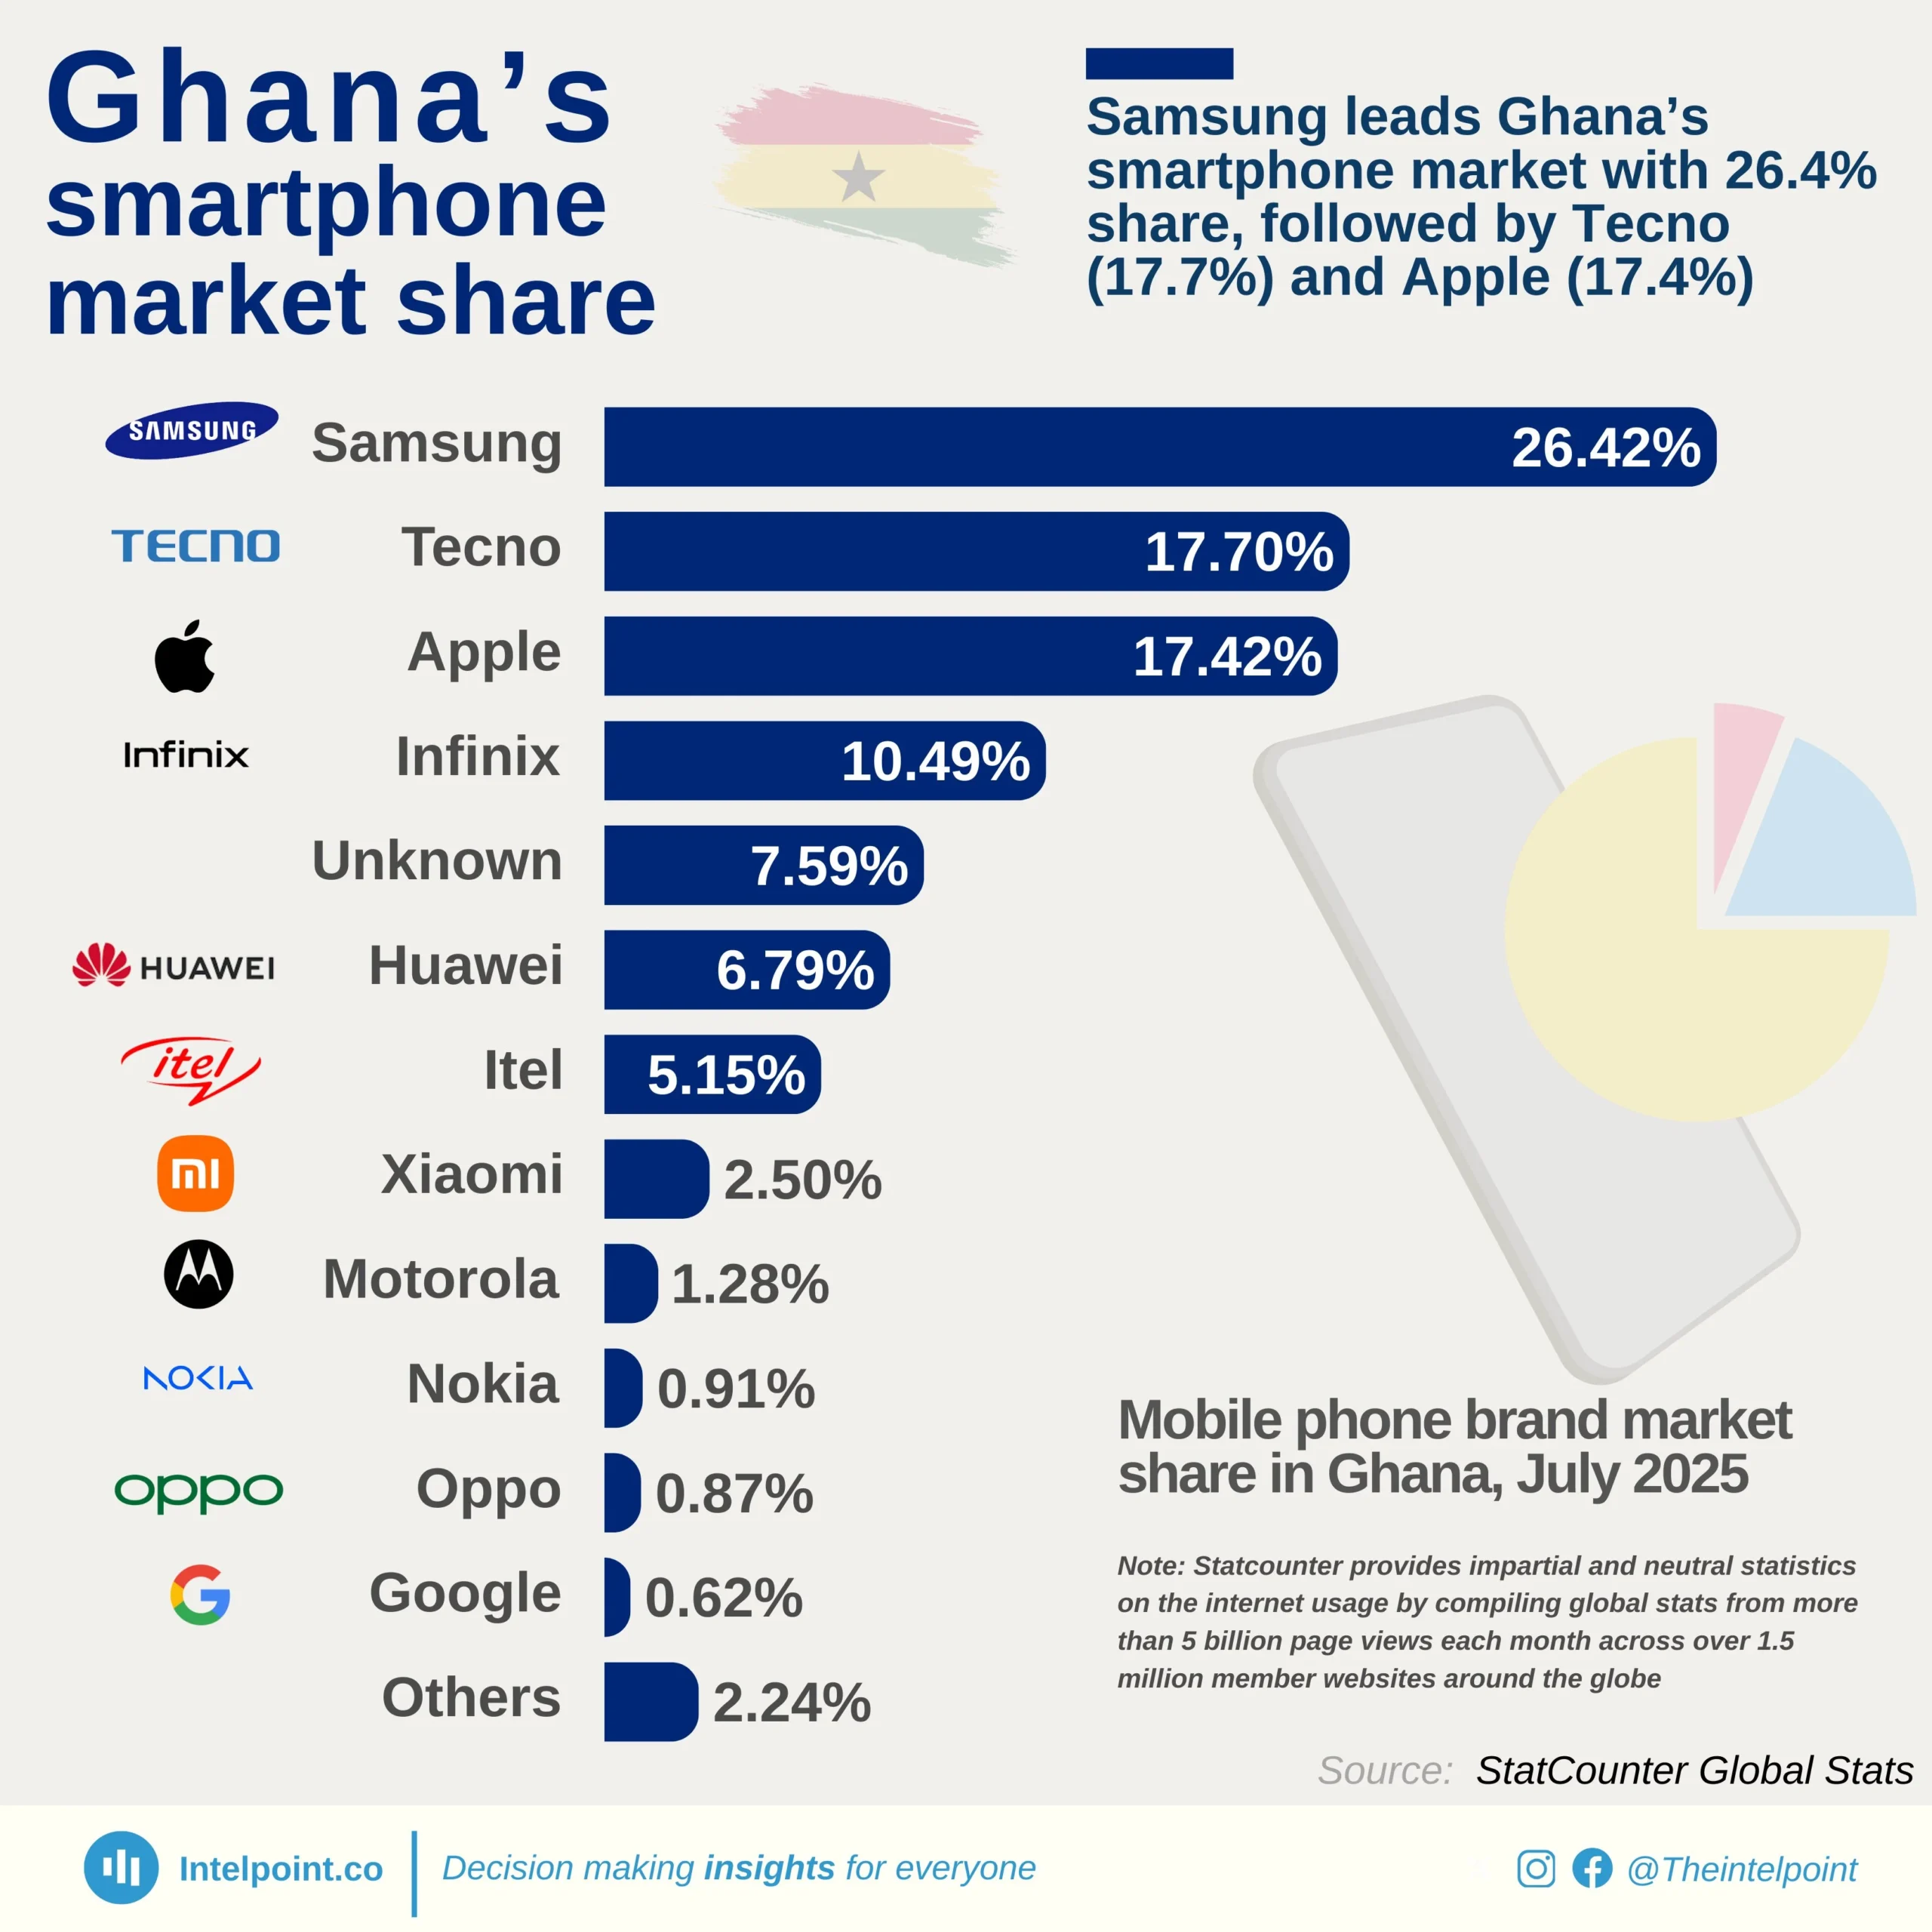
Samsung leads Ghana’s smartphone market with 26.4% share, followed by Tecno (17.7%) and Apple (17.4%)
  • Samsung dominates with 26.42% of Ghana’s smartphone market, making it the clear leader.
  • Tecno (17.7%) and Apple (17.4%) are in a tight race for second place, separated by just 0.3 percentage points.
  • Infinix (10.5%) and Itel (5.2%) highlight the strong presence of Transsion Holdings brands in Ghana.
  • Global giants like Huawei (6.8%) and Xiaomi (2.5%) lag behind, showing Ghana’s preference for budget-friendly African-focused brands.

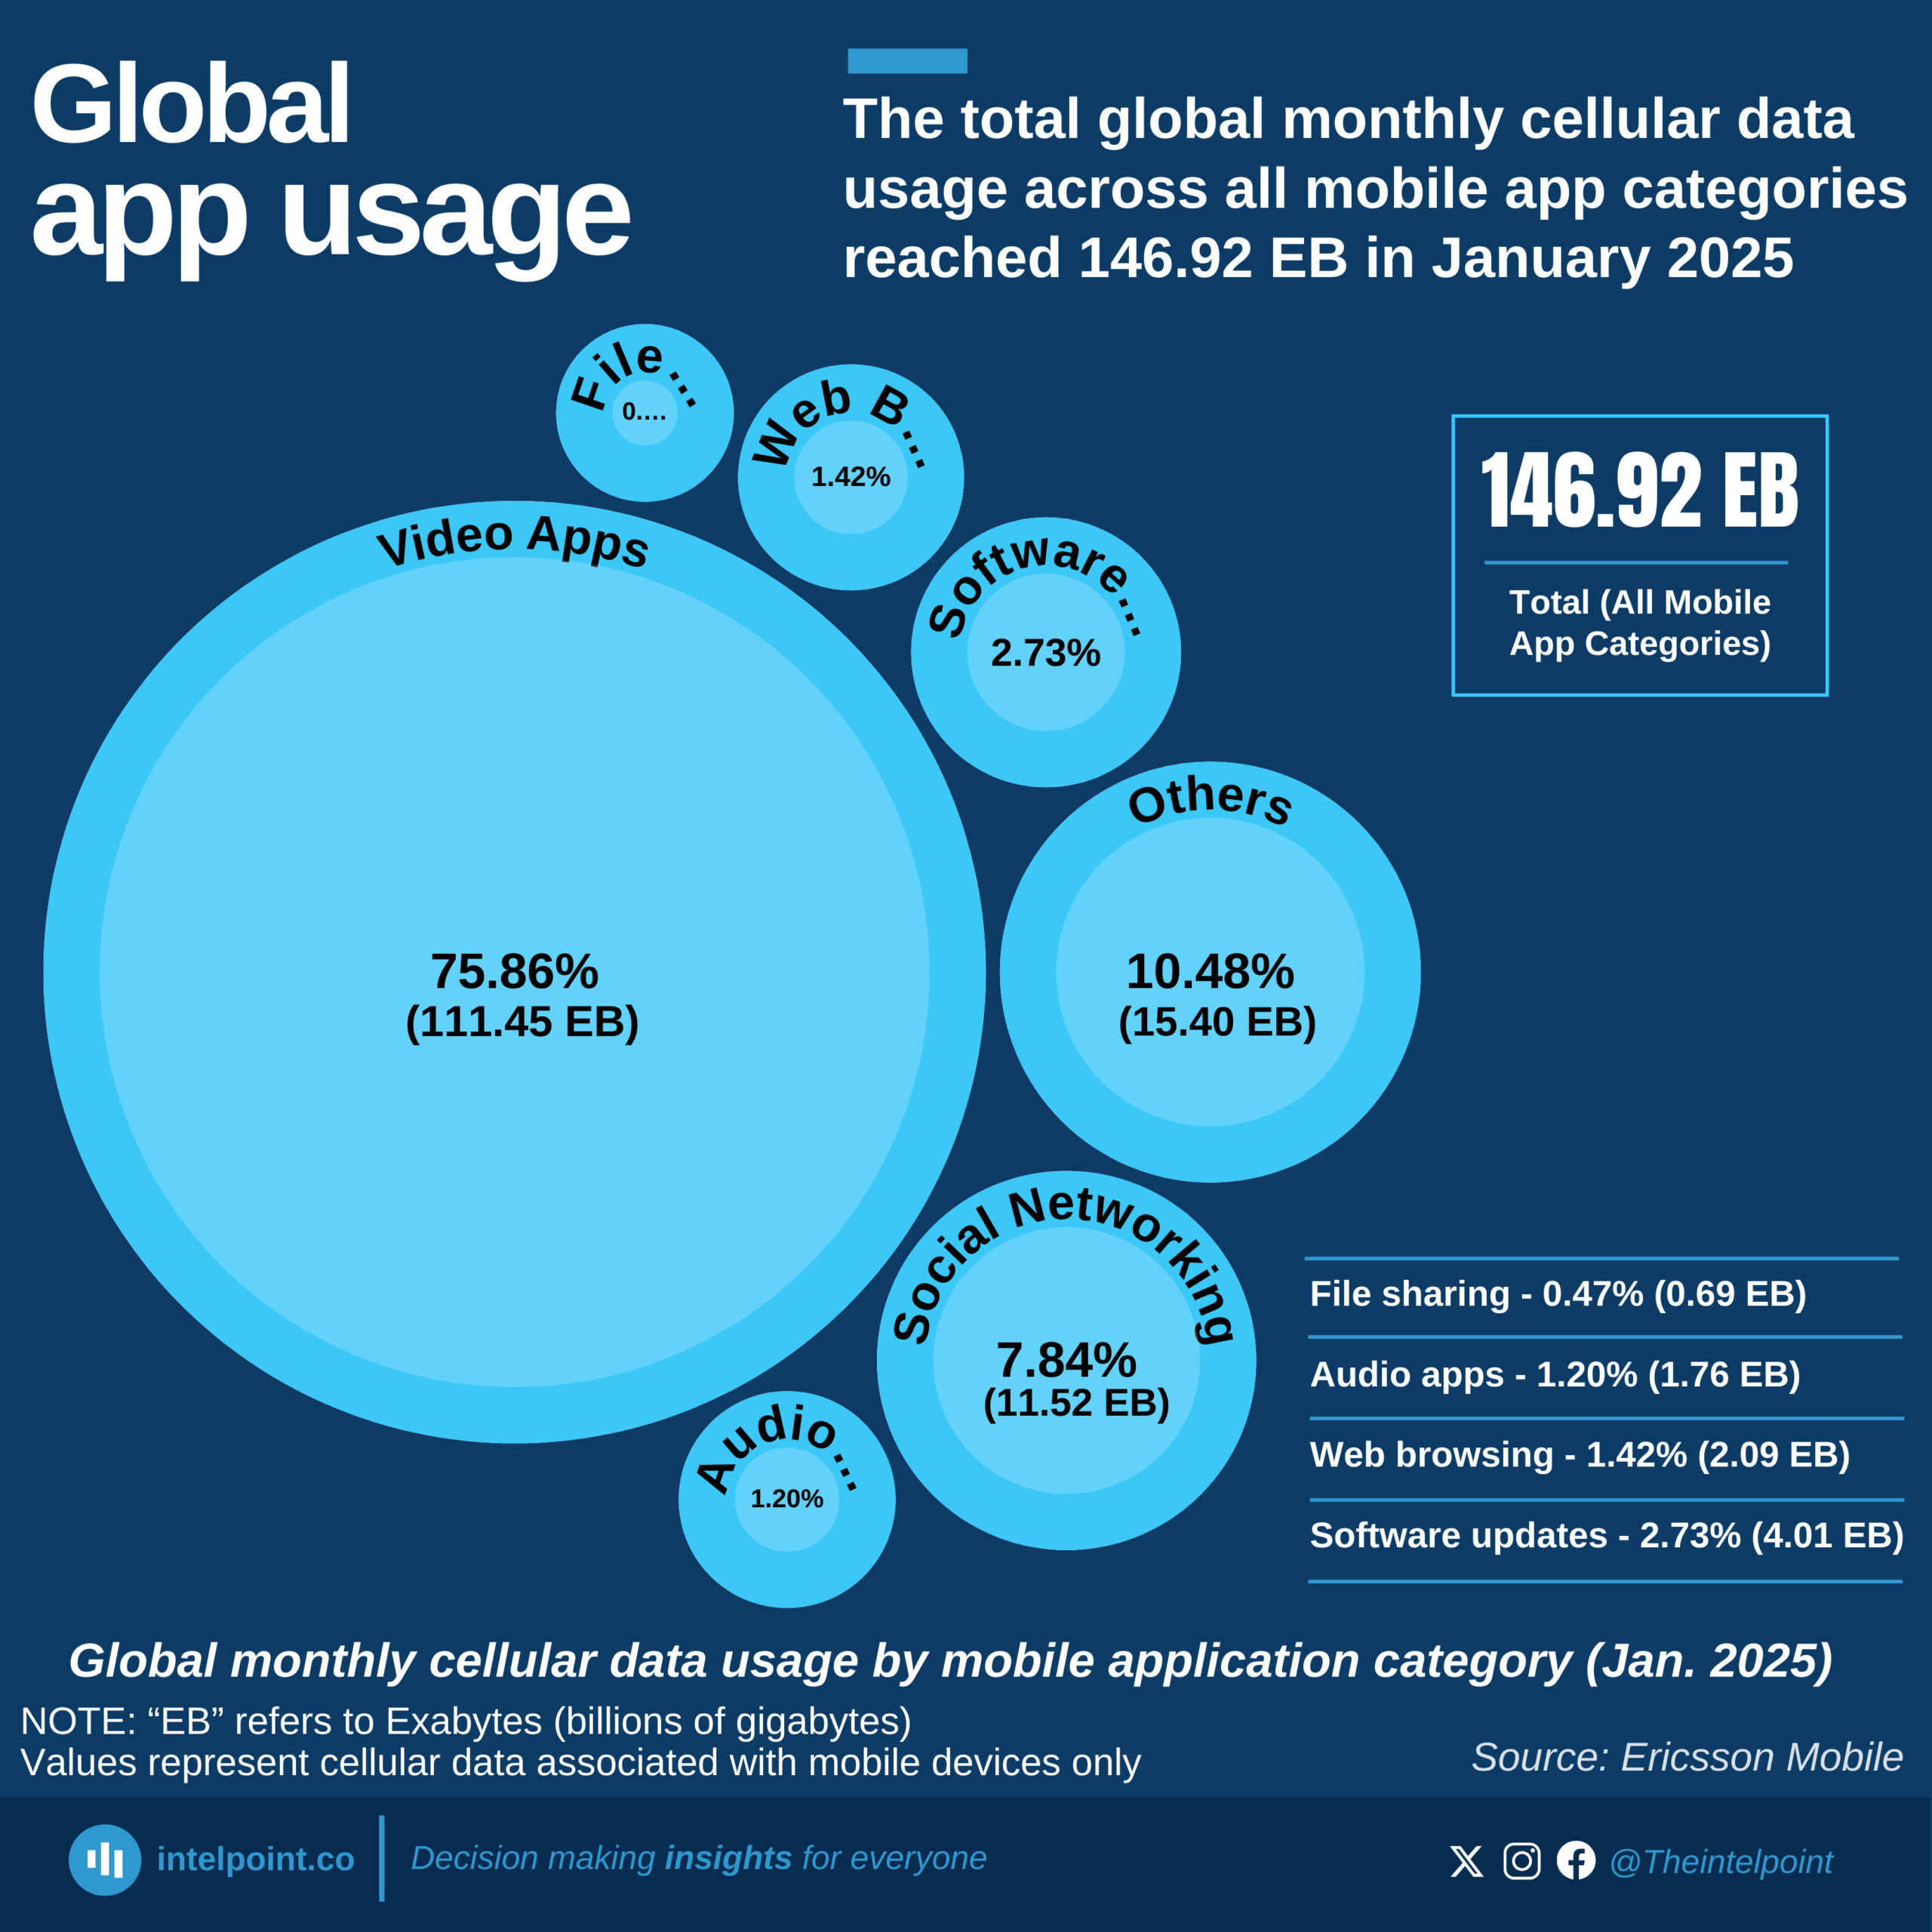
The total global monthly cellular data usage across all mobile app categories reached 146.92 EB in January 2025
  • Video apps consumed 75.86% of the total global mobile data, making them by far the largest data users.
  • Social networking apps accounted for 7.84% of the total data usage, translating to 11.52 exabytes.
  • The "Others" category, which includes smaller app groups, made up 10.48% of global mobile data usage.
  • Software updates consumed 2.73% of the global mobile data volume, equivalent to 4.01 exabytes.
  • Web browsing took up 1.42% of mobile data use globally, accounting for 2.09 exabytes.
  • Audio apps like streaming music services accounted for 1.20% of the total mobile data usage.
  • File sharing applications consumed just 0.47% of the mobile data globally, indicating a relatively small share compared to other categories.

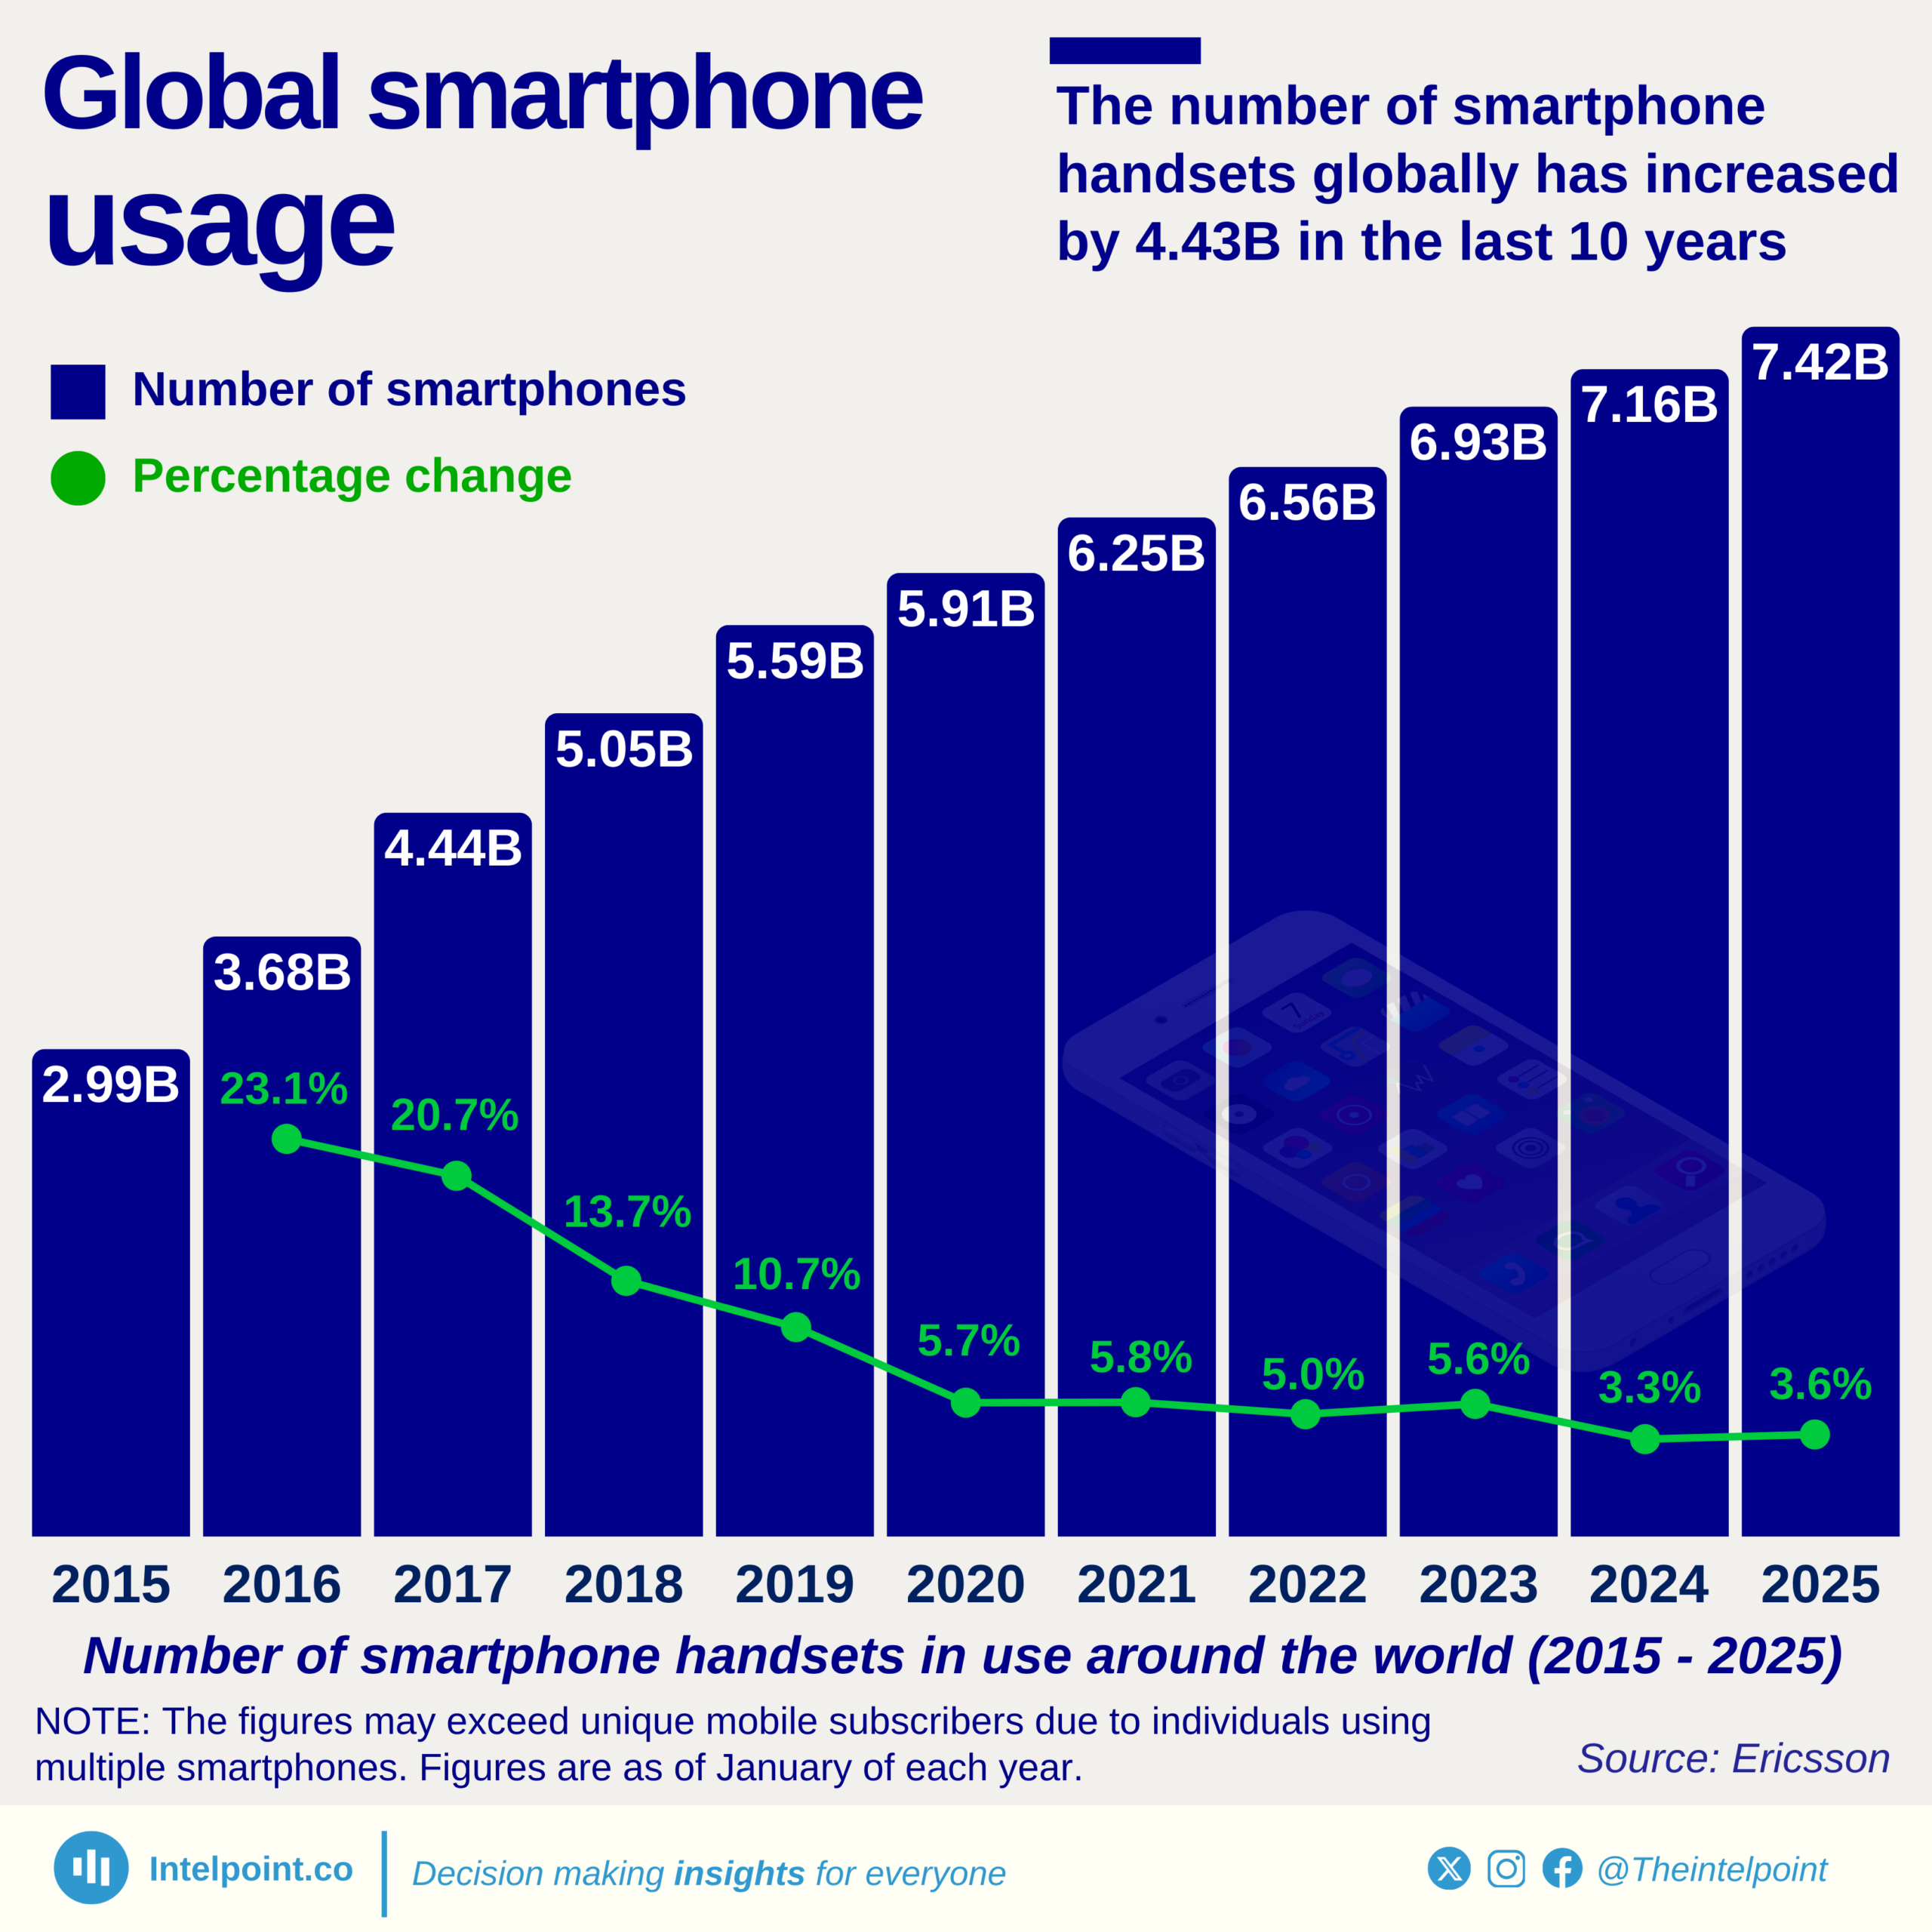
The number of smartphone handsets globally has increased by 4.43B in the last 10 years
  • From 2.99B in 2015 to 7.42B in January 2025, the world has added more than 4.4 billion smartphone devices in a decade.
  • Annual growth dropped from a high of 23.1% in 2016 to 3.6% in 2025, a clear sign of global market saturation.
  • During 2016-2018, the world added nearly 2 billion new smartphones.
  • Since 2020, annual growth has been under 6%.
  • Most of the future growth will come from device upgrades or multiple device ownership, not necessarily new smartphone users.

POPULAR TOPICS
SIGN UP TO OUR NEWSLETTER
Get periodic updates about the African startup space, access to our reports, among others.
Subscribe Here
Subscription Form

A product of Techpoint Africa. All rights reserved