Over the past 20 years, Morocco has maintained a consistent trade surplus in digital services, totaling $26.44 billion

key takeaways:

  • Morocco recorded a total of $61.75 billion digital services trade exports and $35.31 billion imports, revealing a staggering $26.44 billion trade profit in 20 years.
  • Morocco has always been the leading country in Africa as far as digital services trade is concerned.
  • From 2005-2024, Morocco digital services exports have always outpaced imports.
  • Morocco digital export earnings have grown from $1.11b in 2005 to $6.74b in 2024, revealing over 500% growth in 20 years.
  • Imports during the same time-frame reached 3.17b from $780m in 2025.

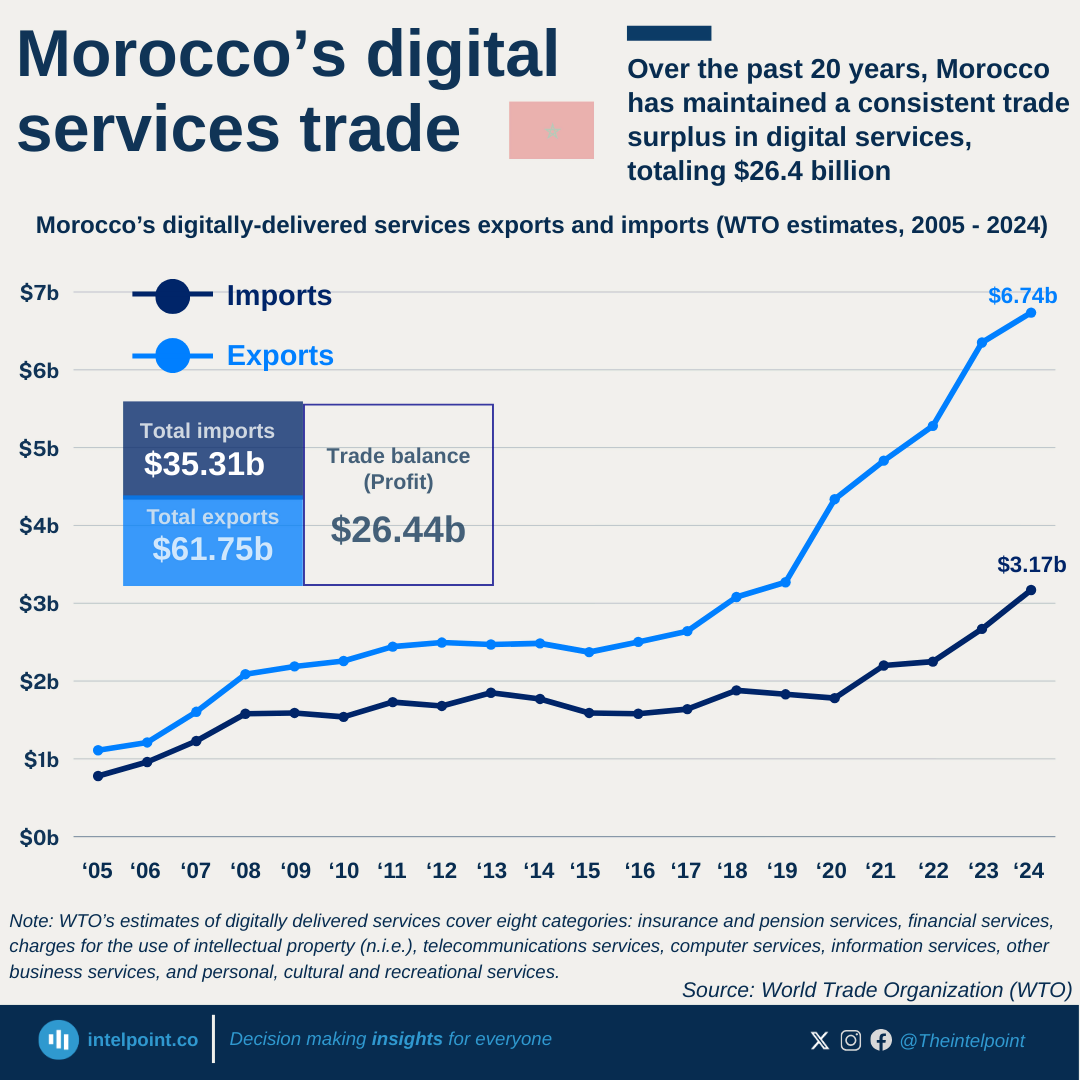
Morocco has positioned itself as a giant in the digital services trade in Africa with the remarkable growth in its digital services trade over the past two decades, recording a staggering $61.75 billion in exports and $35.31 billion in imports, resulting in a $26.44 billion trade surplus.

Between 2005 and 2024, Morocco's digital exports have consistently outpaced imports, showcasing a thriving digital economy. Digital services export earnings have experienced an exceptional surge, growing from $1.11 billion in 2005 to an estimated $6.74 billion in 2024. This growth represents an impressive increase of over 500% over the past 20 years. Conversely, Morocco's digital imports have also risen substantially, reaching $3.17 billion in 2025 from a modest $780 million in 2005.

The consistent upward trajectory in Morocco’s digital services trade highlights the country's growing prominence in the global digital economy. The nation's export success reflects both its expanding tech sector and its increasing competitiveness in international markets. With a projected continued growth in the digital services industry, Morocco is set to further cement its position as a key player in the global digital trade landscape.

Source:

World Trade Organization

Period:

2005-2024
HTML code to embed chart
Want a bespoke report?
Reach out
Tags
Related Insights

Lagos, Rivers, and four other states account for 52% of all Nigerian states' domestic debt and 40% of their external debt
  • Lagos dominates Nigeria’s subnational debt profile, accounting for 26.1% of domestic debt and 21.8% of external debt.
  • Six states account for 52% of domestic debt.
  • The same group contributes 40% of the external debt
  • Rivers ranks second in domestic debt (9.5%) but has a significantly lower external debt (3.8%).
  • Kaduna emerges as a major external borrower (13.7%) despite not appearing among the top domestic debt states.

Finance & Insurance now makes up 30% of Nigeria’s domestic company income tax, up from 12% in 2022
  • Company income tax collections rose from ₦1.7tn in 2022 to ₦5.0tn in 2025.
  • Finance & Insurance more than doubled its share, from 12.4% to 30.0%.
  • Finance became the largest single sector in the tax mix by 2025.
  • Manufacturing remained important, but its share fell from 27.9% to 17.7%.
  • ICT saw one of the sharpest declines, from 21.6% to 6.5%.
  • Mining & quarrying gained weight, rising from 8.4% to 14.5%.
  • Wholesale & retail also increased, from 3.6% to 7.0%.
  • The tax base became less evenly distributed across sectors.

Nigeria's VAT collections have more than tripled in three years
  • Nigeria’s total VAT rose from ₦2.5tn in 2022 to ₦8.6tn in 2025.
  • VAT collections more than tripled in four years.
  • Local VAT remained the largest source of VAT throughout the period.
  • Local VAT increased from ₦1.5tn to ₦4.5tn.
  • Local VAT averaged 54.4% of total VAT between 2022 and 2025.
  • Import VAT also grew strongly, from ₦521.5bn to ₦2.0tn.
  • Other payment channels rose from ₦510.8bn to ₦2.1tn.
  • VAT growth is increasingly being driven by non-import activity.

Nigeria's non-oil exports grew faster than oil exports in 2024 and 2025, though oil remained dominant
  • In 2025, non-oil export growth (36%) was 6x higher than oil (6%).
  • In 2024, non-oil exports grew by 189% vs oil’s 108%.
  • Total exports still heavily depend on oil.
  • Export value rose from ₦36 trillion in 2023 to ₦85.1 trillion in 2025.

Agriculture’s share of Nigeria’s capital imports peaked at 5.46% in 2021 before falling to 0.72% in 2025
  • Agriculture’s share of Nigeria’s capital imports peaked at 5.46% in 2021
  • After 2025, agriculture's share started falling sharply, reaching 0.72% in 2025.
  • Between 2017 and 2021, the sector experienced consistent growth in both value and share.
  • Capital import value peaked at at $489.9 million in 2019.

Nigeria imported 10x more from Asia than from Africa in 2025
  • Asia is Nigeria’s top import source in 2025.
  • The highest import value from Asia was recorded in Q1 at ₦8.7 trillion.
  • Imports from Europe surged to ₦8.6 trillion in Q2 but declined to ₦6.6 trillion by Q4.
  • Imports from America showed continuous growth, rising from ₦2.9 trillion in Q1 to ₦6.6 trillion in Q4.
  • Imports from Africa remained below ₦1 trillion across most quarters.

POPULAR TOPICS
SIGN UP TO OUR NEWSLETTER
Get periodic updates about the African startup space, access to our reports, among others.
Subscribe Here
Subscription Form

A product of Techpoint Africa. All rights reserved