Nigeria's trade surplus peaked at ₦16.8t in 2012, reaching its lowest in 2023

  • Between 2008 and 2015, Nigeria experienced consistent trade surpluses.
  • In 2023, Nigeria recorded the least trade surplus in 16 years since 2008.
  • Nigeria recorded trade deficits in three years (2016, 2020, and 2021) since 2008.
  • 2021's ₦1.9 trillion deficit marked a downturn in trade performance

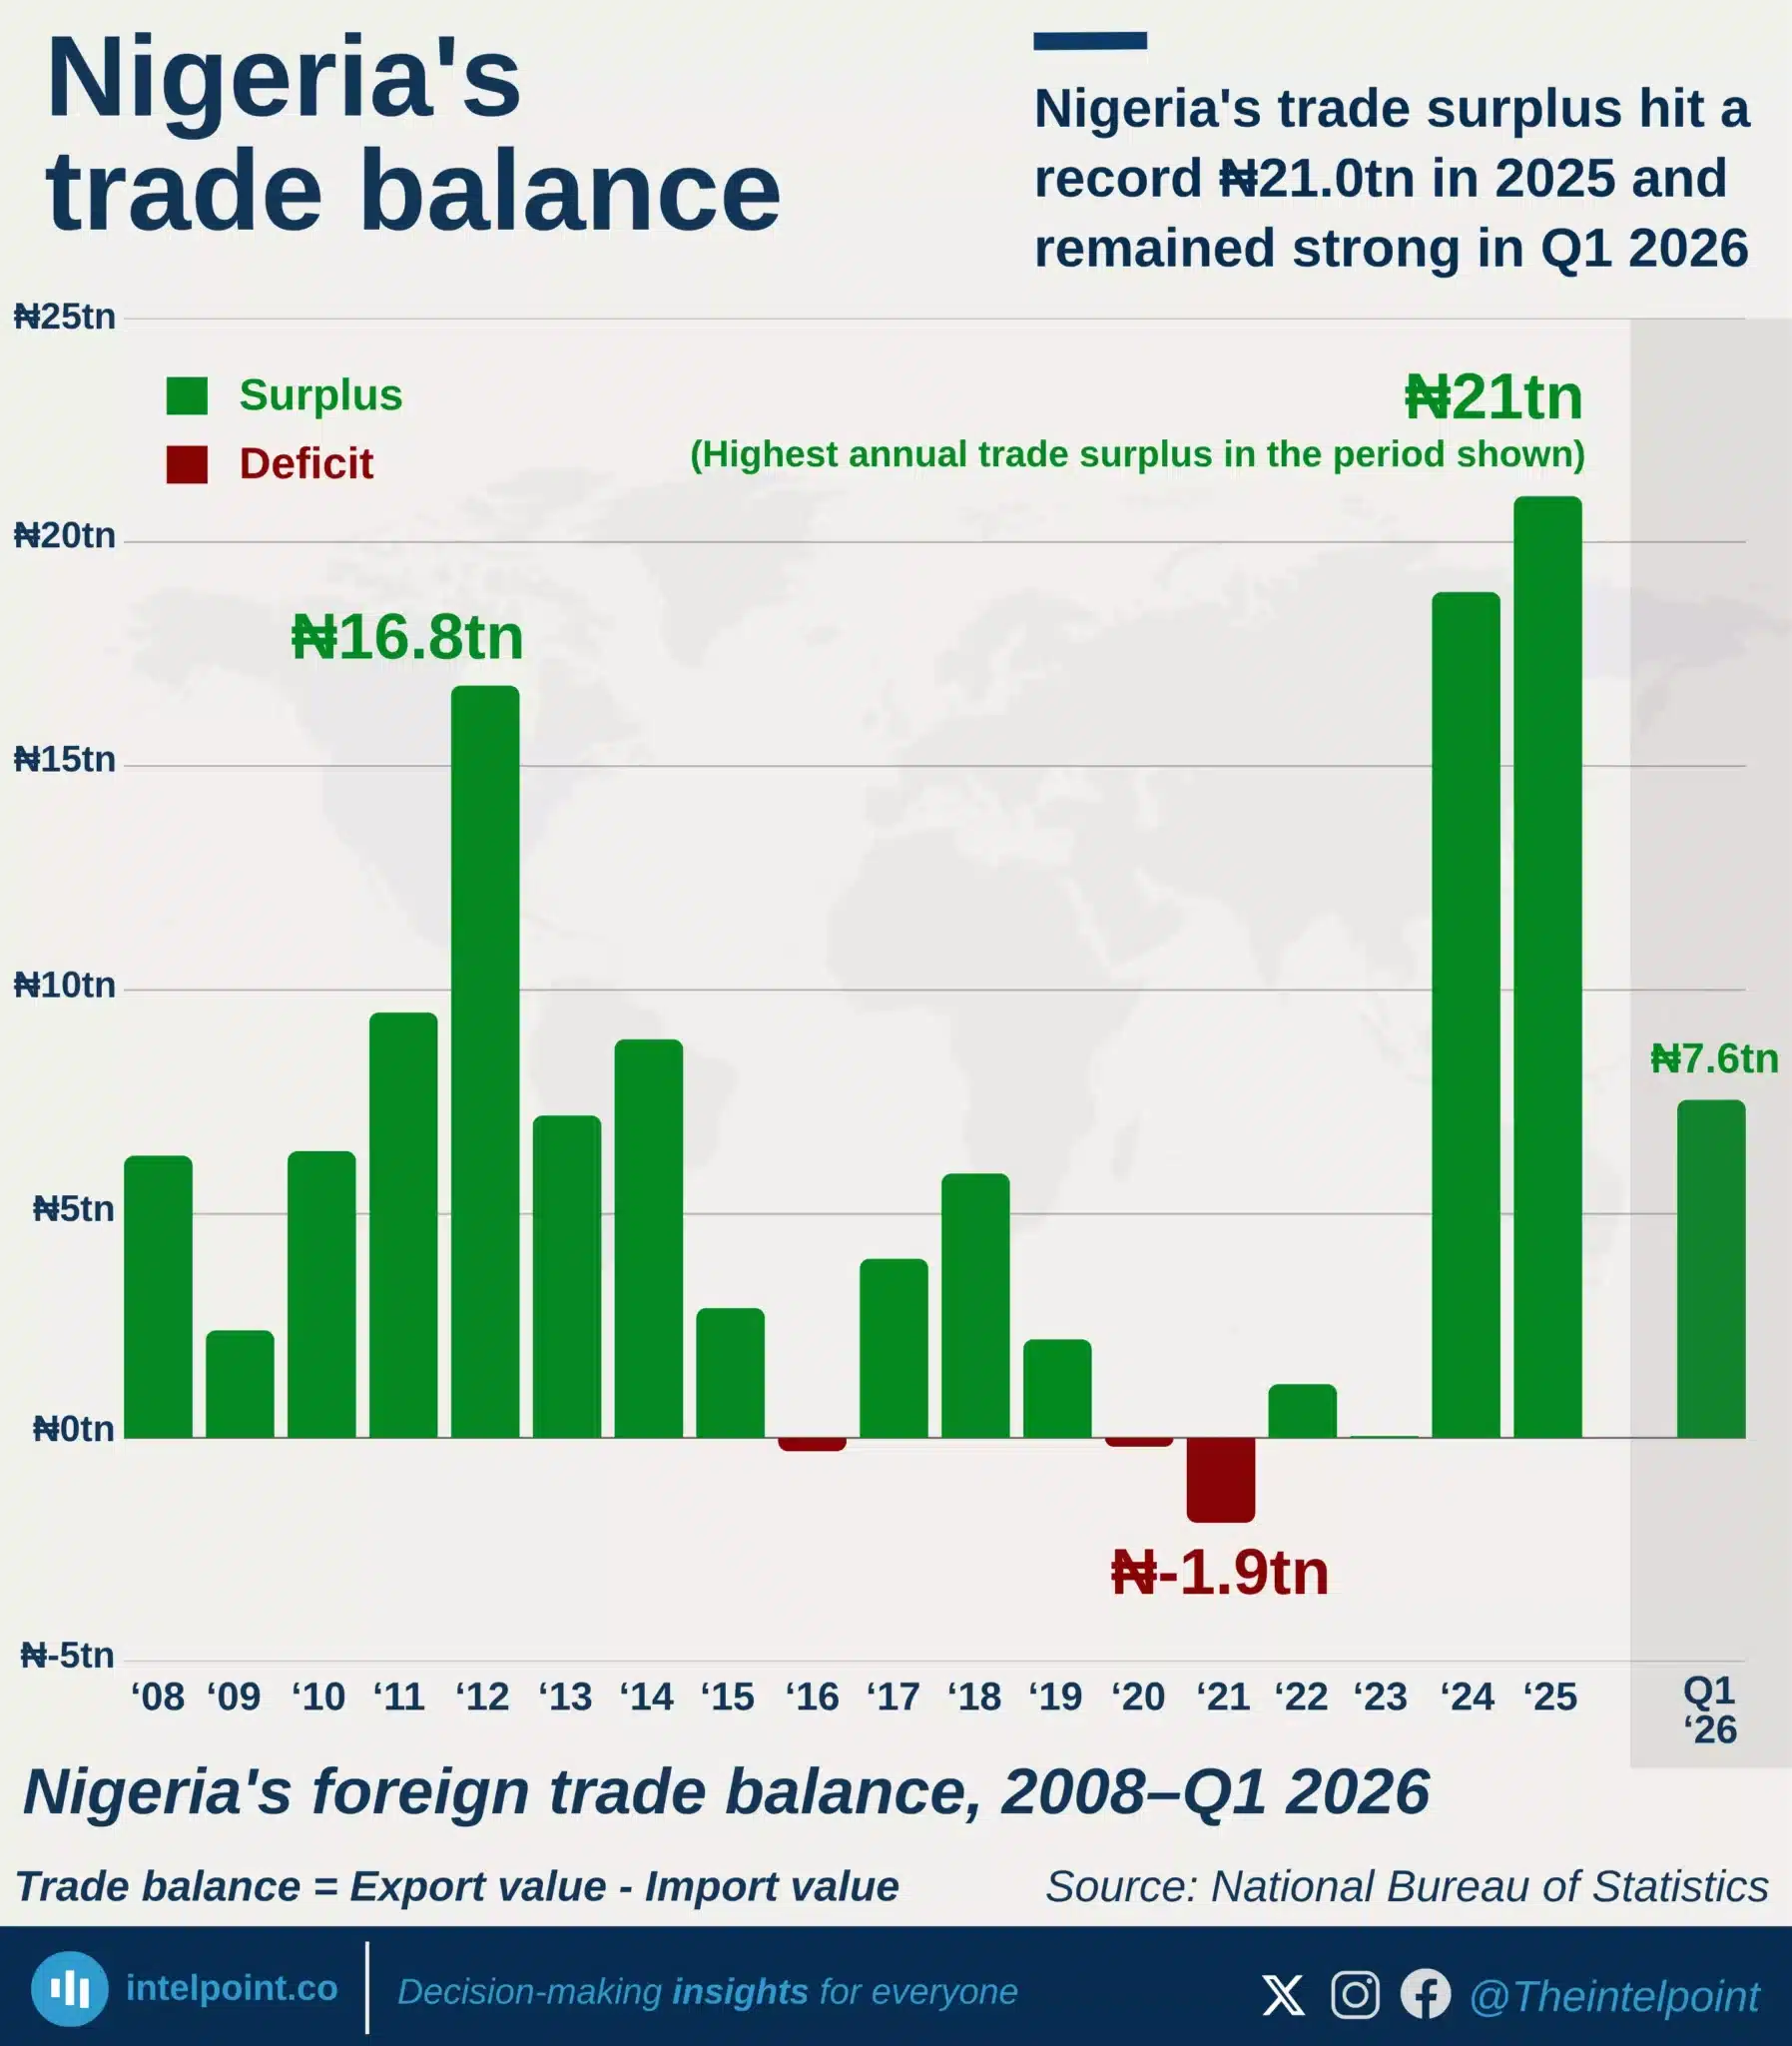
The period from 2008 to 2015 saw Nigeria’s trade balance soar, with consistent surpluses indicative of a thriving export sector.

Years with trade deficits, like 2016, 2020, and 2021, suggest that Nigeria was spending more on foreign goods than it earned from exports. This could have led to a trade imbalance that negatively affected economic stability and growth.

By 2023, Nigeria’s trade balance was ₦44.8b, the lowest recorded in the period.

Source:

National Bureau of Statistics

Period:

2008 - 2023
HTML code to embed chart
Want a bespoke report?
Reach out
Tags
Related Insights

China dominates Nigeria’s imports while Spain leads as top export destination in Q2 2025
  • China remains Nigeria’s largest import partner, accounting for ₦4.96T or 32.45% of total imports—more than double the U.S.'s share.
  • The United States holds second place in imports, contributing ₦2.16T (14.12%), while India, the Netherlands, and the UAE follow with smaller shares below 6%.
  • Spain tops Nigeria’s export market, receiving ₦2.47T worth of goods, representing 10.85% of total exports.
  • Europe features strongly among export partners, with Spain, France, and the Netherlands together absorbing nearly a quarter of Nigeria’s outbound trade.

Togo emerges as Nigeria’s largest African trading partner in Q2 2025
  • Togo leads on both sides of trade, supplying ₦211.99B in imports and receiving ₦811.97B in exports, making it Nigeria’s strongest African partner by value.
  • South Africa ranks second, with imports of ₦115.15B and exports of ₦473.65B, reflecting deep bilateral trade ties.
  • Côte d’Ivoire also features prominently, sending ₦106.15B worth of goods to Nigeria while importing ₦408.97B, showing balanced engagement.
  • West Africa dominates Nigeria’s intra-African trade, with Togo, Côte d’Ivoire, and Ghana collectively accounting for a significant share of regional exports.

Manufactured goods drove imports as oil products pushed total to ₦15.29 trillion in Q2 2025
  • ₦7.88 trillion worth of manufactured goods made up 51.6% of imports, underscoring Nigeria’s dependence on foreign industrial products.
  • Other petroleum oil products accounted for ₦2.79 trillion (18.2%) of imports, showing continued reliance on external energy supplies despite Nigeria’s oil-rich status.
  • ₦1.72 trillion in raw material imports (11.3%) highlights the gap in local processing capacity.
  • Solid minerals (₦70.9 bn, 0.46%) and energy goods (₦150 mn, almost 0%) show almost no role in imports.

Nigeria’s foreign trade hit ₦38 trillion in Q2 2025, driven by strong export growth
  • Total trade in Q2 2025 was valued at ₦38.04tn.
  • Imports accounted for ₦15.29tn, led by manufactured goods and petroleum products.
  • Exports reached ₦22.75tn, boosted mainly by crude oil.
  • The trade gap favoured Nigeria with a surplus of ₦7.46tn.

Morocco leads Africa in digital trade surpluses, with $26 billion 20-year cumulative gain
  • Morocco achieved the highest cumulative surplus in Africa’s digital trade at $26.4 billion between 2005 and 2024.
  • Mauritius and Tunisia followed distantly with surpluses of $8.7 billion and $4.4 billion, respectively.
  • Nigeria and Angola recorded the deepest deficits, each exceeding $90 billion cumulatively.
  • Africa’s overall digital trade balance remained negative, averaging a -$618 million deficit in 2024.
  • Smaller economies like Kenya and Togo managed modest but consistent surpluses over the years.

In 2024, Asia and Europe together accounted for 63% of the world's copper export value
  • Asia leads global copper exports with 31.6% of total export value.
  • Europe follows closely at 31.4%, making the two regions nearly equal in contribution.
  • Combined, Asia and Europe control 63% of the global copper export market.
  • Africa ranks third globally, contributing 15.3% to copper exports.
  • Oceania plays the smallest role, with just 2% of the total export value.

POPULAR TOPICS
SIGN UP TO OUR NEWSLETTER
Get periodic updates about the African startup space, access to our reports, among others.
Subscribe Here
Subscription Form

A product of Techpoint Africa. All rights reserved