Djibouti's inflation peaked at 5.18% in 2022, its highest in a decade

  • Djibouti’s inflation reached a peak in 2022, with 5.18%, the highest in the past decade.
  • The lowest inflation rate occurred in 2015, with a negative value of -0.85%.
  • From 2014 to 2023, Djibouti experienced fluctuating inflation, with increases in 2016, 2019, and 2022.
  • Between 2022 and 2023, inflation decreased from 5.18% to 1.50%.
  • The year 2018 saw the lowest inflation among positive rates, with a modest 0.15%.
  • The overall trend shows periodic inflation spikes, particularly in 2016, 2019, and 2022, while other years maintained relatively stable or lower inflation.

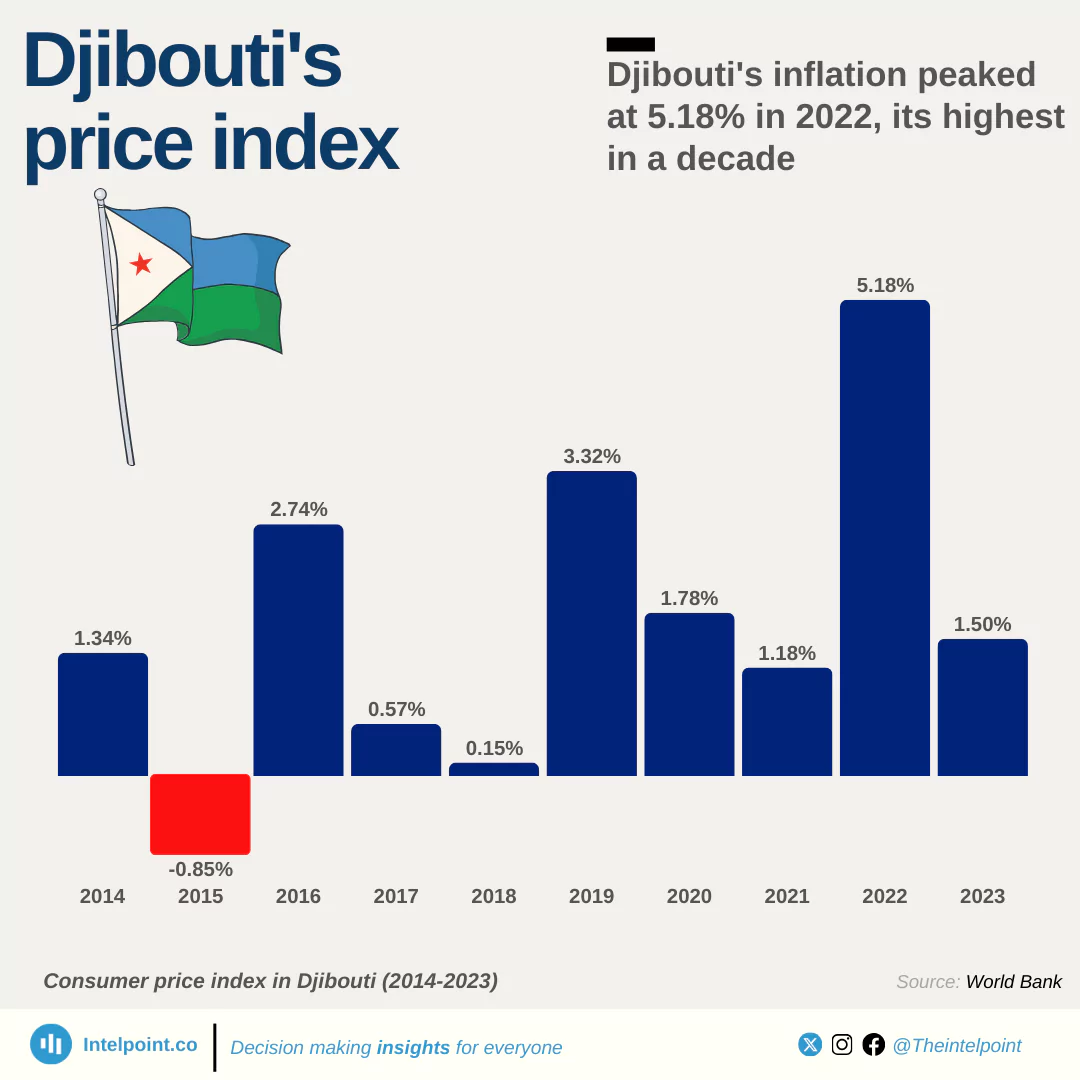
From the World Bank data, Djibouti’s inflation rate has experienced obvious fluctuations over the past decade, with peaks and troughs. The highest inflation rate during this period occurred in 2022, reaching 5.18%. Conversely, 2015 saw the lowest inflation rate at -0.85%, highlighting a brief period of deflation. The years 2016, 2019, and 2022 were particularly notable for high inflation rates. Despite these fluctuations, other years, including 2014, 2017, 2018, and 2023, had relatively stable inflation, with modest increases or decreases. In 2023, the inflation rate notably dropped to 1.50%, a significant decrease from the 2022 peak.

In summary, the data illustrates that while Djibouti has faced periods of inflationary pressure, particularly in 2019 and 2022, the country has also seen years of lower inflation, contributing to an overall mixed but progressively stable inflation trend in recent years.

Source:

World Bank

Period:

2014-2023
HTML code to embed chart
Want a bespoke report?
Reach out
Tags
Related Insights

China dominates Nigeria’s imports while Spain leads as top export destination in Q2 2025
  • China remains Nigeria’s largest import partner, accounting for ₦4.96T or 32.45% of total imports—more than double the U.S.'s share.
  • The United States holds second place in imports, contributing ₦2.16T (14.12%), while India, the Netherlands, and the UAE follow with smaller shares below 6%.
  • Spain tops Nigeria’s export market, receiving ₦2.47T worth of goods, representing 10.85% of total exports.
  • Europe features strongly among export partners, with Spain, France, and the Netherlands together absorbing nearly a quarter of Nigeria’s outbound trade.

Togo emerges as Nigeria’s largest African trading partner in Q2 2025
  • Togo leads on both sides of trade, supplying ₦211.99B in imports and receiving ₦811.97B in exports, making it Nigeria’s strongest African partner by value.
  • South Africa ranks second, with imports of ₦115.15B and exports of ₦473.65B, reflecting deep bilateral trade ties.
  • Côte d’Ivoire also features prominently, sending ₦106.15B worth of goods to Nigeria while importing ₦408.97B, showing balanced engagement.
  • West Africa dominates Nigeria’s intra-African trade, with Togo, Côte d’Ivoire, and Ghana collectively accounting for a significant share of regional exports.

Manufactured goods drove imports as oil products pushed total to ₦15.29 trillion in Q2 2025
  • ₦7.88 trillion worth of manufactured goods made up 51.6% of imports, underscoring Nigeria’s dependence on foreign industrial products.
  • Other petroleum oil products accounted for ₦2.79 trillion (18.2%) of imports, showing continued reliance on external energy supplies despite Nigeria’s oil-rich status.
  • ₦1.72 trillion in raw material imports (11.3%) highlights the gap in local processing capacity.
  • Solid minerals (₦70.9 bn, 0.46%) and energy goods (₦150 mn, almost 0%) show almost no role in imports.

Nigeria’s foreign trade hit ₦38 trillion in Q2 2025, driven by strong export growth
  • Total trade in Q2 2025 was valued at ₦38.04tn.
  • Imports accounted for ₦15.29tn, led by manufactured goods and petroleum products.
  • Exports reached ₦22.75tn, boosted mainly by crude oil.
  • The trade gap favoured Nigeria with a surplus of ₦7.46tn.

Morocco leads Africa in digital trade surpluses, with $26 billion 20-year cumulative gain
  • Morocco achieved the highest cumulative surplus in Africa’s digital trade at $26.4 billion between 2005 and 2024.
  • Mauritius and Tunisia followed distantly with surpluses of $8.7 billion and $4.4 billion, respectively.
  • Nigeria and Angola recorded the deepest deficits, each exceeding $90 billion cumulatively.
  • Africa’s overall digital trade balance remained negative, averaging a -$618 million deficit in 2024.
  • Smaller economies like Kenya and Togo managed modest but consistent surpluses over the years.

In 2024, Asia and Europe together accounted for 63% of the world's copper export value
  • Asia leads global copper exports with 31.6% of total export value.
  • Europe follows closely at 31.4%, making the two regions nearly equal in contribution.
  • Combined, Asia and Europe control 63% of the global copper export market.
  • Africa ranks third globally, contributing 15.3% to copper exports.
  • Oceania plays the smallest role, with just 2% of the total export value.

POPULAR TOPICS
SIGN UP TO OUR NEWSLETTER
Get periodic updates about the African startup space, access to our reports, among others.
Subscribe Here
Subscription Form

A product of Techpoint Africa. All rights reserved