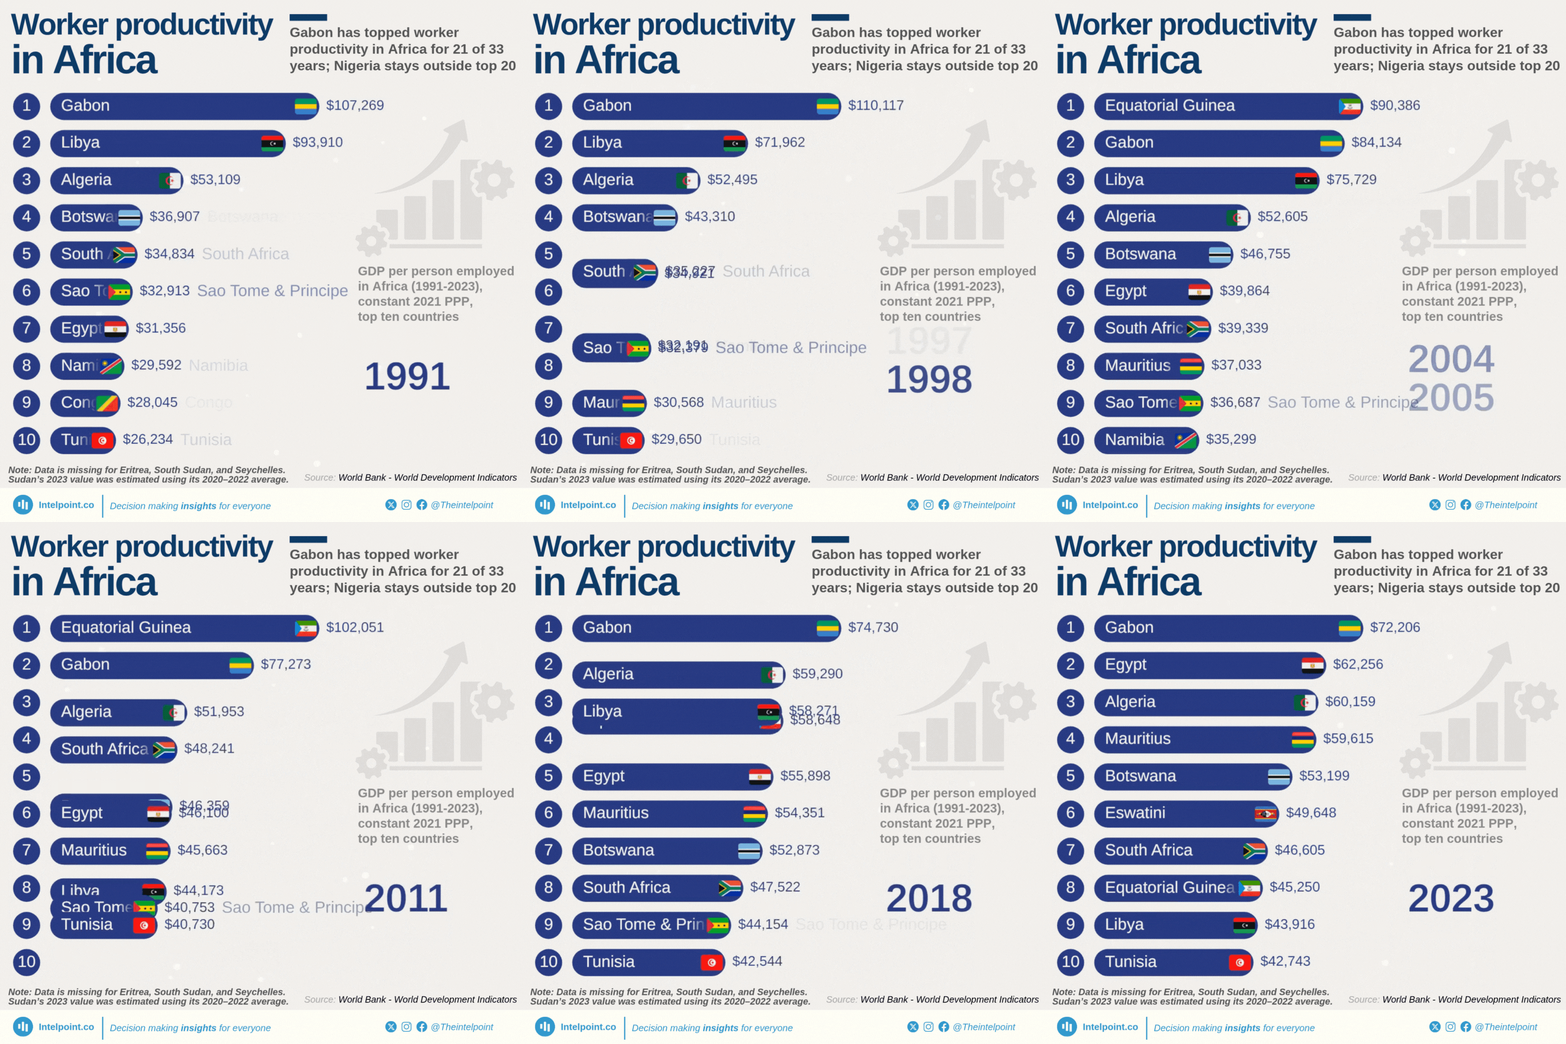
Gabon has topped worker productivity in Africa for 21 of 33 years; Nigeria stays outside top 20

  • Gabon led Africa in GDP per person employed for 21 years, the most of any country, thanks largely to its oil wealth and smaller labour force.
  • Equatorial Guinea was a close second, topping the list for 12 straight years, particularly during its oil boom.
  • Libya never came first but held second place in 18 different years, showing long-term stability in productivity.
  • Algeria and Egypt frequently ranked in the top three but never led.
  • Nigeria, despite being Africa’s most populous country and once its largest economy, never made it into the top 3 and has consistently ranked around 23rd to 26th.
  • The leading countries tend to share a pattern: resource-driven economies with relatively smaller workforces, while lower-ranked ones often struggle.

Over the past three decades, one African country kept coming out on top when it came to how much each worker adds to the economy, and that country was Gabon. Among over 50 nations tracked, Gabon led the continent for 21 different years in GDP per person, driven by its oil sector and a relatively small workforce.

Equatorial Guinea wasn’t far behind, taking the number one spot 12 times, particularly during its early 2000s oil surge. Libya, while never topping the list, claimed second place for 18 years, showing consistent strength before political instability disrupted its trajectory. Algeria and Egypt were also regulars in the top three. But then there’s Nigeria, Africa’s most populous country and now its fourth-largest economy. Despite its size, Nigeria never entered the top ranks for worker productivity. Year after year, it sat outside the top 20, reflecting the challenges of a large informal sector, underemployment, and slow structural reform.

In this data, the message is clear: size alone doesn’t drive productivity. The countries that led weren’t always the biggest, but they were the most efficient at turning work into economic value.
Source:

World Bank - World Development Indicators

Period:

1991-2023
HTML code to embed chart
Want a bespoke report?
Reach out
Tags
Related Insights

Nigerian states with the largest increase in FAAC allocations
  • Nigeria's 36 states received a combined ₦4.14 trillion in FAAC allocations in Jan-May 2026, up ₦735.4 billion (21.6%) from a year earlier.
  • Thirty-five states received higher allocations than a year earlier, while Rivers was the only state to record a decline (₦7.15 billion).
  • Lagos recorded the largest increase in FAAC allocations (₦119.5 billion), more than three times the increase recorded by Oyo (₦38.3 billion).
  • Oyo, Kano, Borno, and Jigawa rounded out the top five states with the largest increases in FAAC allocations.

Ethiopia achieved Africa’s fastest growth in real GDP per person over the 25 years to 2025
  • Ethiopia recorded Africa's fastest real GDP per capita growth between 2000 and 2025.
  • Rwanda ranked second, while Sierra Leone, Tanzania and Djibouti completed the top five.
  • Ethiopia's real GDP per capita rose 322%, from $910 to $3,843.
  • Mauritius recorded Africa's largest absolute gain in real GDP per capita.
  • Nigeria ranked 15th, with real GDP per capita increasing 76.7%.

Holding companies accounted for nearly 68% of Nigeria’s US direct investment balance in 2025
  • Nigeria held Africa’s fourth-largest US direct investment balance in 2025, at $4.56 billion.
  • The balance fell by $1.98 billion from $6.54 billion in 2024, a decline of 30.3%.
  • Nonbank holding companies accounted for $3.08 billion, or 67.7% of Nigeria’s total balance.
  • Manufacturing represented $552 million, or 12.1%, while other industries accounted for $921 million.
  • Holding-company assets may ultimately be deployed in other sectors, so the classification does not show their final use.

US direct investment balance in Africa fell to $37.9 billion in 2025, its lowest since 2008
  • US direct investment in Africa peaked at $69 billion in 2014 after expanding rapidly from the mid-2000s.
  • By 2025, the balance had fallen 45.1% from its peak to $37.9 billion, its lowest since 2008.
  • Mining drove the cycle, accounting for 88% of the 2010–2014 increase and 97% of the subsequent decline.
  • Africa’s share of the global US direct investment balance remained below 3% throughout 1985–2025.
  • The post-2014 decline was interrupted by brief recoveries in 2017 and 2021–2022.

The top ten countries held 98% of Africa’s US direct investment balance in 2025
  • Mauritius held Africa’s largest US direct investment balance in 2025, at $8.4 billion.
  • South Africa followed with $7.9 billion, ahead of Egypt’s $6.7 billion and Nigeria’s $4.6 billion.
  • Africa’s total balance fell by 8.4% to $37.91 billion, its third consecutive annual decline.
  • The top ten countries held 98% of Africa’s total, leaving only $0.7 billion across the rest.
  • Manufacturing led South Africa’s balance, mining dominated Egypt’s, and holding companies accounted for most of Nigeria’s.

South Africa and Egypt accounted for a third of Africa’s estimated $1.93tn government debt in 2025
  • Government debt across 51 African countries was estimated at $1.93 trillion in 2025.
  • South Africa and Egypt had the largest estimated stocks and jointly accounted for 33.8% of the total.
  • Sudan had the highest debt-to-GDP ratio at 187.6%, followed by Senegal at 130.2%.
  • The estimates use IMF debt ratios and current-dollar GDP, not national authorities’ reported debt stocks.
  • Differences in government coverage, instruments and valuation mean the figures are comparable estimates, not fully harmonised official data.

POPULAR TOPICS
SIGN UP TO OUR NEWSLETTER
Get periodic updates about the African startup space, access to our reports, among others.
Subscribe Here
Subscription Form

A product of Techpoint Africa. All rights reserved