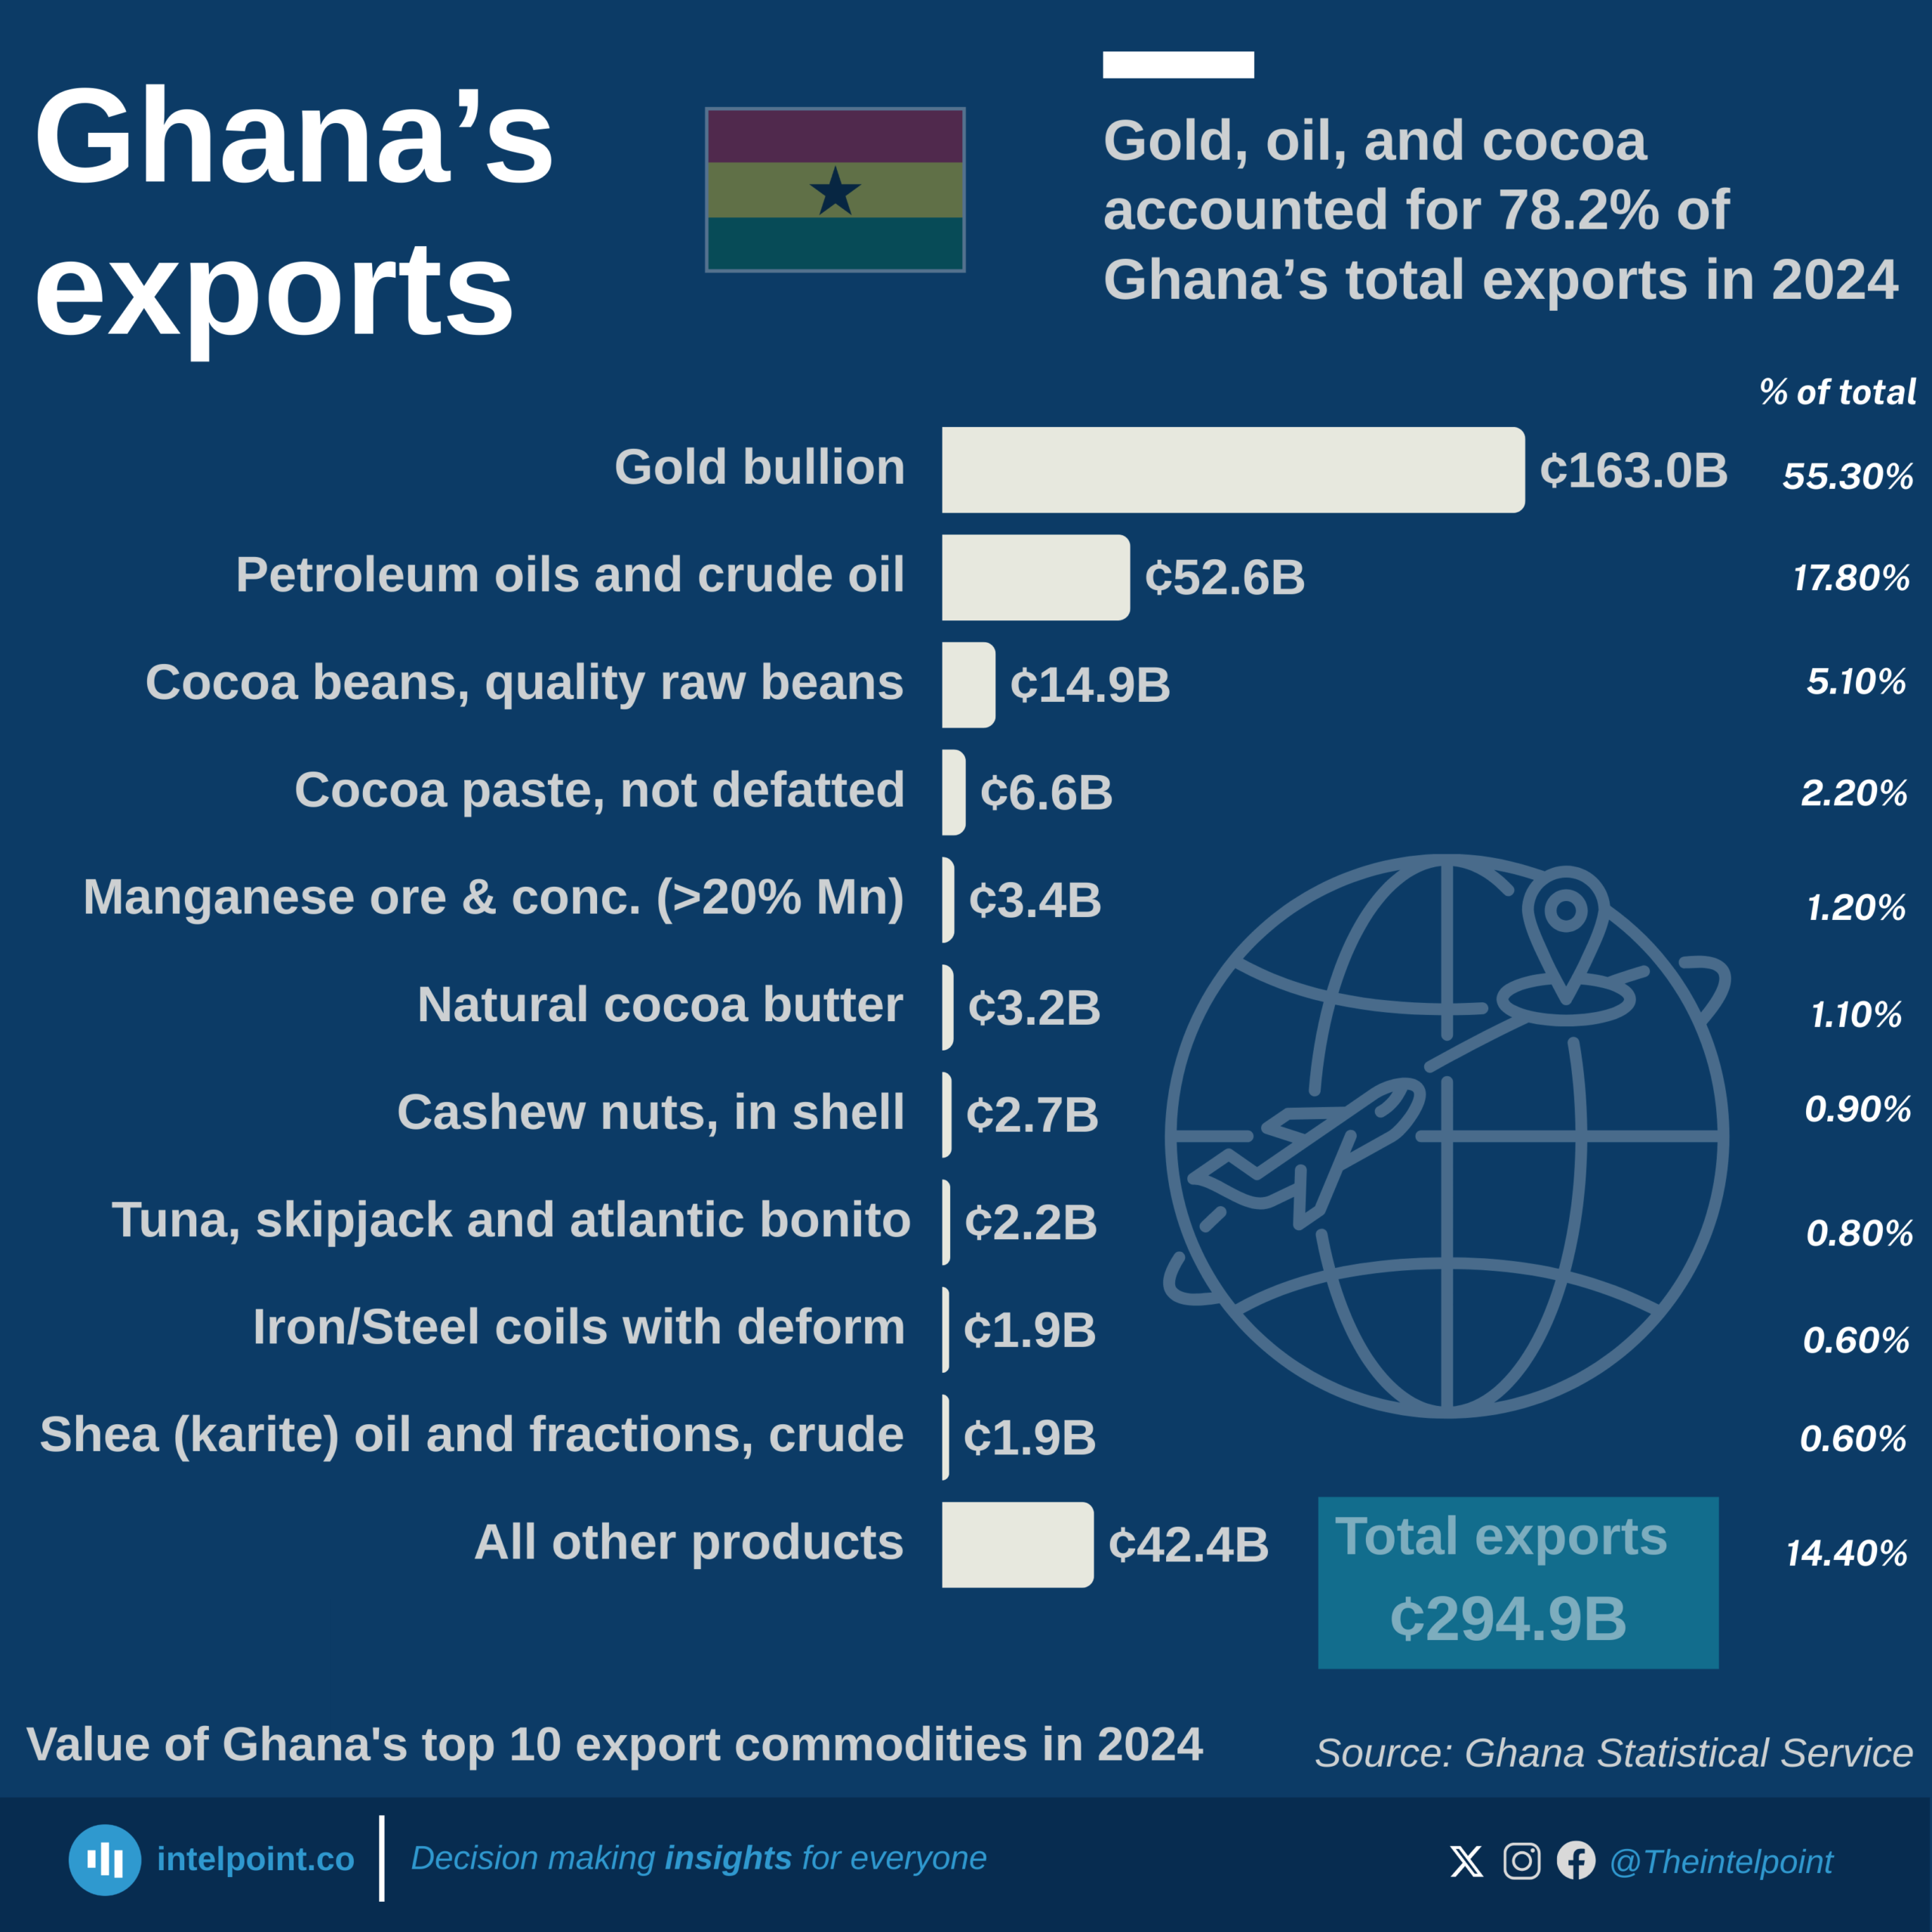
Bite-sized Insights about
 
Providing you with data-based insights about things happening around you.
Out of 30 African countries ranked, South Africa topped logistics performance in 2023 with a score of 3.7 out of 5
  • South Africa ranked highest in Africa; it’s easy to move goods in and out.
  • It beat others on customs speed, delivery time, and tracking.
  • Nigeria, Ghana, and DR Congo scored low. Goods faced more delays and hassles.
  • Countries with high scores attract more trade and business.
  • A low score means slower shipments, higher costs, and weaker logistics.

Netherlands, US, and Germany dominated cocoa imports from 1961 to 2023
  • Netherlands imported the most cocoa beans — 25.48 million tonnes (1961–2023)
  • US (21.1M) and Germany (16.8M) followed in total volume
  • These three countries dominated the top 5 nearly every year
  • Malaysia, UK, France, and Belgium also ranked high over time
  • USSR stayed in the top 10 despite dissolving in 1991
  • Global cocoa imports grew from 1M tonnes in 1961 to nearly 4M in 2023

Half of the top 12 global Google shopping searches in 2024 were for phone brands
  • iPhone was the most searched shopping query globally in 2024.
  • Half of the top 12 search queries were phone-related, showing phones dominated online shopping interest.
  • iPhone (100) and Samsung (88) were highly searched, signalling active consumer comparison between phone models.
  • Nike (84) and Adidas (46) maintained strong brand appeal in fashion and retail.
  • Amazon (52) ranked high despite being a platform, not a specific product.
  • Apple (30) appeared lower in rank than specific Apple products, suggesting searchers prioritised items over brand pages.
  • Laptops (21) remained a significant product category globally, despite mobile dominance.

China's exports to Nigeria more than doubled between the 2016 drop and the 2022 peak, growing by 130%
Key Takeaways:    
  • China’s exports to Nigeria increased from less than $100 million in 1992 to $20.2 billion in 2023, an overall growth of 22,074%.
  • The highest export value was recorded in 2022 at $22.3 billion.
  • China's exports to Nigeria dropped sharply in 2016 to $9.7 billion from $15.39 billion in 2014.
  • After a sharp 29% decline between 2015 and 2016, exports entered a period of sustained growth beginning in 2017.
  • The 2020–2022 period saw remarkable growth, with exports rising by 33% despite global pandemic challenges.
  • In 2023, exports declined by 9.5%, yet remained significantly above pre-pandemic levels.

China's imports from Nigeria were highest at $3.03 billion in 2021, with mineral fuels, oils, and distillation products accounting for the majority of the import value
Key Takeaways:
  • From 2014 to 2023, China’s imports from Nigeria fluctuated significantly, ranging between $907 million and over $3 billion.
  • A sharp 53% drop was recorded between 2014 and 2015, followed by a further decline to a decade-low in 2016.
  • China reached its highest import value in 2021, when it imported over $3 billion from Nigeria.
  • Imports fell by 47% in 2022 but recovered by 48% in 2023, reaching $2.37 billion.
  • The volatility in trade reflects the influence of global commodity prices, especially oil, and evolving bilateral trade dynamics.
  • Mineral fuels, oils, and distillation products accounted for more than 50% of China's imports from Nigeria during the period of study.

Top 10 goods made up 63% of China’s exports to Nigeria in 2023
Key Takeaways:
  • Electrical and electronic equipment was China’s top export to Nigeria, valued at $2.88 billion.
  • The top five export categories (electrical equipment, machinery, vehicles, plastics, and iron/steel products) together accounted for over $8.78 billion, representing around 44% of total exports.
  • Industrial goods such as machinery and steel, along with manufactured consumer goods, dominate China’s export portfolio.
  • Products like apparel, synthetic materials, and household items featured strongly among the top export categories.
  • In total, China exported goods worth $20.18 billion to Nigeria in 2023.

Mineral fuels dominate China’s imports from Nigeria, accounting for nearly 60% of the total trade value
Key Takeaways:
  • In 2023, China imported $1.41 billion worth of mineral fuels and oils from Nigeria, making it the leading import category.
  • The top three import categories (mineral fuels, ores, and salt/earth materials) together made up nearly 89% of the total import value.
  • Nigeria’s exports to China are largely raw materials and natural resources, with minimal contribution from manufactured goods.
  • The top ten product categories accounted for almost 99% of China’s total imports from Nigeria.
  • Agricultural and animal products such as oil seeds, raw hides, and spices also formed part of Nigeria’s export portfolio.
  • China’s total imports from Nigeria were valued at $2.37 billion in 2023.

China recorded a $17.8 billion trade surplus with Nigeria in 2023, as exports outpaced imports by a ratio of 8.5 to 1
Key Takeaways:
  • In 2023, China’s exports to Nigeria totaled $20.18 billion, while imports from Nigeria reached only $2.37 billion.
  • China’s trade surplus with Nigeria amounted to approximately $17.8 billion.
  • Chinese exports accounted for 89.5% of the total bilateral trade, with Nigerian exports making up just 10.5%.
  • The trade imbalance underscores Nigeria’s strong dependence on Chinese goods and industrial inputs.
  • For every $1 Nigeria exports to China, it imports $8.50 worth of Chinese products.

After the 2020 crash, US-Nigeria trade value climbed to $10B+ in 2024
Key Takeaways: 
  • The US' trade deficit with Nigeria narrowed significantly, shifting from a $5.14 billion deficit in 2017 to a $1.69 billion surplus in 2024.
  • US goods exports to Nigeria reached $4.2 billion in 2024, representing a 92% increase from the $2.2 billion recorded in 2017.
  • US goods imports from Nigeria totalled $5.9 billion in 2024, a 20% decrease from the $7.3 billion recorded in 2017.
  • The COVID-19 pandemic severely disrupted bilateral trade in 2020, but both imports and exports began recovering steadily from 2021 onwards.
  • By 2024, trade had rebounded substantially, with US imports from Nigeria reaching $5.87 billion and exports to Nigeria reaching $4.17 billion.
  • Despite experiencing persistent trade deficits from 2017 through most of the period, the US achieved trade surpluses with Nigeria in 2020 and 2021.
  • Total goods trade between the US and Nigeria ranged from $4 billion to approximately $10 billion.

Soybeans led the US' agricultural exports with $24.58 billion in 2024, accounting for 14% of the total export value
Key Takeaways:
  • Soybeans topped the US' agricultural exports in 2024, followed by corn and beef.
  • The top 10 agricultural commodities made up 56.6% of the total value of the US' agricultural exports.
  • Plant-based exports (soybeans, corn, tree nuts, soybean meal, wheat) contributed over 34% of the total agricultural export value.
  • The combined value of the top 10 exports exceeded $99.73 billion.
  • Animal proteins (beef, pork, and poultry) together represented 13.9% of total US agricultural exports.

1 4 5 6 7 8 12

Can’t find what you’re looking for? Please fill the form below
Contact Form Demo
SIGN UP TO OUR NEWSLETTER
Get periodic updates about the African startup space, access to our reports, among others.
Subscribe Here
Subscription Form

A product of Techpoint Africa. All rights reserved