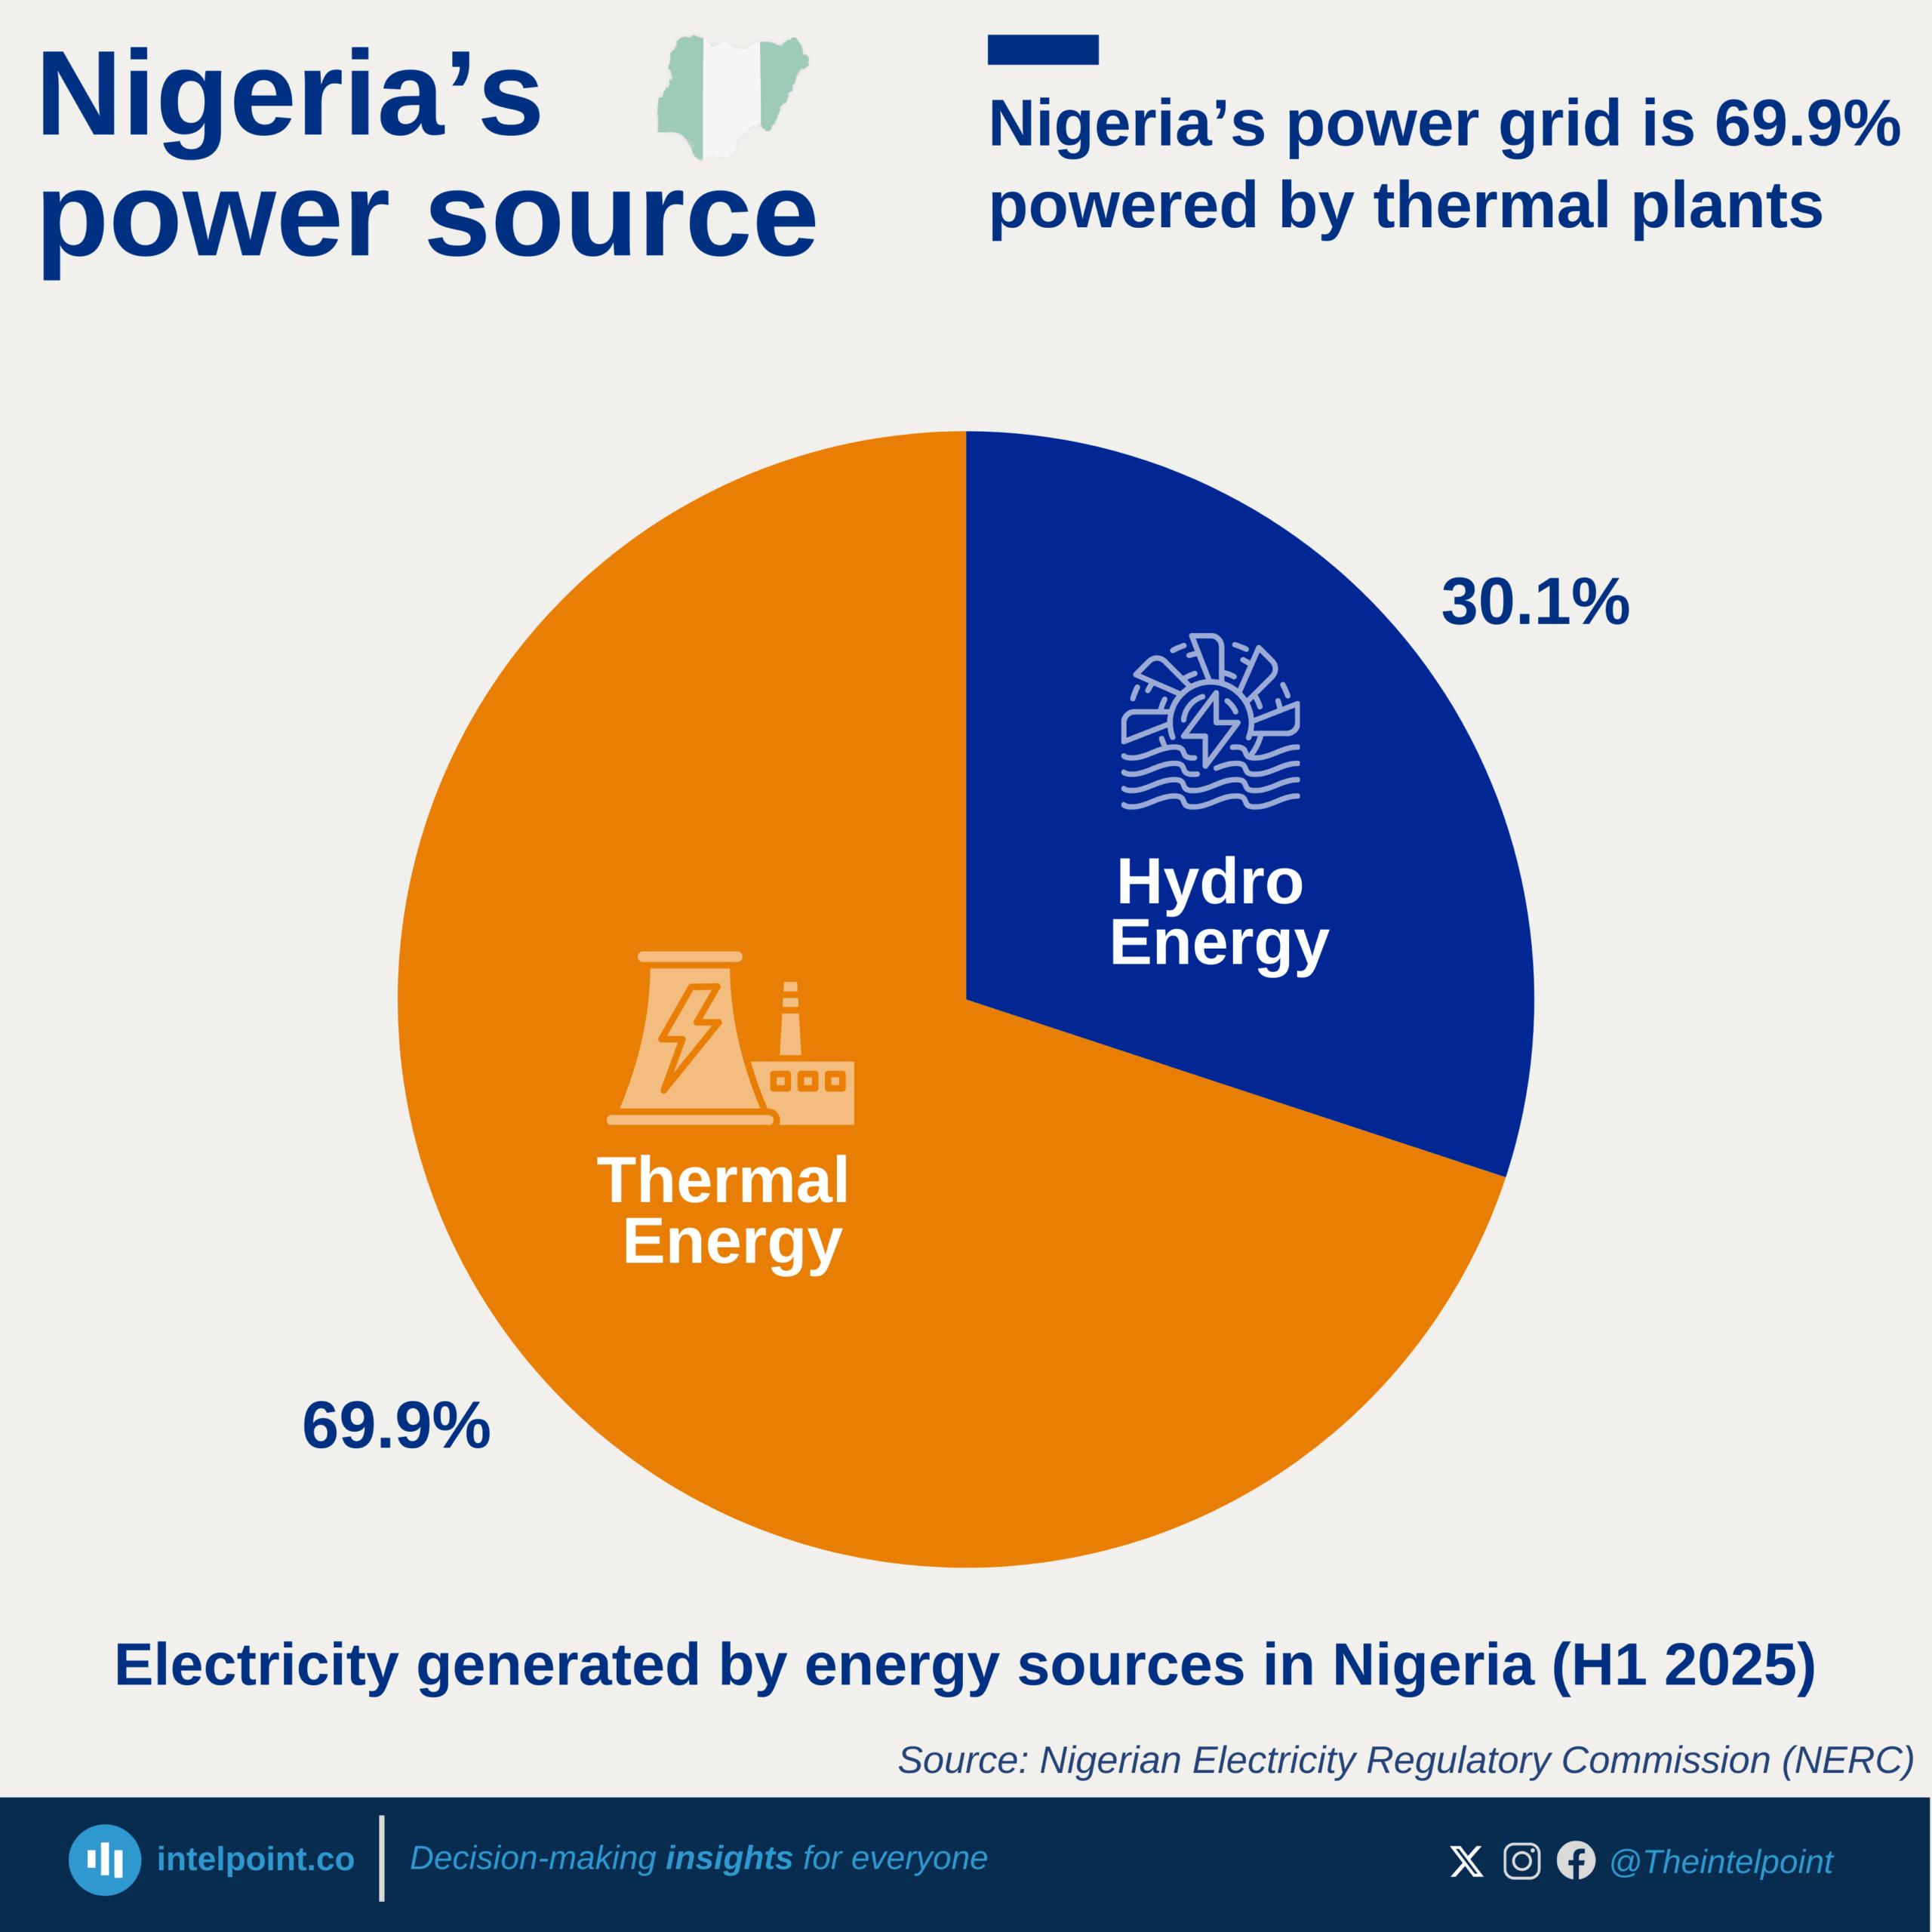
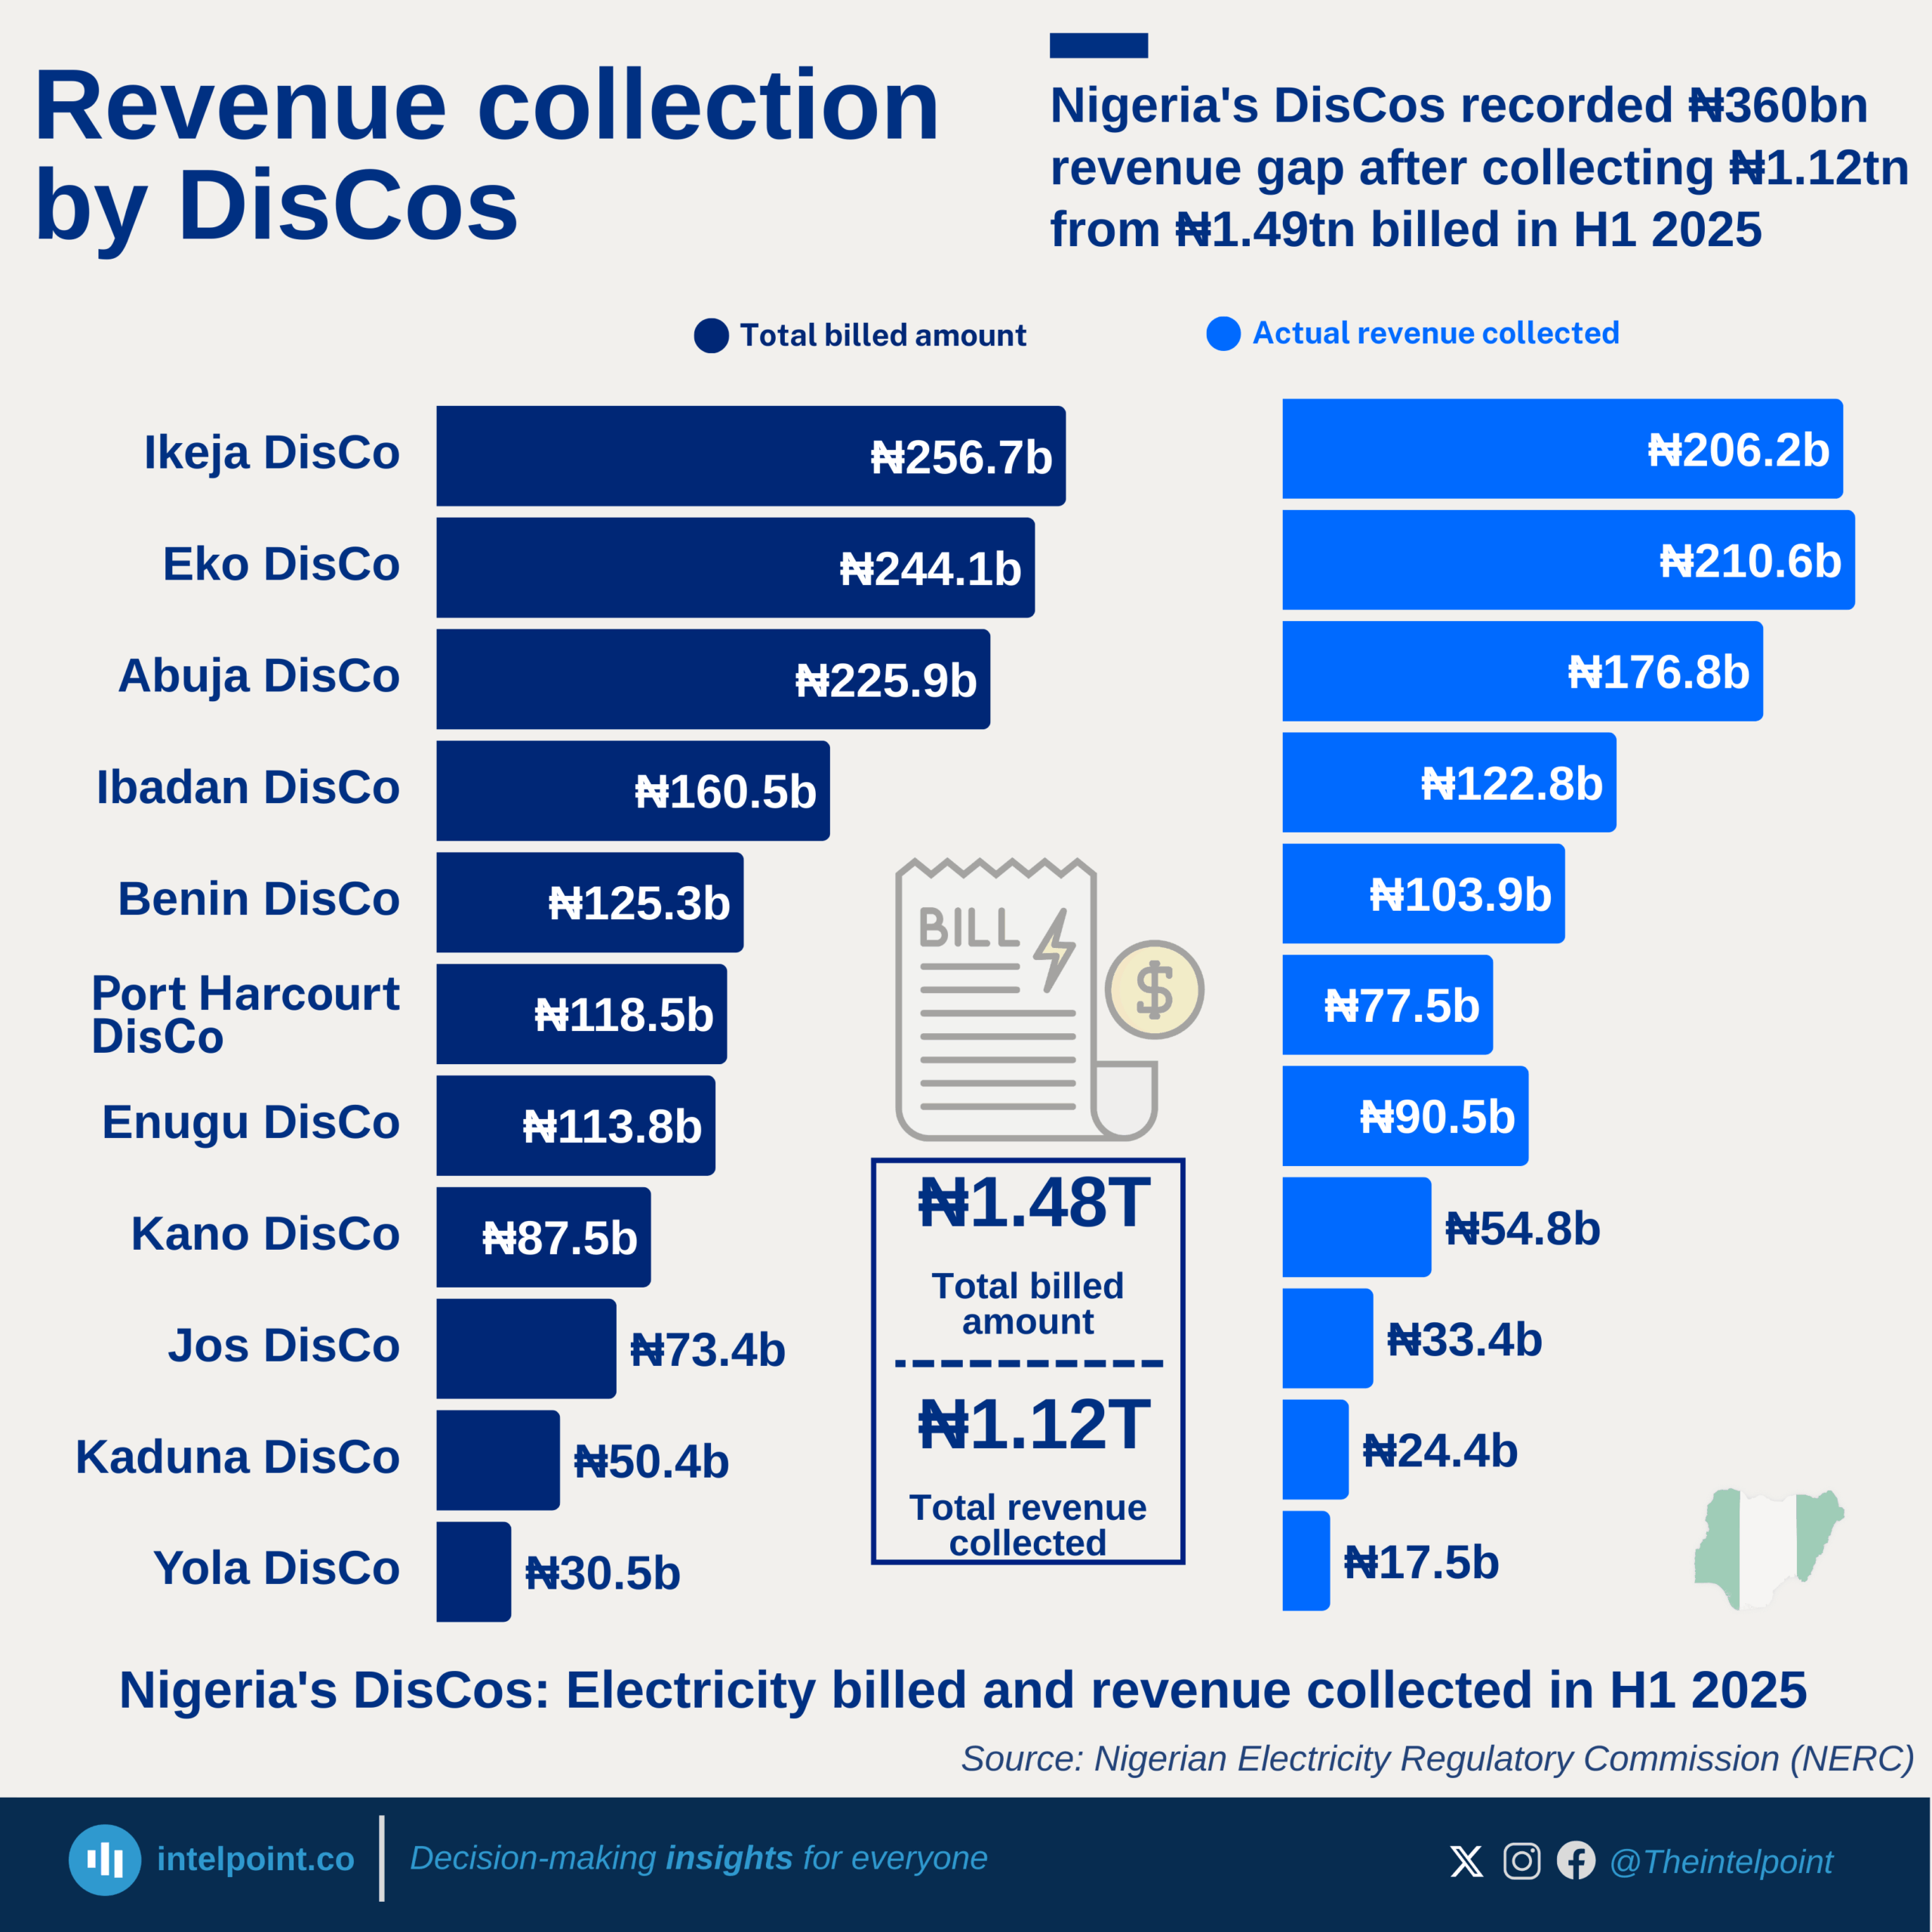
DisCos billed approximately ₦1.49 trillion but collected only ₦1.12 trillion in H1 2025.
Ikeja and Eko DisCos generated the highest revenues, collecting ₦206.22 billion and ₦210.59 billion, respectively.
Revenue collection gaps remain significant, with Jos, Kaduna, and Yola posting the weakest collection performances.
The wide gap between billings and actual collections suggests persistent challenges in customer payment compliance, metering, and distribution efficiency.
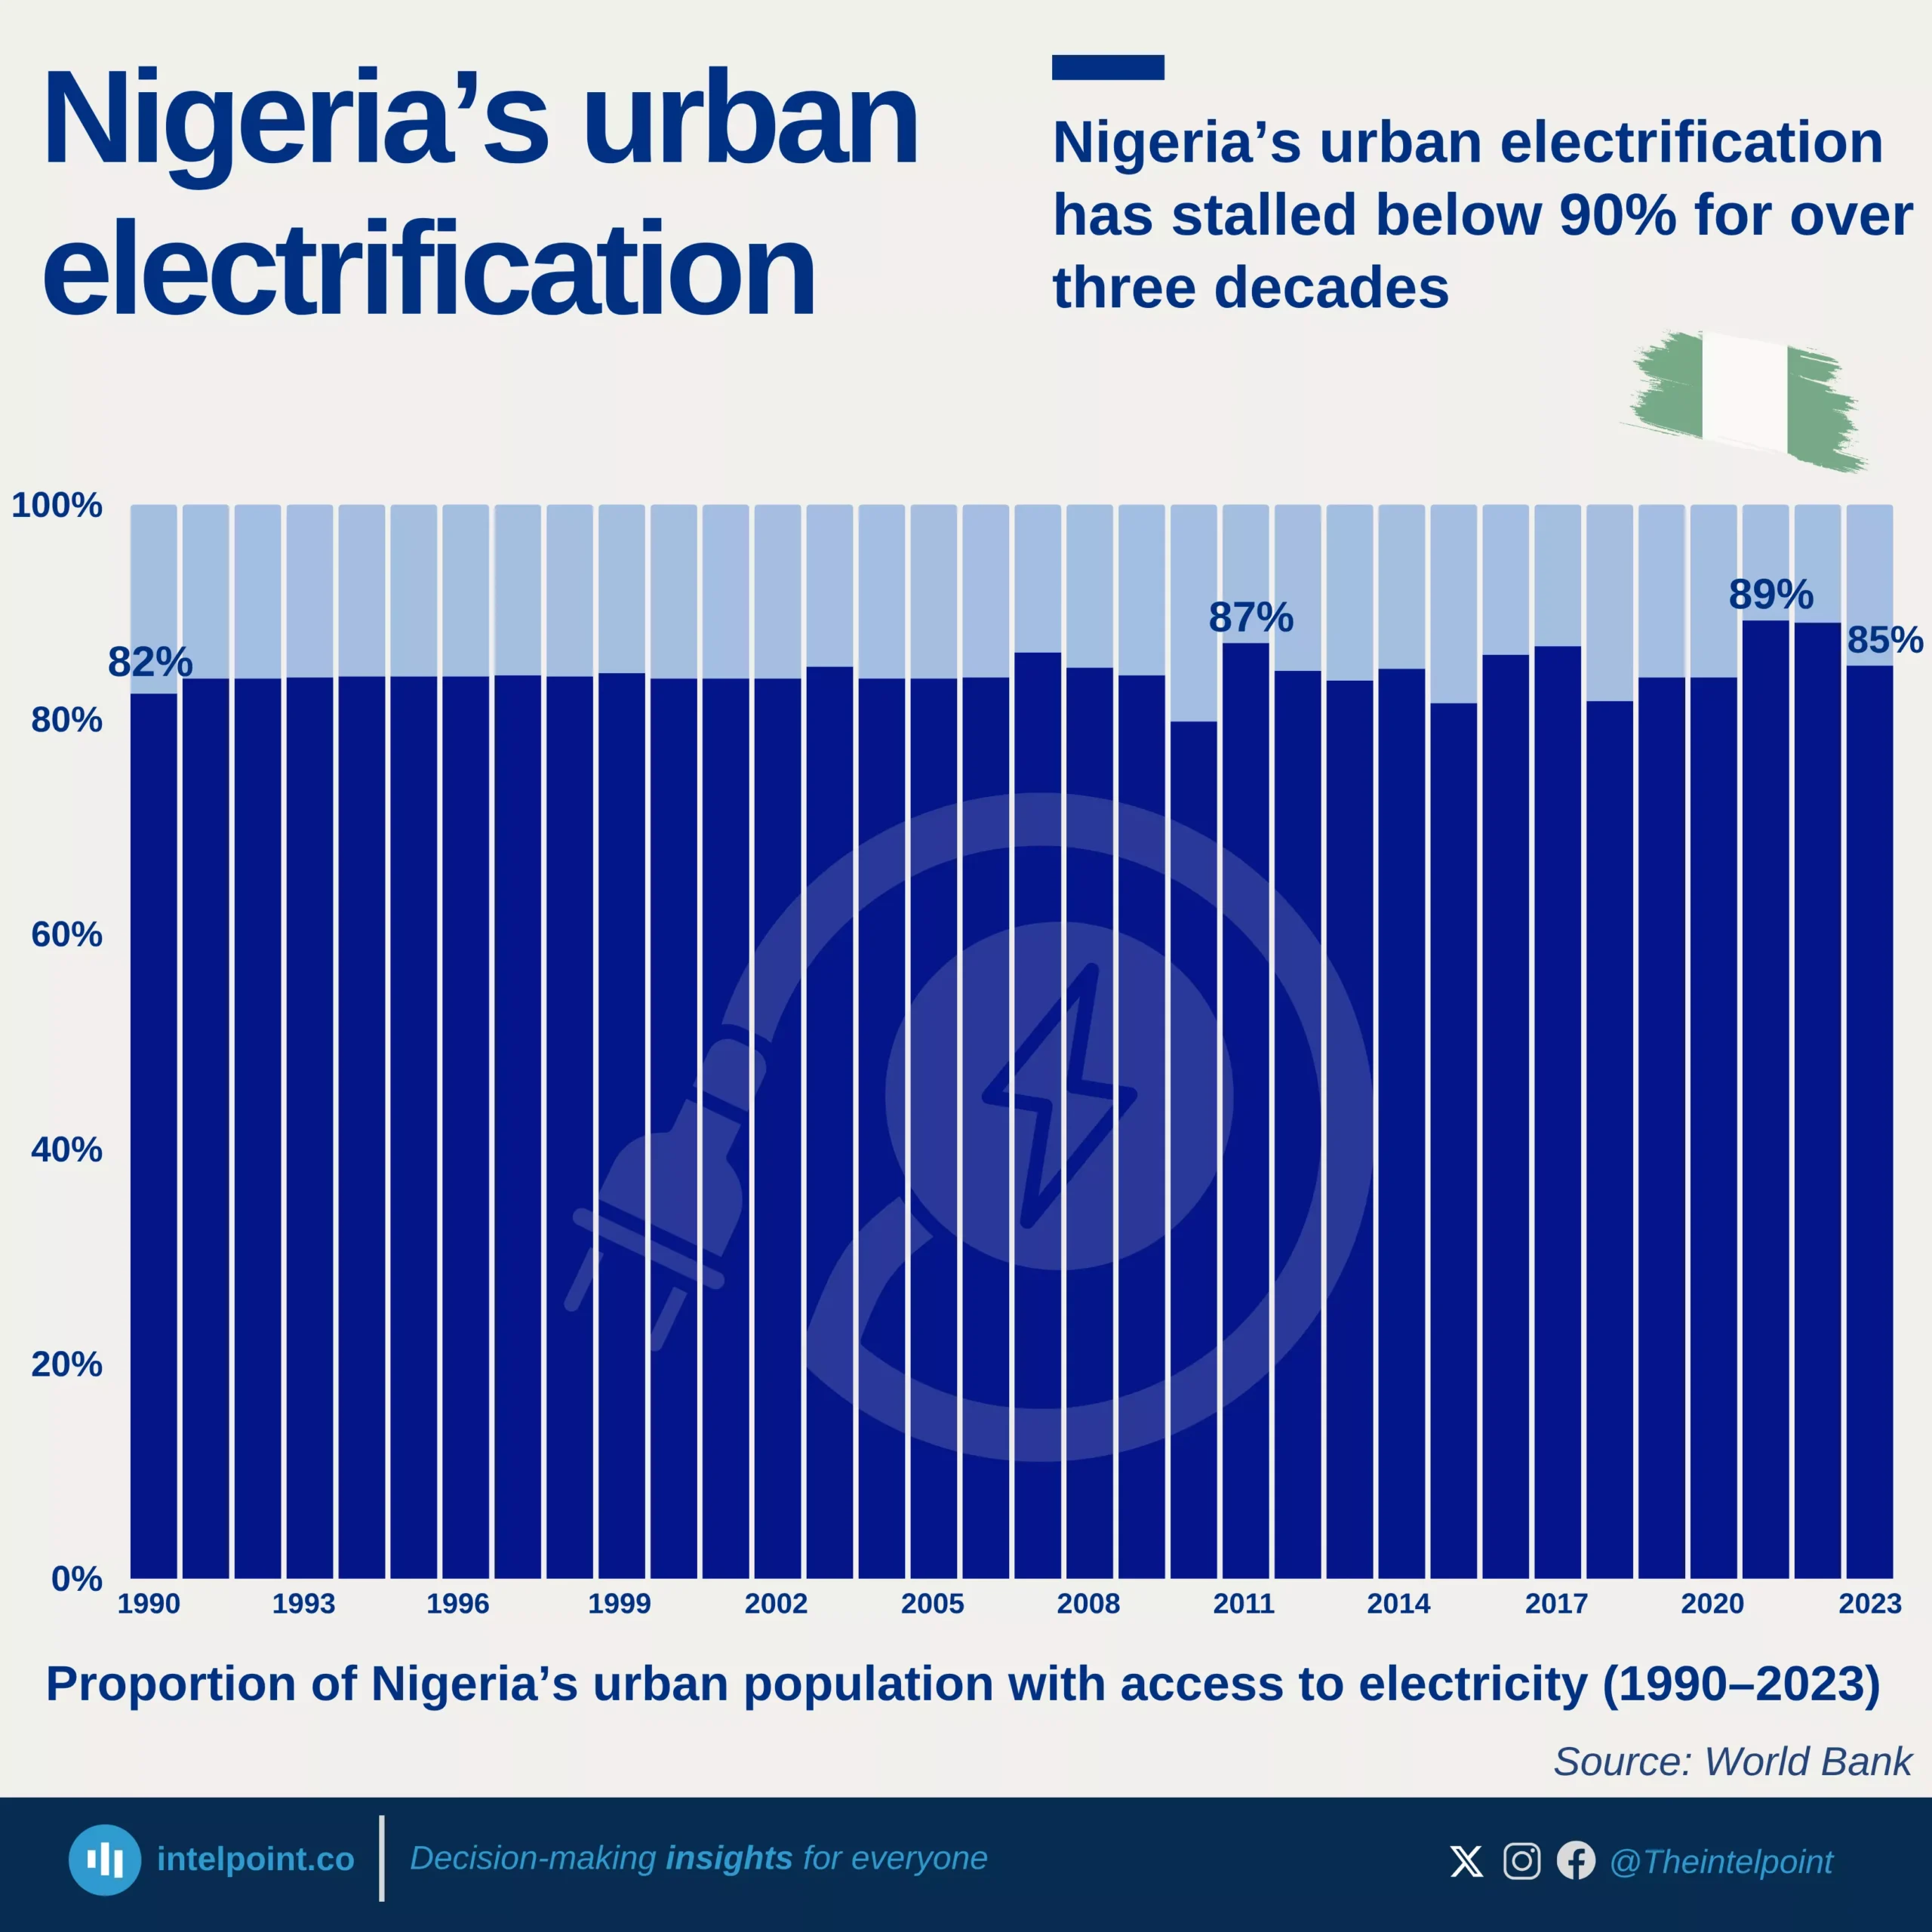
Urban electricity access has remained between 80% and 89% since 1990, never crossing to 90%.
The inability to achieve universal access suggests that infrastructure expansion has struggled to keep pace with rapid urbanisation and population growth.
Periodic dips in access, such as in 2010 and 2015, point to challenges in maintaining consistent electricity supply rather than just extending connections.
Insufficient generation, outdated grids, and policy inefficiencies have constrained Nigeria’s ability to deliver reliable and universal electricity access even in its urban centres.
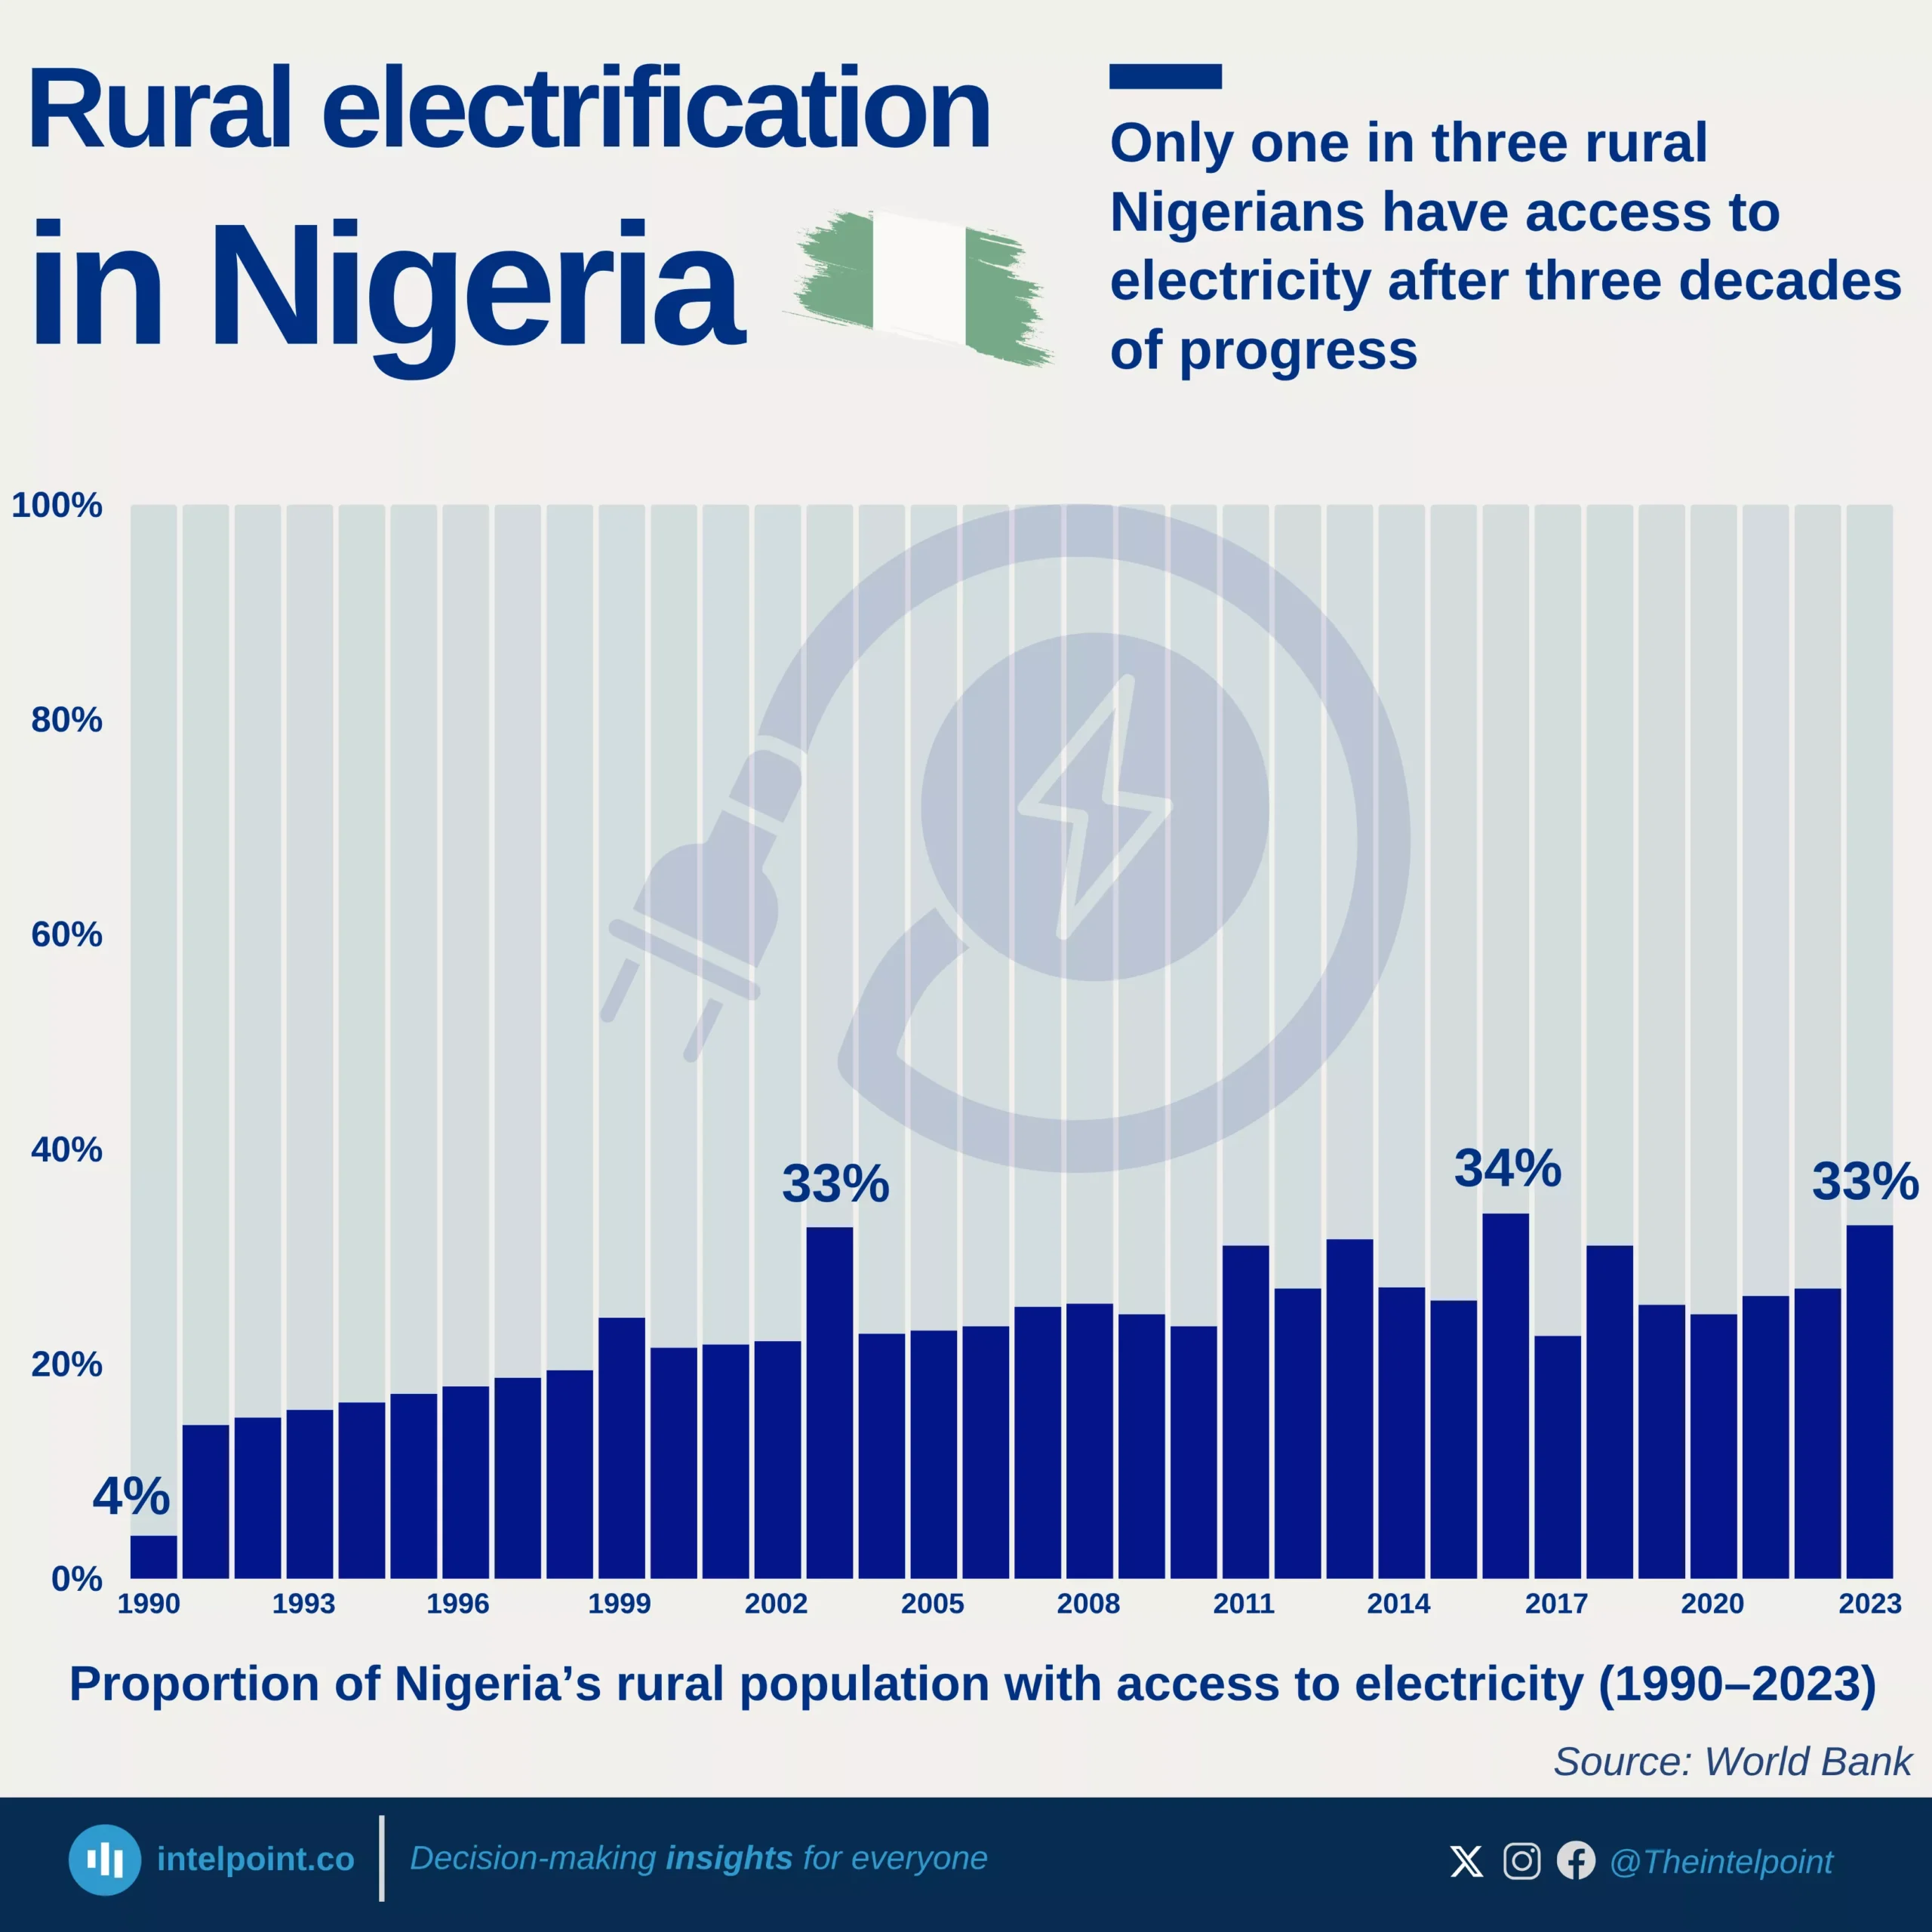
Rural electricity access increased from just 4% in 1990 to about 33% in 2023, showing gradual progress over three decades.
The data reveals irregular jumps in certain years—such as 2003, 2011, and 2016—likely tied to temporary electrification programmes or revised data estimates. D
espite improvements, nearly two-thirds of rural Nigerians still lack electricity, underscoring a wide disparity in energy access across regions.
The slow rate of expansion highlights ongoing issues with investment, grid extension, and maintenance that continue to limit rural electrification efforts.