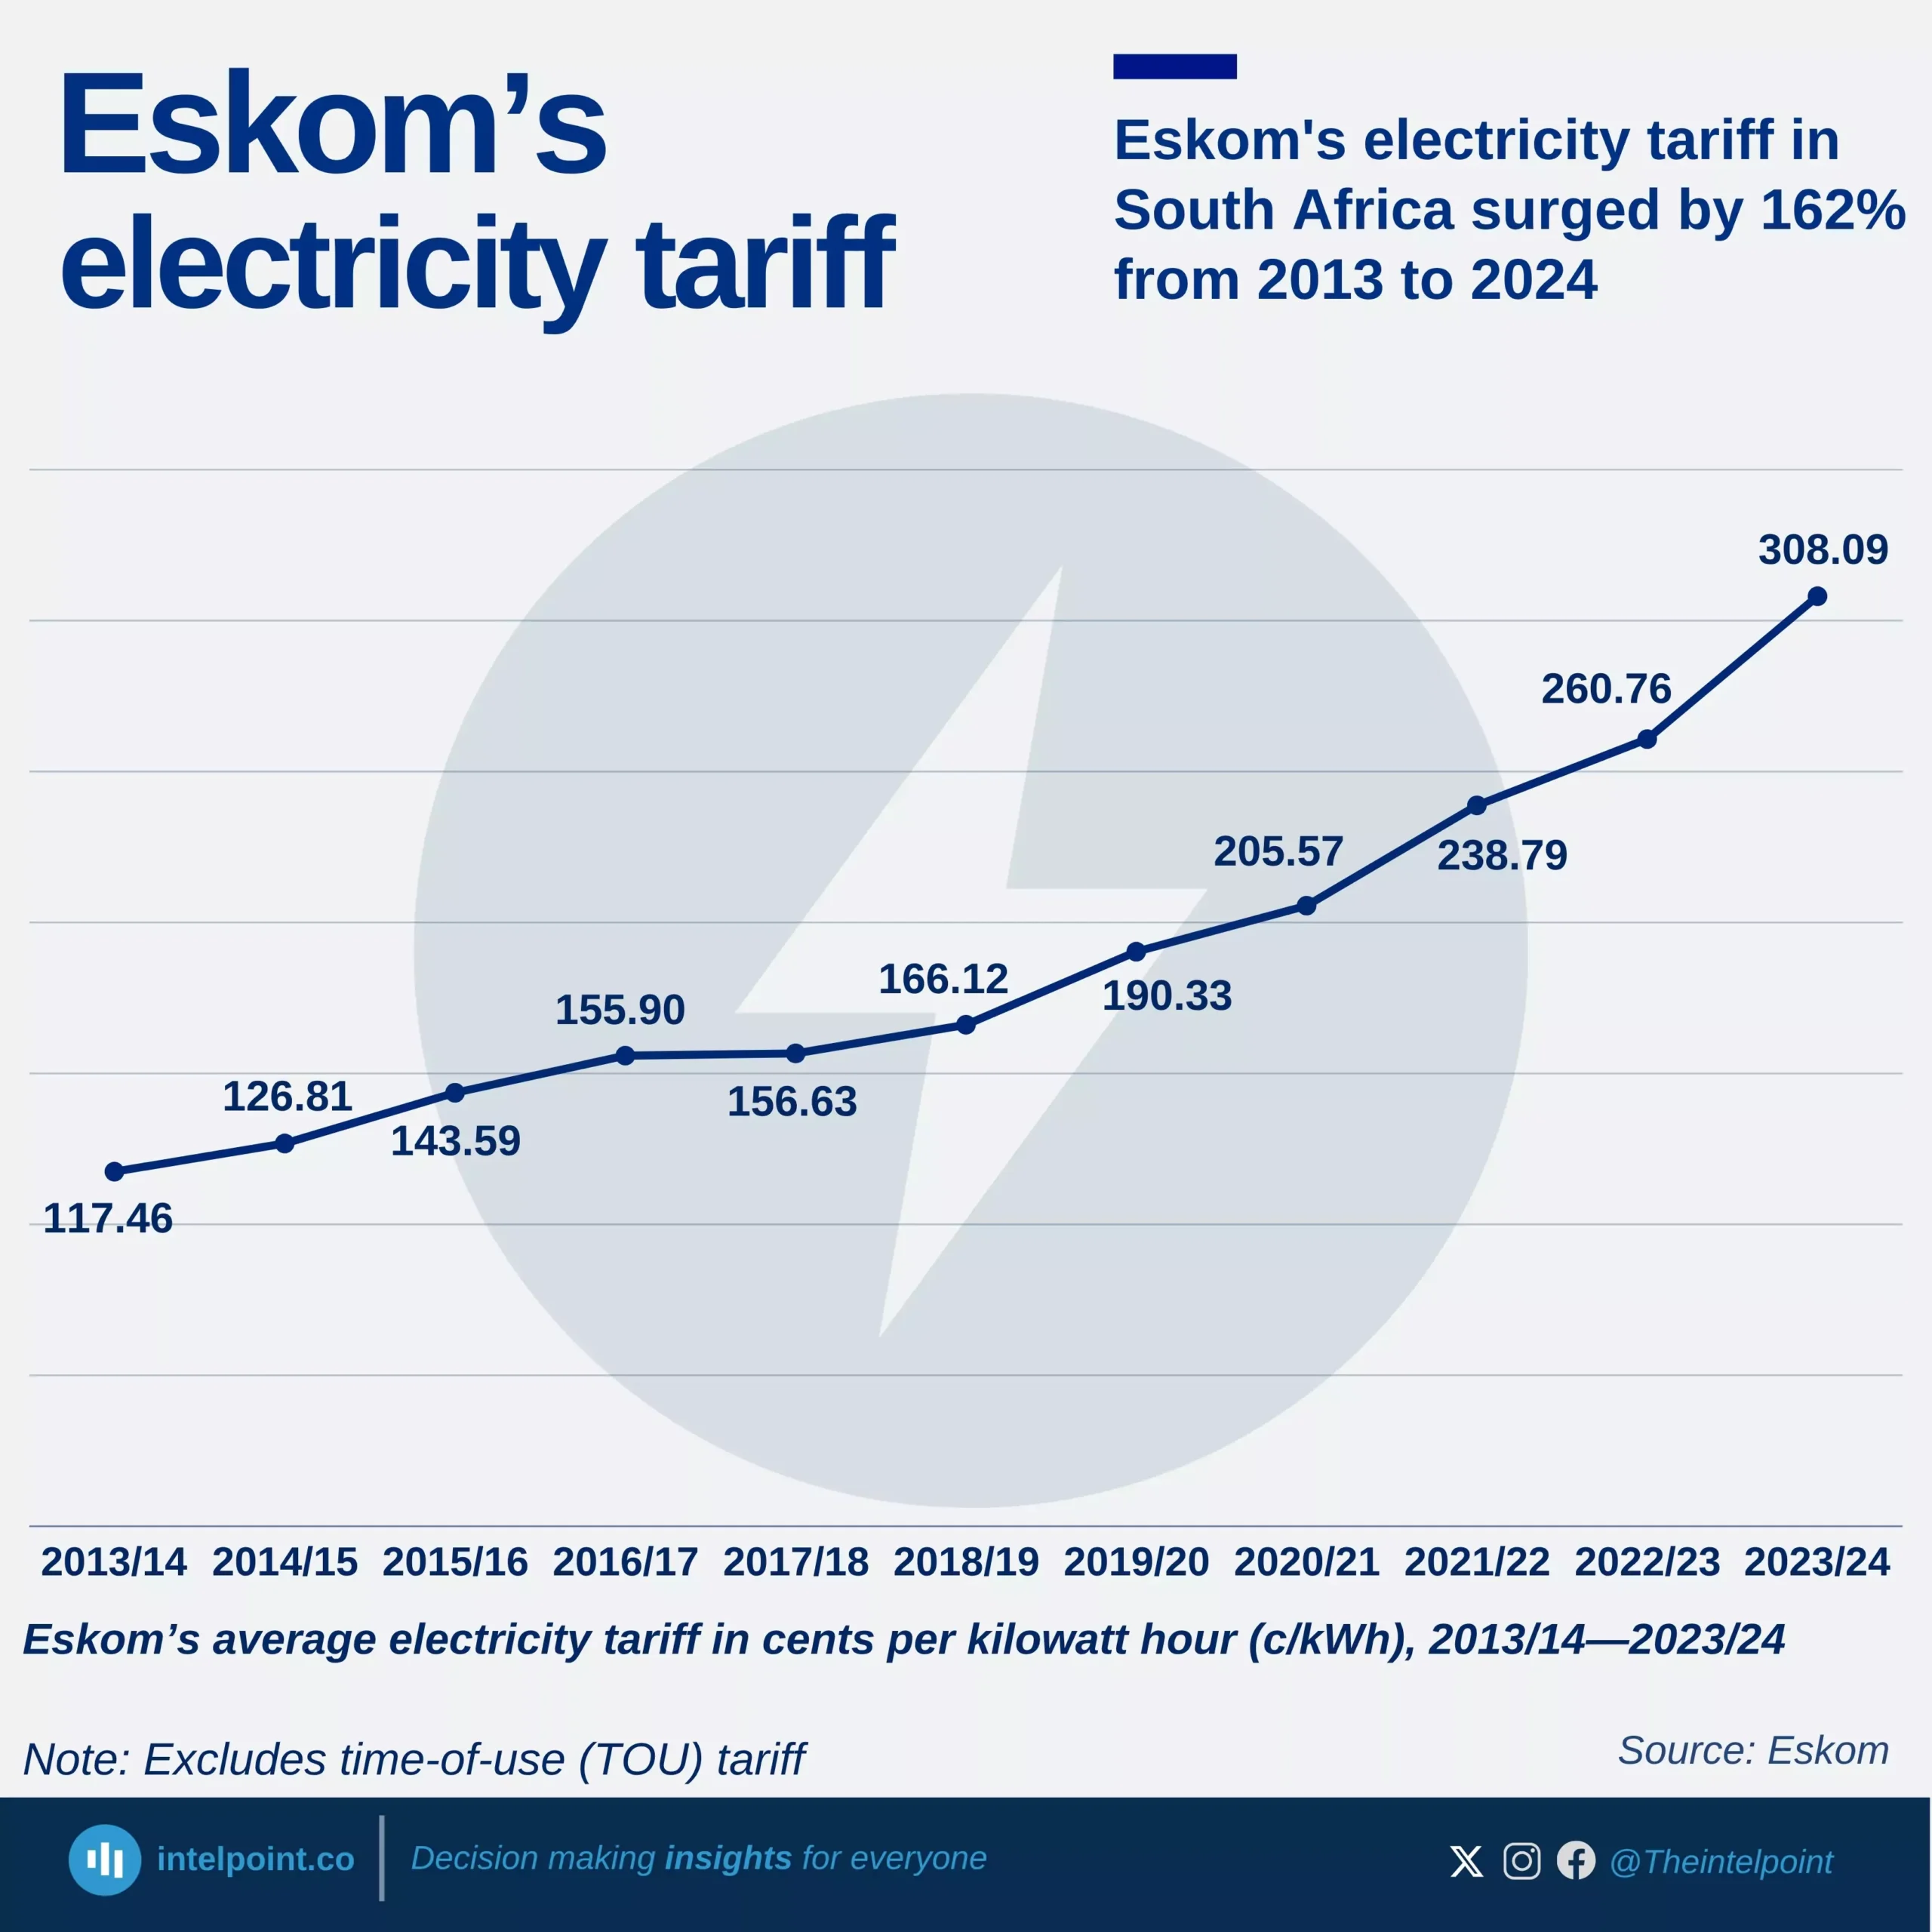
Eskom’s average electricity tariff in cents per kilowatt hour (c/kWh), 2013/14—2023/24

Key Takeaways

  • Eskom’s average electricity tariff increased by approximately 162% between 2013/14 and 2023/24.
  • Tariffs are categorized into two groups based on distribution: Local Authority Tariffs and Non-Local Authority Tariffs.
  • Landlight Tariff (Non-Local Authority category) is the highest rate and in 2023/24 it stood at 608.61 c/kWh.
  • Homelight 20A (Block 1) is the lowest tariff also in the non-local authority category, at 168.78 c/kWh in 2023/24.
  • Eskom applies Time-of-Use (ToU) pricing, where tariffs vary by Time of day (peak, standard, off-peak periods) and Demand season (high-demand season: June to August and Low-demand season: September to May)

Between the 2013/14 and 2023/24, South Africans have witnessed a staggering 162% increase in electricity tariffs charged by Eskom, the country’s state-owned power utility. Despite this significant surge over the past decade, further increases are on the horizon, placing additional strain on households, businesses, and municipalities already grappling with rising energy costs.

In its latest publication, Eskom announced another round of tariff adjustments approved by the National Energy Regulator of South Africa (NERSA). Starting April 1, 2025, direct customers, those not supplied through municipalities (non-local authority), will face an effective tariff increase of 12.74%. For municipalities purchasing electricity in bulk, the adjustment will take effect on July 1, 2025, with a tariff hike of 11.32%.

These increases are part of a broader cost-recovery framework that Eskom has consistently defended. The utility argues that the continuous tariff hikes are necessary to address its significant financial challenges, which include a mounting debt burden, rising operational costs, infrastructure maintenance and expansion needs, as well as fuel expenses. Additionally, Eskom aims to recoup revenue losses from years of under-recovery, where tariffs were not sufficient to cover the true cost of electricity production and distribution.
Source:

Eskom

Period:

HTML code to embed chart
Want a bespoke report?
Reach out
Tags
Related Insights

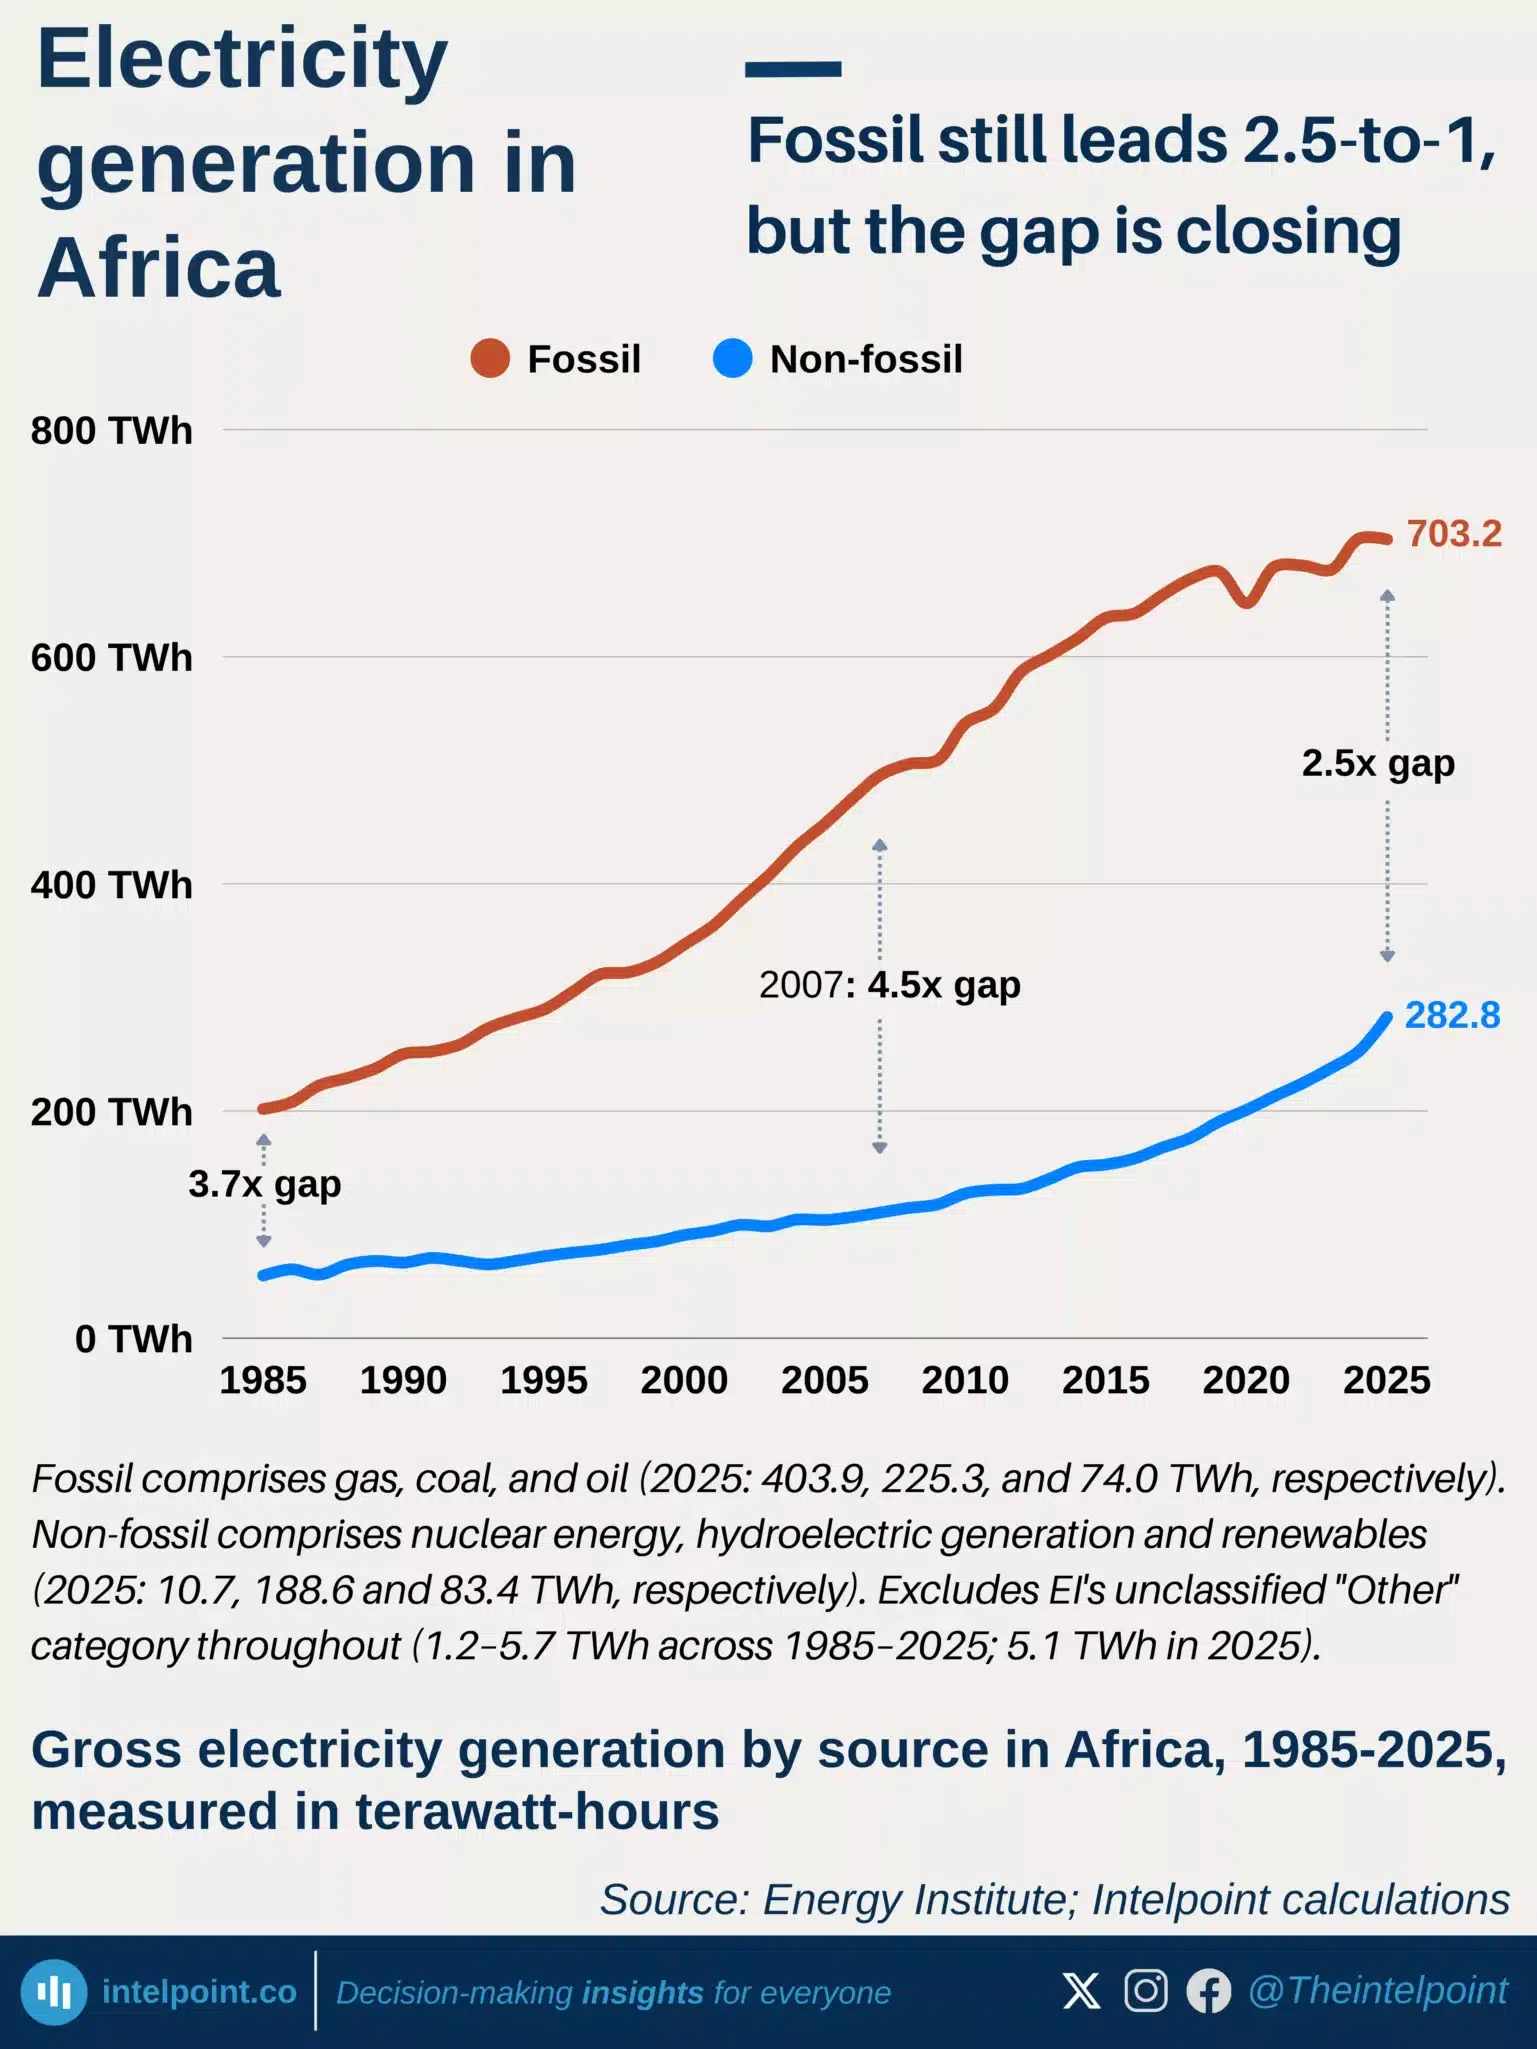
Electricity generation in Africa: fossil still leads 2.5-to-1, but the gap is closing
  • Fossil fuels still generate 2.5x more electricity than non-fossil sources, though the gap has narrowed from a 2007 peak of 4.5x.
  • South Africa and Egypt together account for all of Africa's nuclear power and 59% of its non-hydro renewables.
  • Hydropower, the largest non-fossil source at 188.6 TWh, tells a different geographic story, with 91% generated outside South Africa and Egypt, mainly in Eastern, Middle, and Western Africa.
  • Gas still leads at 403.9 TWh, but its growth slowed to 0.8% in 2025 versus 11.9% growth for non-fossil sources.

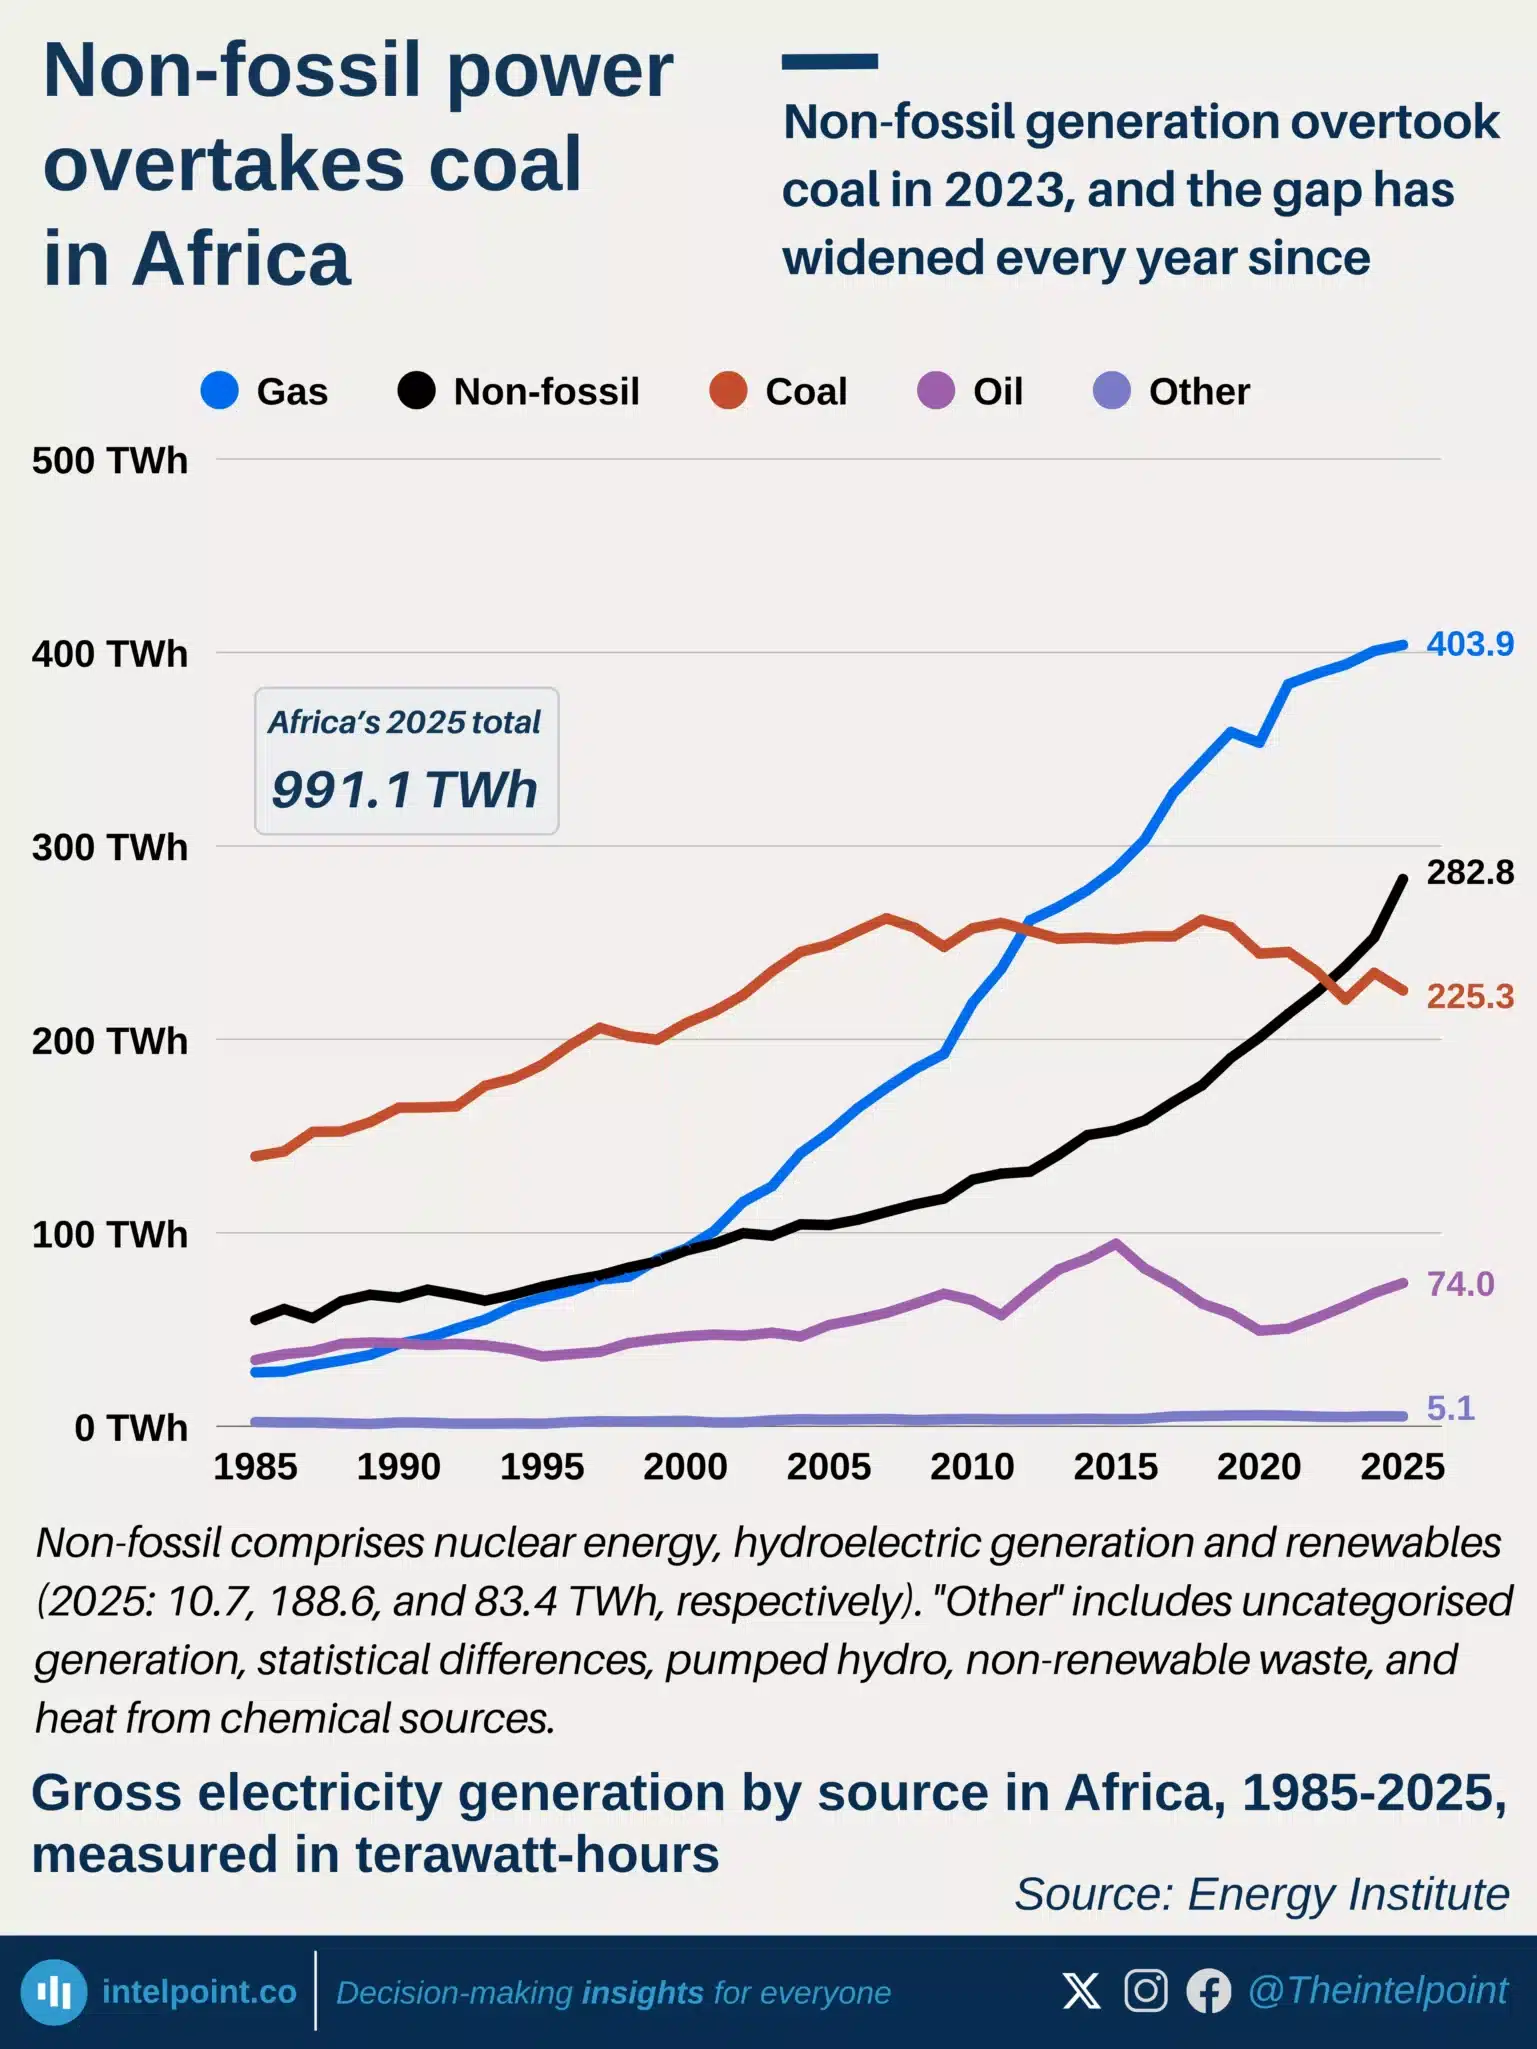
Non-fossil generation overtook coal in 2023, and the gap has widened every year since
  • Non-fossil generation overtook coal in 2023, with the gap reaching 57.5 TWh in 2025.
  • Coal generation fell to 225.3 TWh, below its 262.6 TWh peak in 2007.
  • Hydropower dominates non-fossil generation, producing 188.6 TWh in 2025.
  • Fossil fuels still dominate, generating 703.2 TWh versus 282.8 TWh from non-fossil sources.

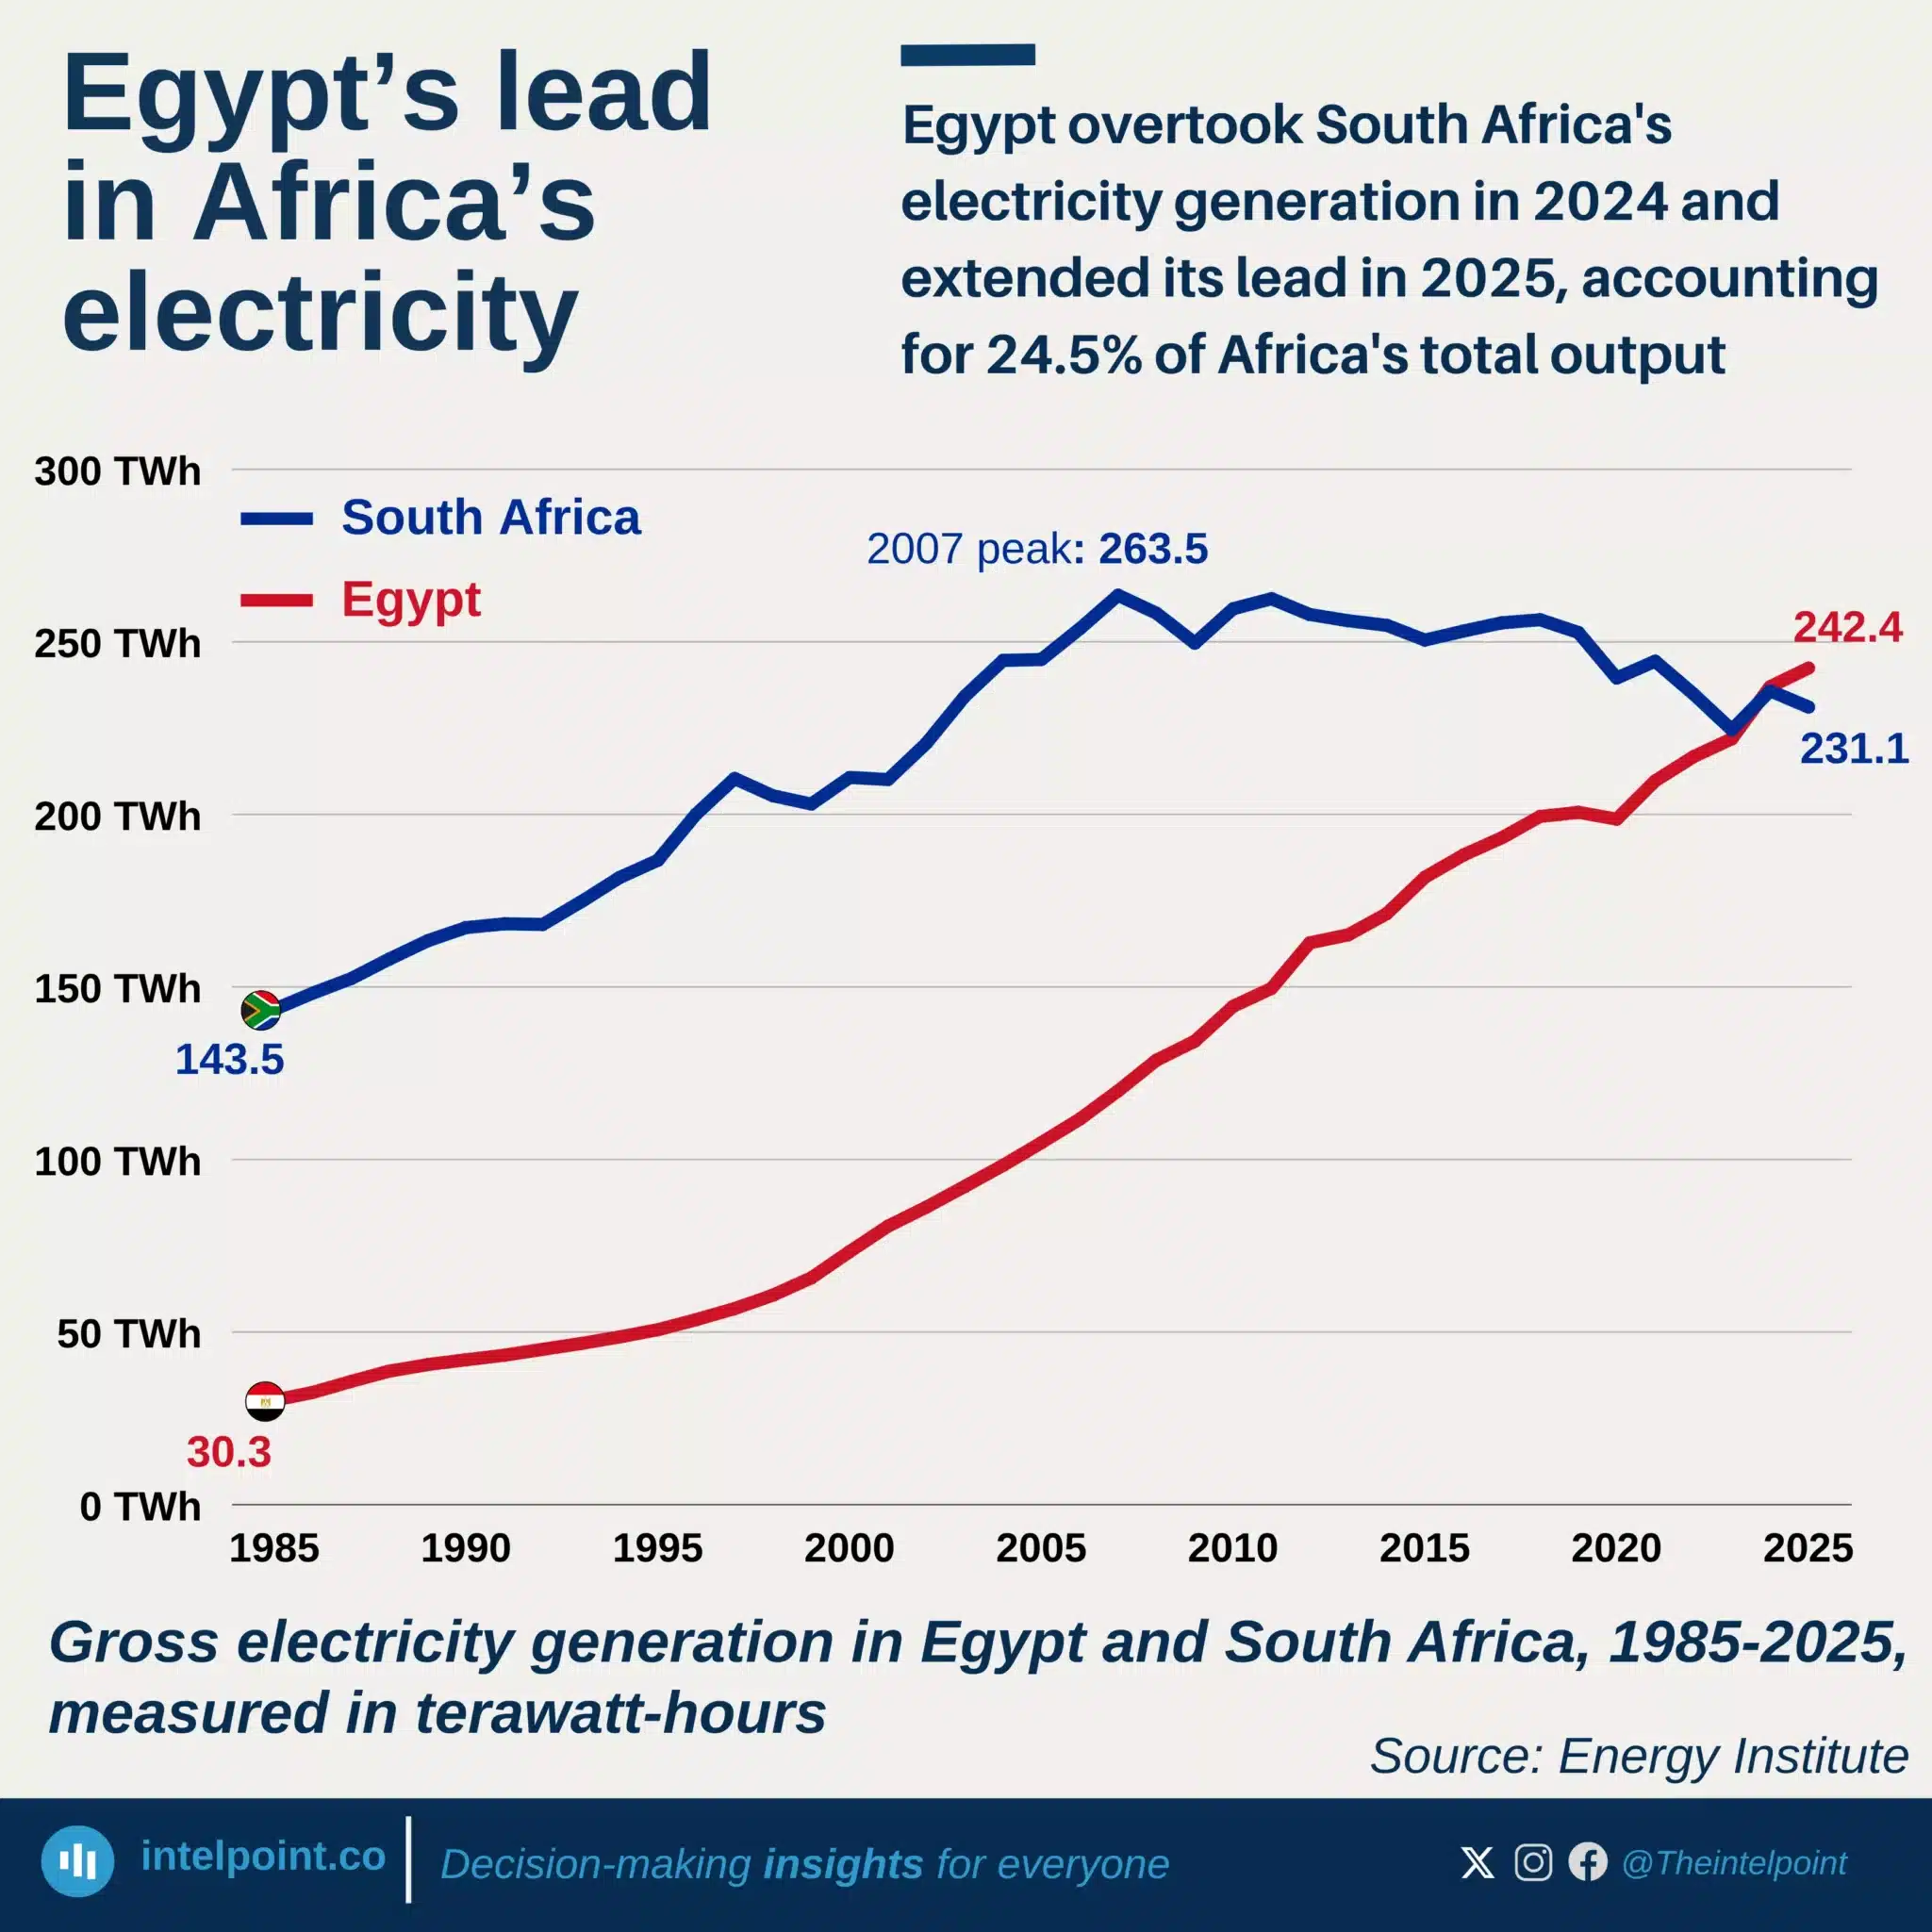
Egypt overtook South Africa's electricity generation in 2024 and extended its lead in 2025
  • Africa’s share of global electricity generation rose only from 2.6% in 1985 to 3.1% in 2025.
  • Africa’s electricity generation increased 283% over the past 40 years.
  • Egypt overtook South Africa as Africa’s largest electricity producer in 2024.
  • Egypt generated 242.4 TWh in 2025, up from 30.3 TWh in 1985.
  • South Africa generated 231.1 TWh in 2025, down from its 263.5 TWh peak in 2007.
  • Egypt and South Africa accounted for 24.5% of Africa’s electricity generation in 2025.

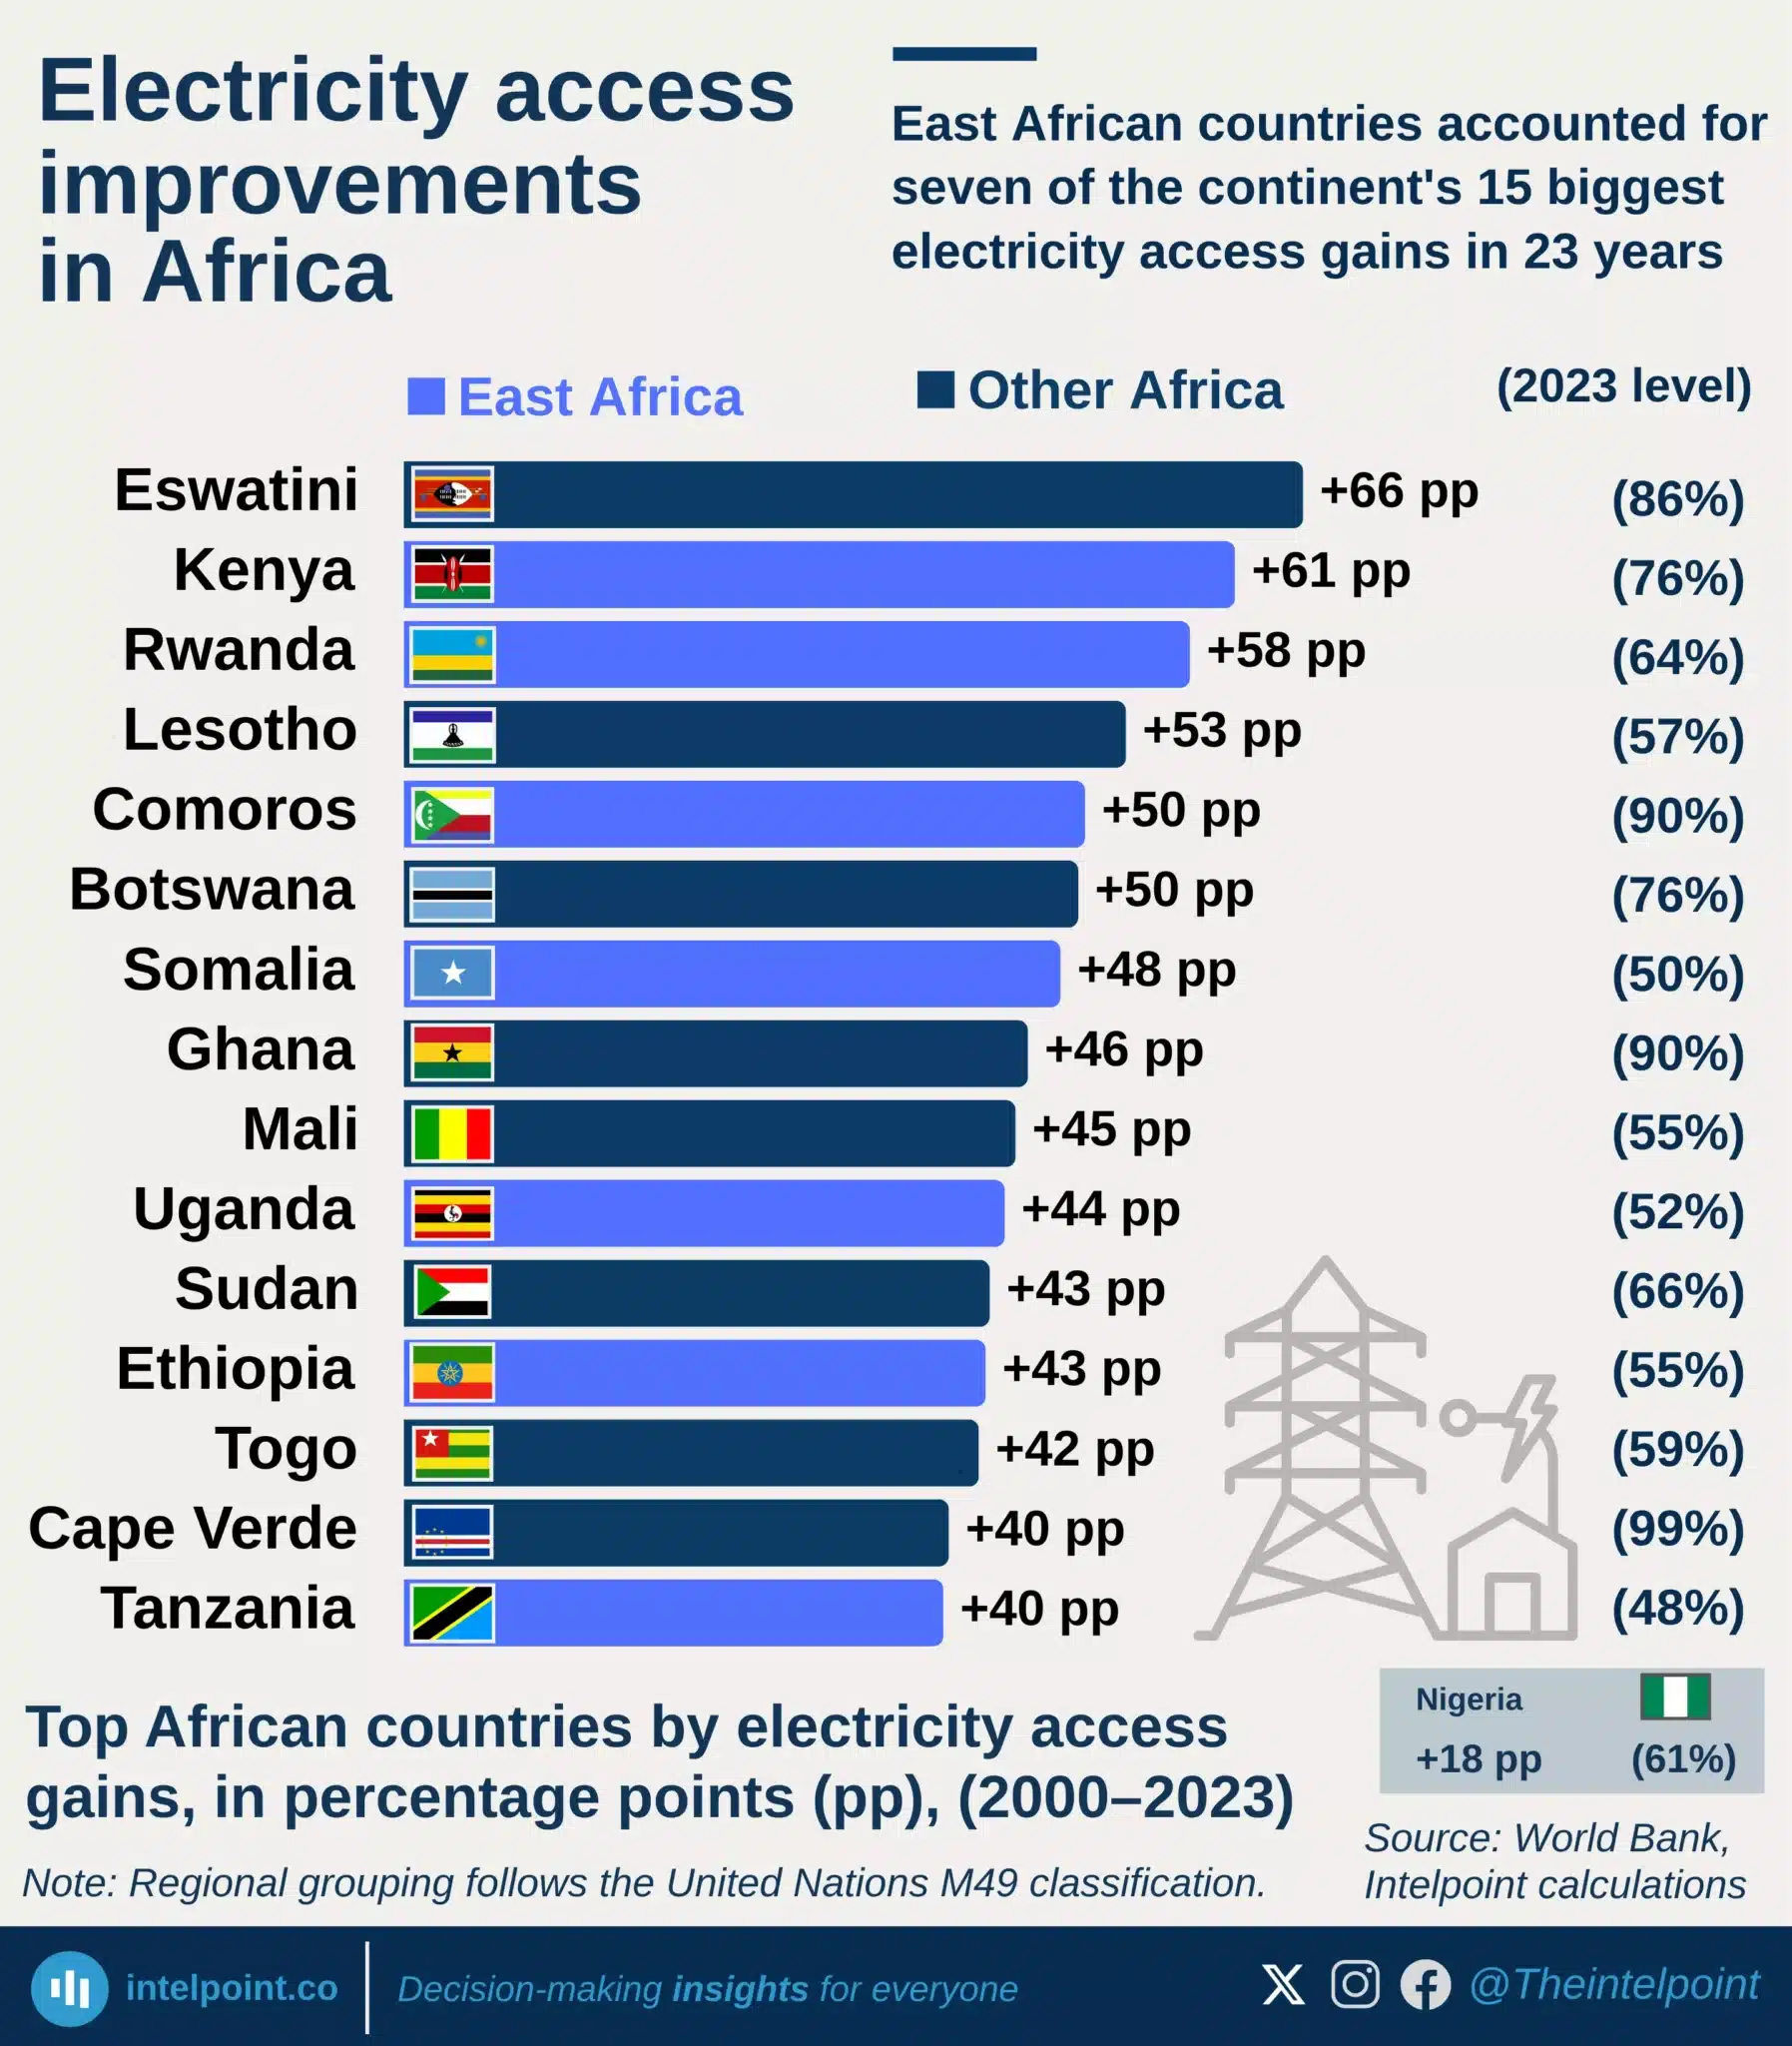
East African countries accounted for seven of the continent's 15 biggest electricity access gains in 23 years
  • Eswatini recorded Africa’s largest electricity access gain, rising by 66 percentage points from 2000 to 2023.
  • Kenya and Rwanda followed with gains of 61 pp and 58 pp, respectively.
  • East African countries accounted for 7 of Africa’s top 15 electricity access improvements.
  • Comoros, Ghana and Cape Verde reached very high access levels by 2023, at 90%, 90% and 99% respectively.
  • Nigeria’s electricity access improved by 18 percentage points, from 43% in 2000 to 61% in 2023.
  • Despite that improvement, Nigeria remained outside Africa’s top 15 gainers over the period.
  • Some countries were absent from the ranking because they had already reached high access levels by 2000.

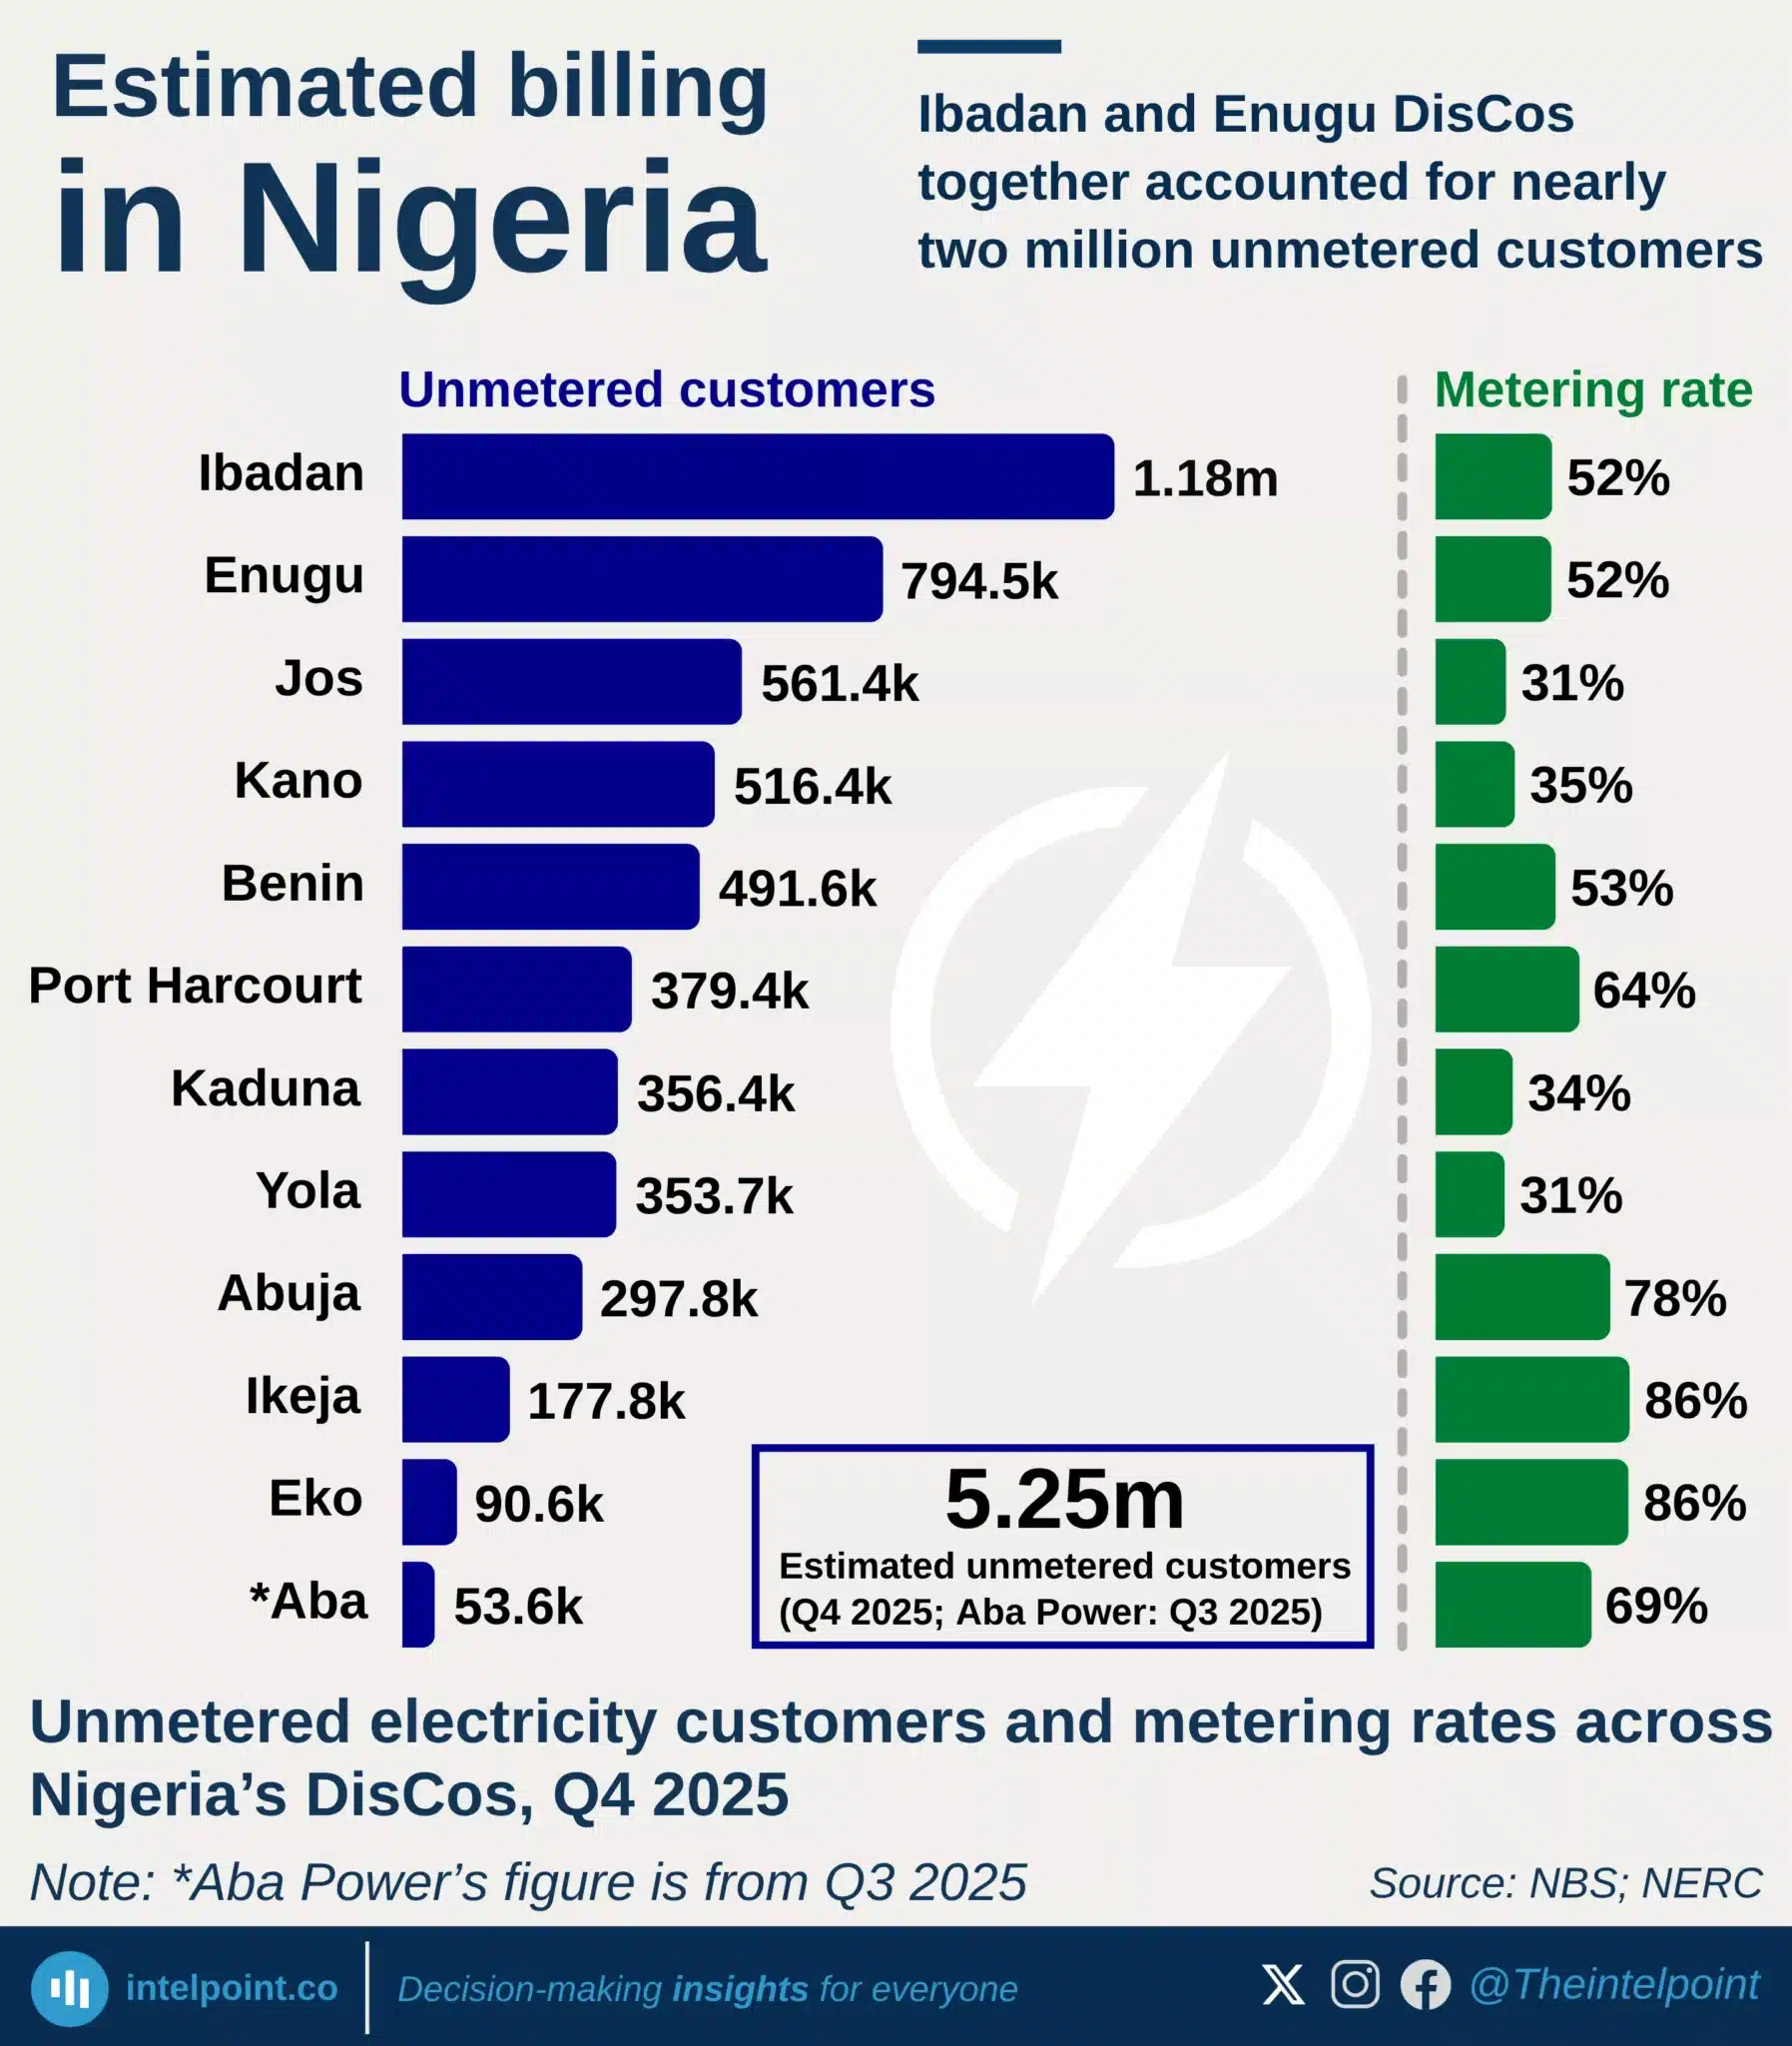
Ibadan and Enugu DisCos together accounted for nearly two million unmetered customers
  • Nigeria still had about 5.25 million unmetered electricity customers across DisCos.
  • The 11 DisCos reported in Q4 2025 had 5.20 million unmetered customers.
  • Nigeria’s reported metering rate stood at 57.3% as of Q4 2025.
  • Ibadan and Enugu had the largest gaps, with nearly two million unmetered customers combined.
  • Ibadan alone had 1.18 million unmetered customers, the highest of any DisCo.
  • Ikeja and Eko had the strongest metering performance, both at about 86%.
  • At the 2025 pace of meter additions, closing the current gap could take close to seven years.

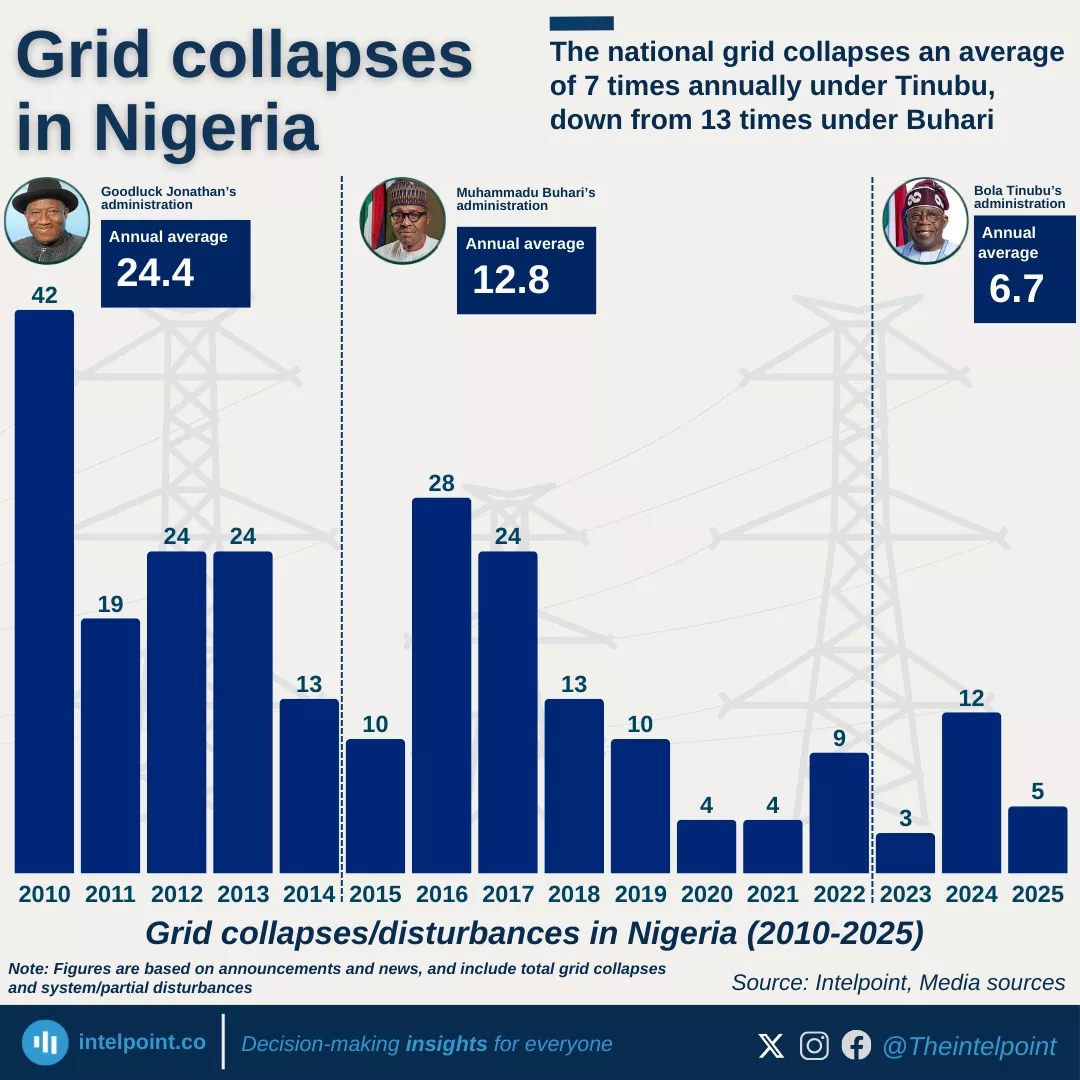
The national grid collapses an average of 7 times annually under Tinubu, down from 13 times under Buhari
  • The highest number of grid collapses in the past 16 years occurred in 2010, with 42 incidents recorded.
  • During Goodluck Jonathan’s administration, Nigeria’s grid collapsed an average of 24.4 times a year, the highest among the three administrations.
  • Under Muhammadu Buhari, the annual average dropped to 12.8 collapses per year, indicating improved grid stability compared to earlier years.
  • Under Bola Ahmed Tinubu, the average has fallen further to about 6.7 collapses annually.
  • 2016 recorded the highest number of collapses during the Buhari administration, with 28 incidents.
  • The most stable years in the dataset were 2020 and 2021, with only four collapses each.

POPULAR TOPICS
SIGN UP TO OUR NEWSLETTER
Get periodic updates about the African startup space, access to our reports, among others.
Subscribe Here
Subscription Form

A product of Techpoint Africa. All rights reserved