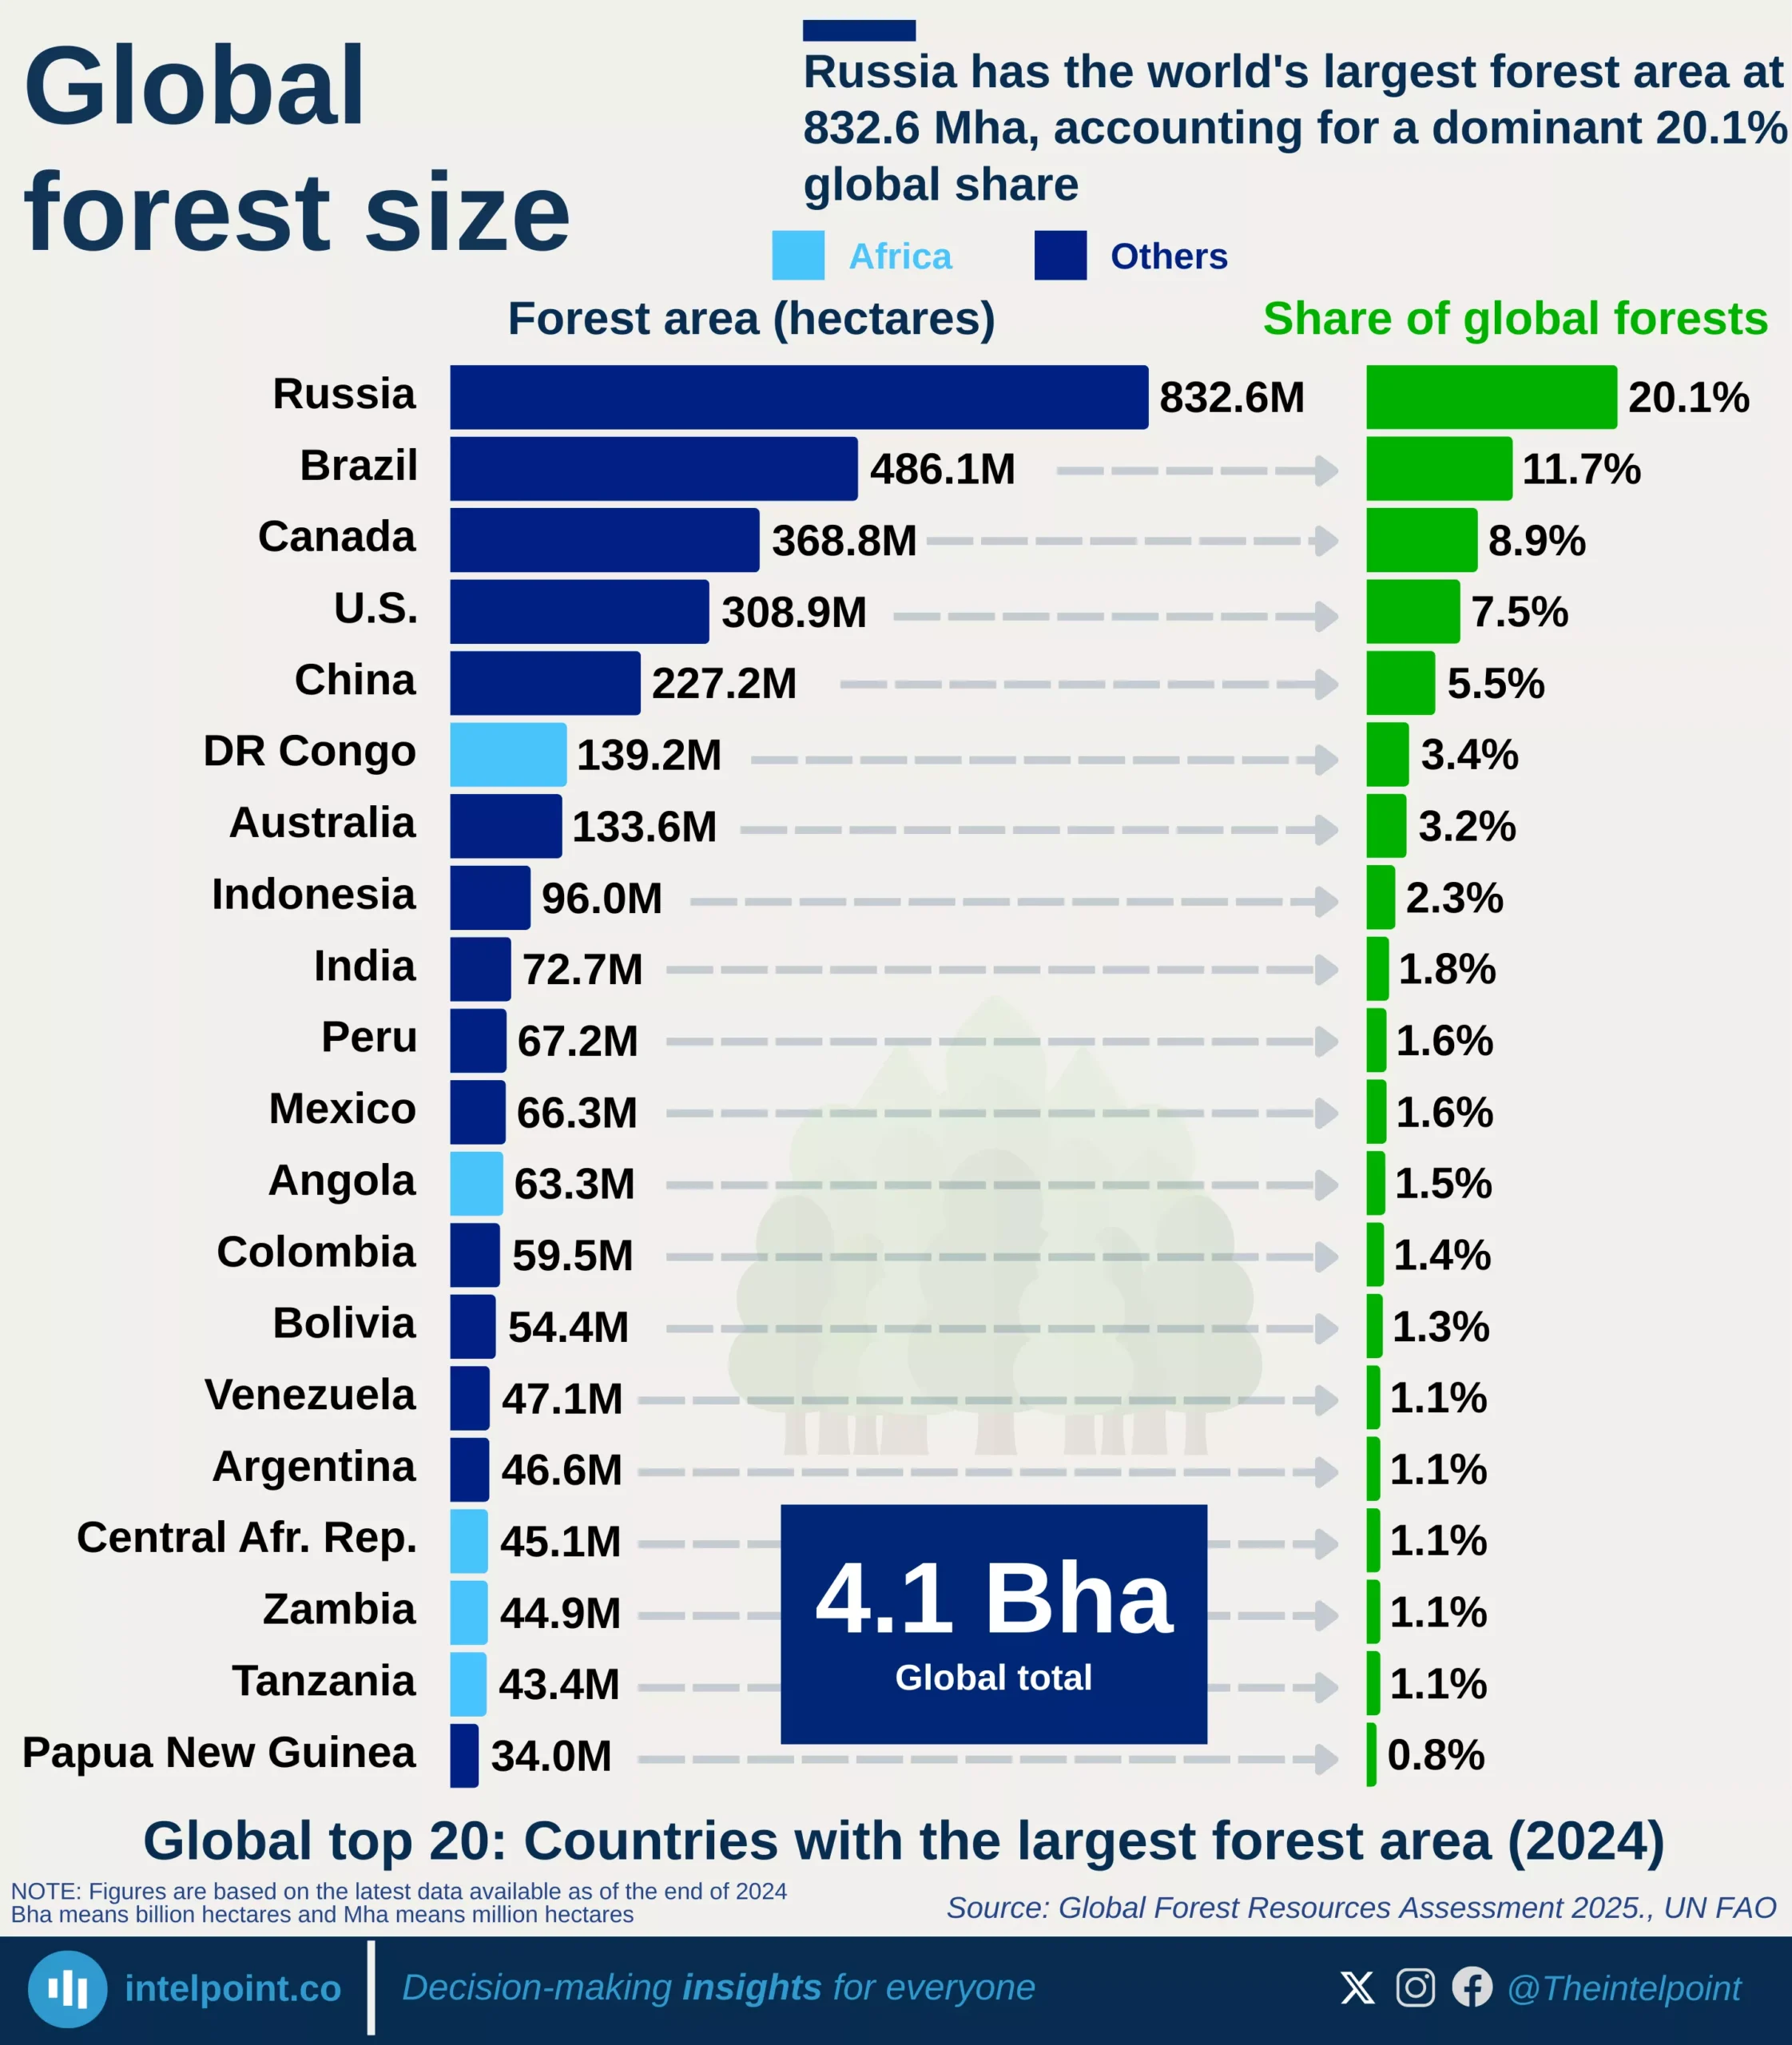
Global forest cover is 4.1 Bha, according to the latest FAO assessment.
At 832.6 Mha, 20.1% of the global total, Russia has the world’s largest forest area.
Brazil (486.1 Mha; 11.7%) and Canada (368.8 Mha; 8.9%) rank second and third, respectively.
The United States (7.5%) and China (5.5%) complete the global top five.
Africa’s top contributor is the Democratic Republic of Congo, with 139.2 Mha, 3.4% of the global total.
Other African countries in the top 20 include Angola, Zambia, Tanzania, and the Central African Republic, each accounting for approximately 1% of the global forest area.
Together, the top ten countries account for over 78% of the world’s total forest area, highlighting the global concentration of forest resources.
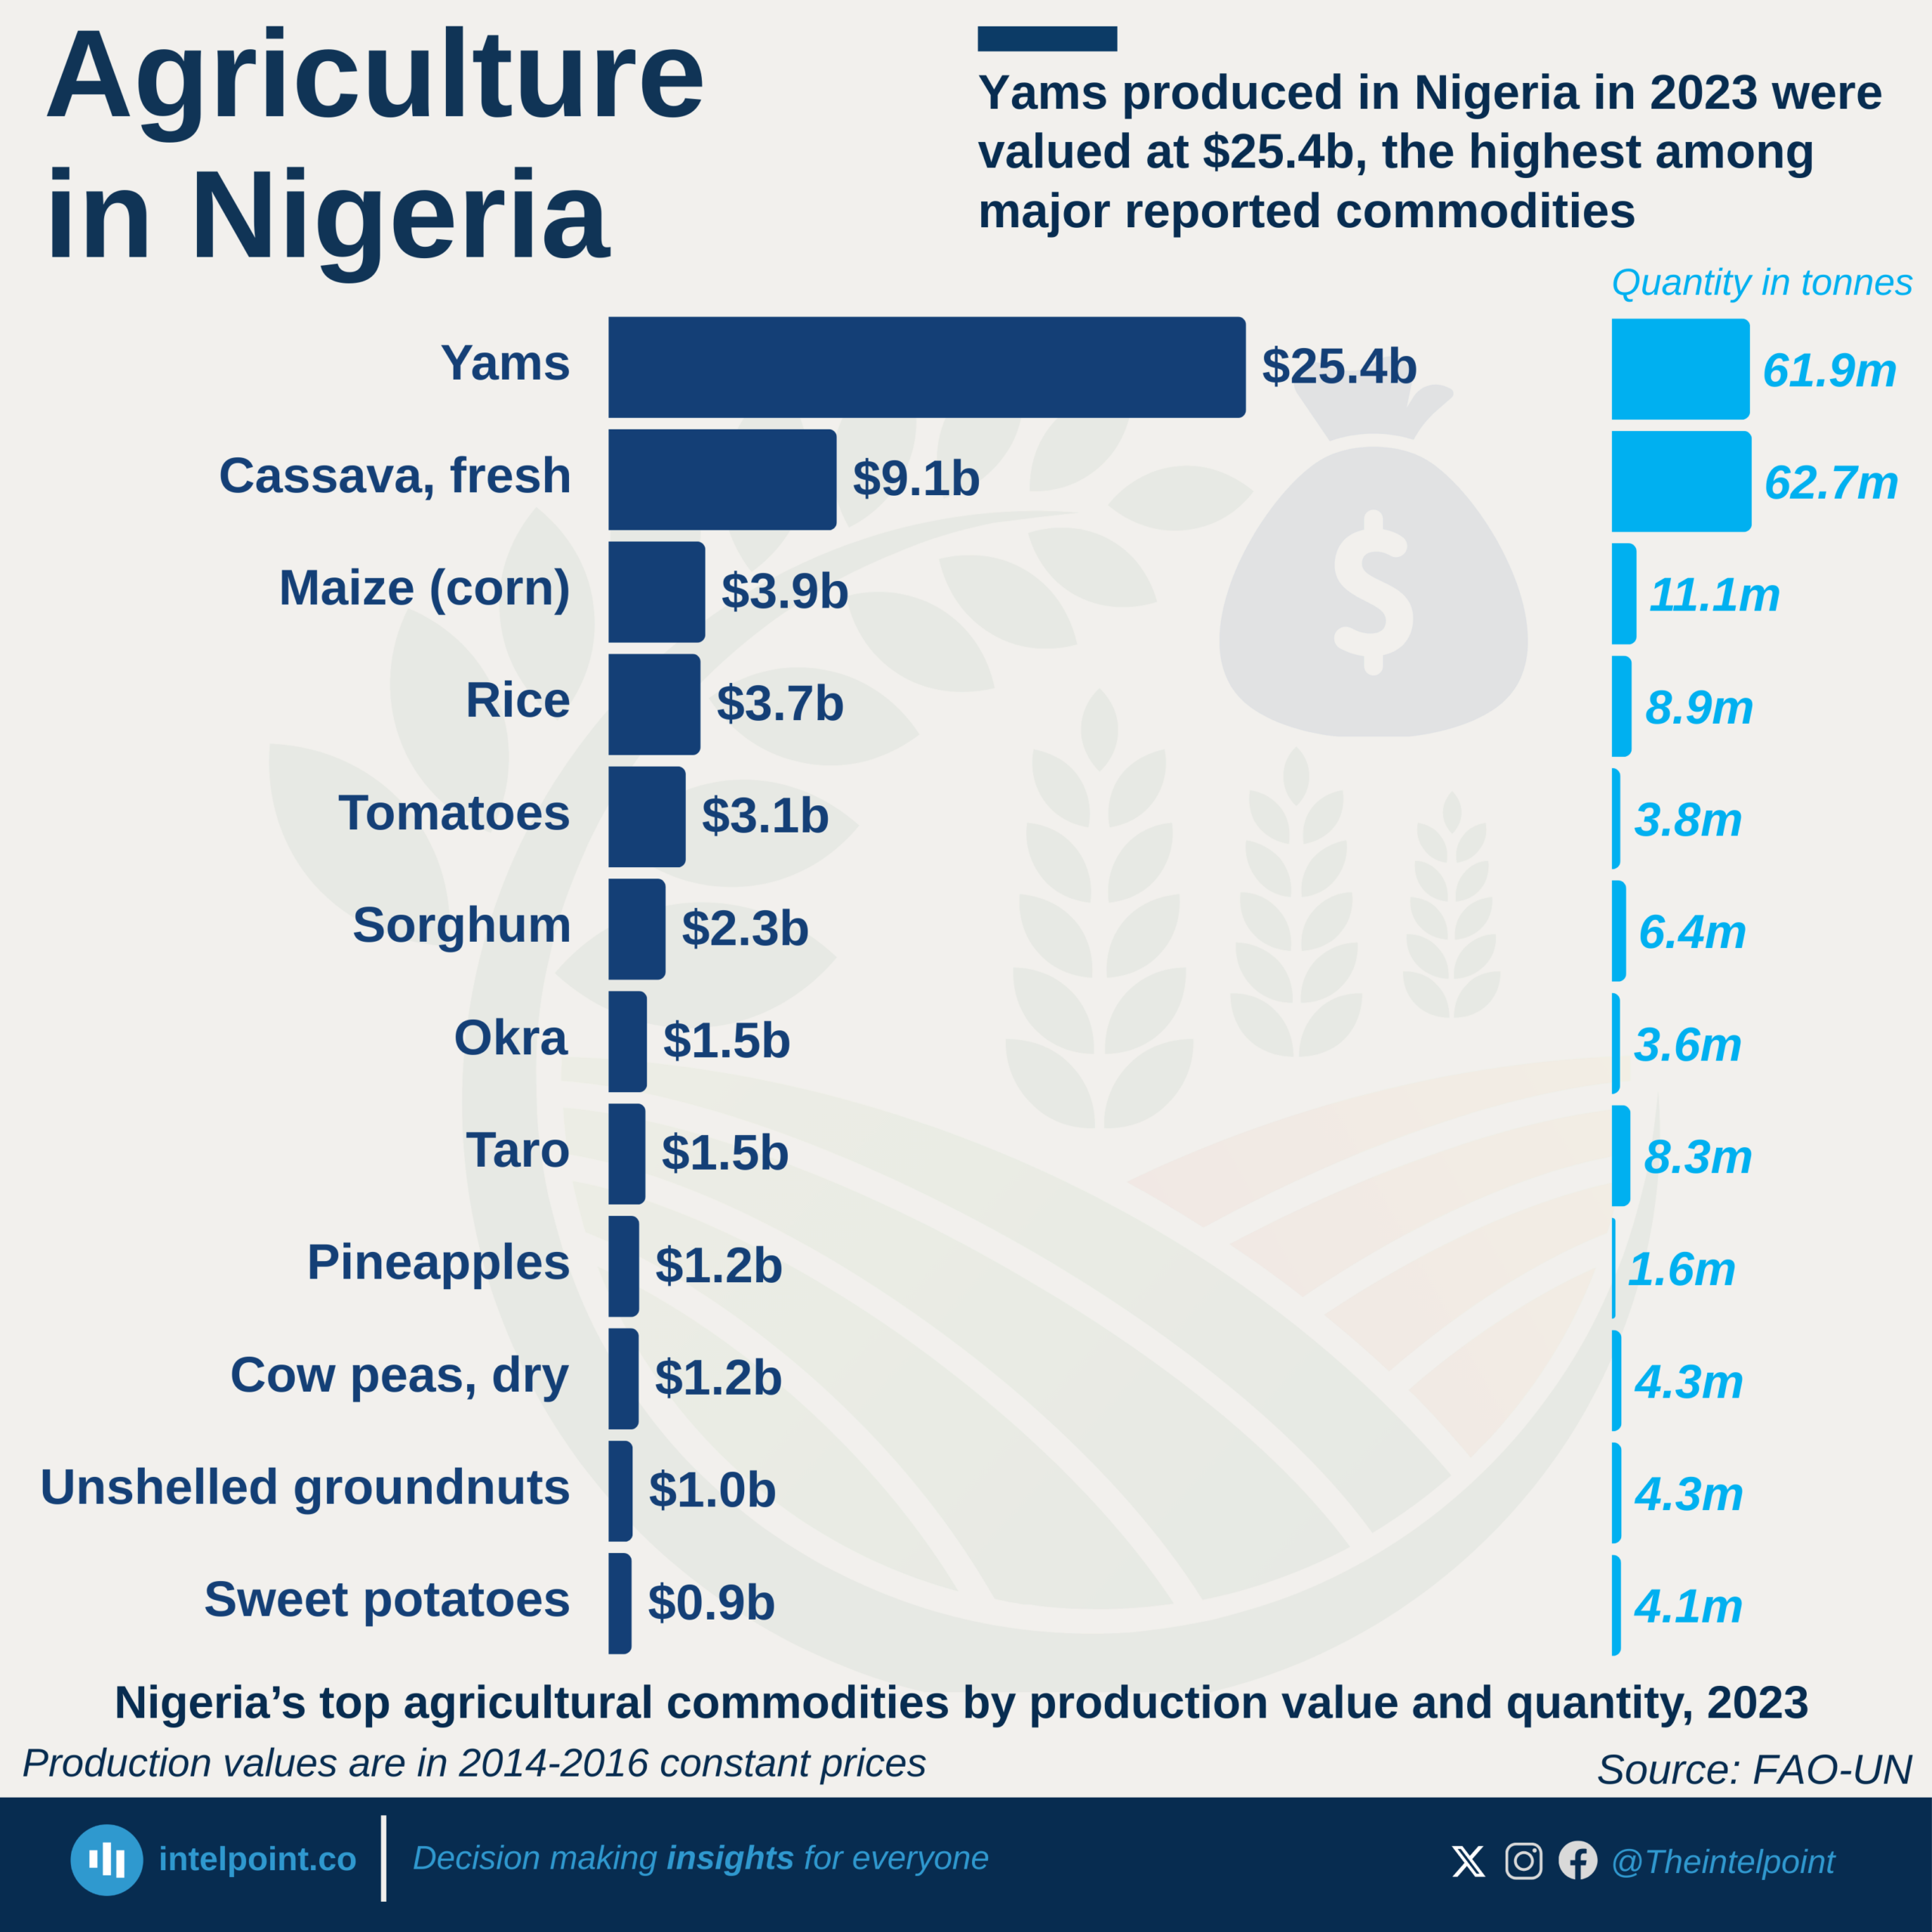
After yielding 61.9 million tonnes, yams were valued at $25.4 billion in 2023, the highest among reported commodities.
With 62.7 million tonnes produced, cassava generated $9.1 billion, making it the second most valuable crop.
Okra ($818/t), tomatoes ($808/t), and pineapples ($753/t) earned the highest returns per unit despite smaller volumes (1.6–3.8 million tonnes).
Maize ($3.7 b, 11.1 m t), rice ($3.1 b, 8.9 m t), sorghum ($2.3 b, 6.4 m t), cowpeas ($1.2 b, 4.3 m t), and groundnuts ($0.9 b, 4.3 m t) form the backbone of production.
Egypt dominated African cotton production for decades, from the 1960s to the early 2000s, standing far ahead of other African countries in both volume and quality.
The early 2000s marked a major turning point, as West African countries — especially Burkina Faso and Mali — began to overtake Egypt in total production.
Burkina Faso emerged as the new cotton leader between 2005 and 2015, topping production in key years like 2005, 2006, 2008, 2009, and 2012–2015, and later reclaiming the top spot in 2020 and 2022.
Mali built its cotton strength after 2015, becoming Africa’s number one producer multiple times, peaking at over 334,000 tonnes in 2019.
Benin and Côte d’Ivoire quietly closed the gap throughout the 2010s, consistently ranking in the top three, even though they didn’t dominate the number one spot.
Nigeria held the top spot in global cashew production from 2001 to 2010. This highlights a period of strong agricultural output, though the country has since been overtaken by India and Côte d'Ivoire. In recent years, Côte d'Ivoire has emerged as the world’s leading cashew producer, holding the top spot for three consecutive years as of 2022. This shift highlights the country's growing role in global cashew production. India and Mozambique once dominated global production, with India leading for 35 of the past 62 years.