Africa's total external debt service is projected to decrease by over $39 billion between 2024 and 2029

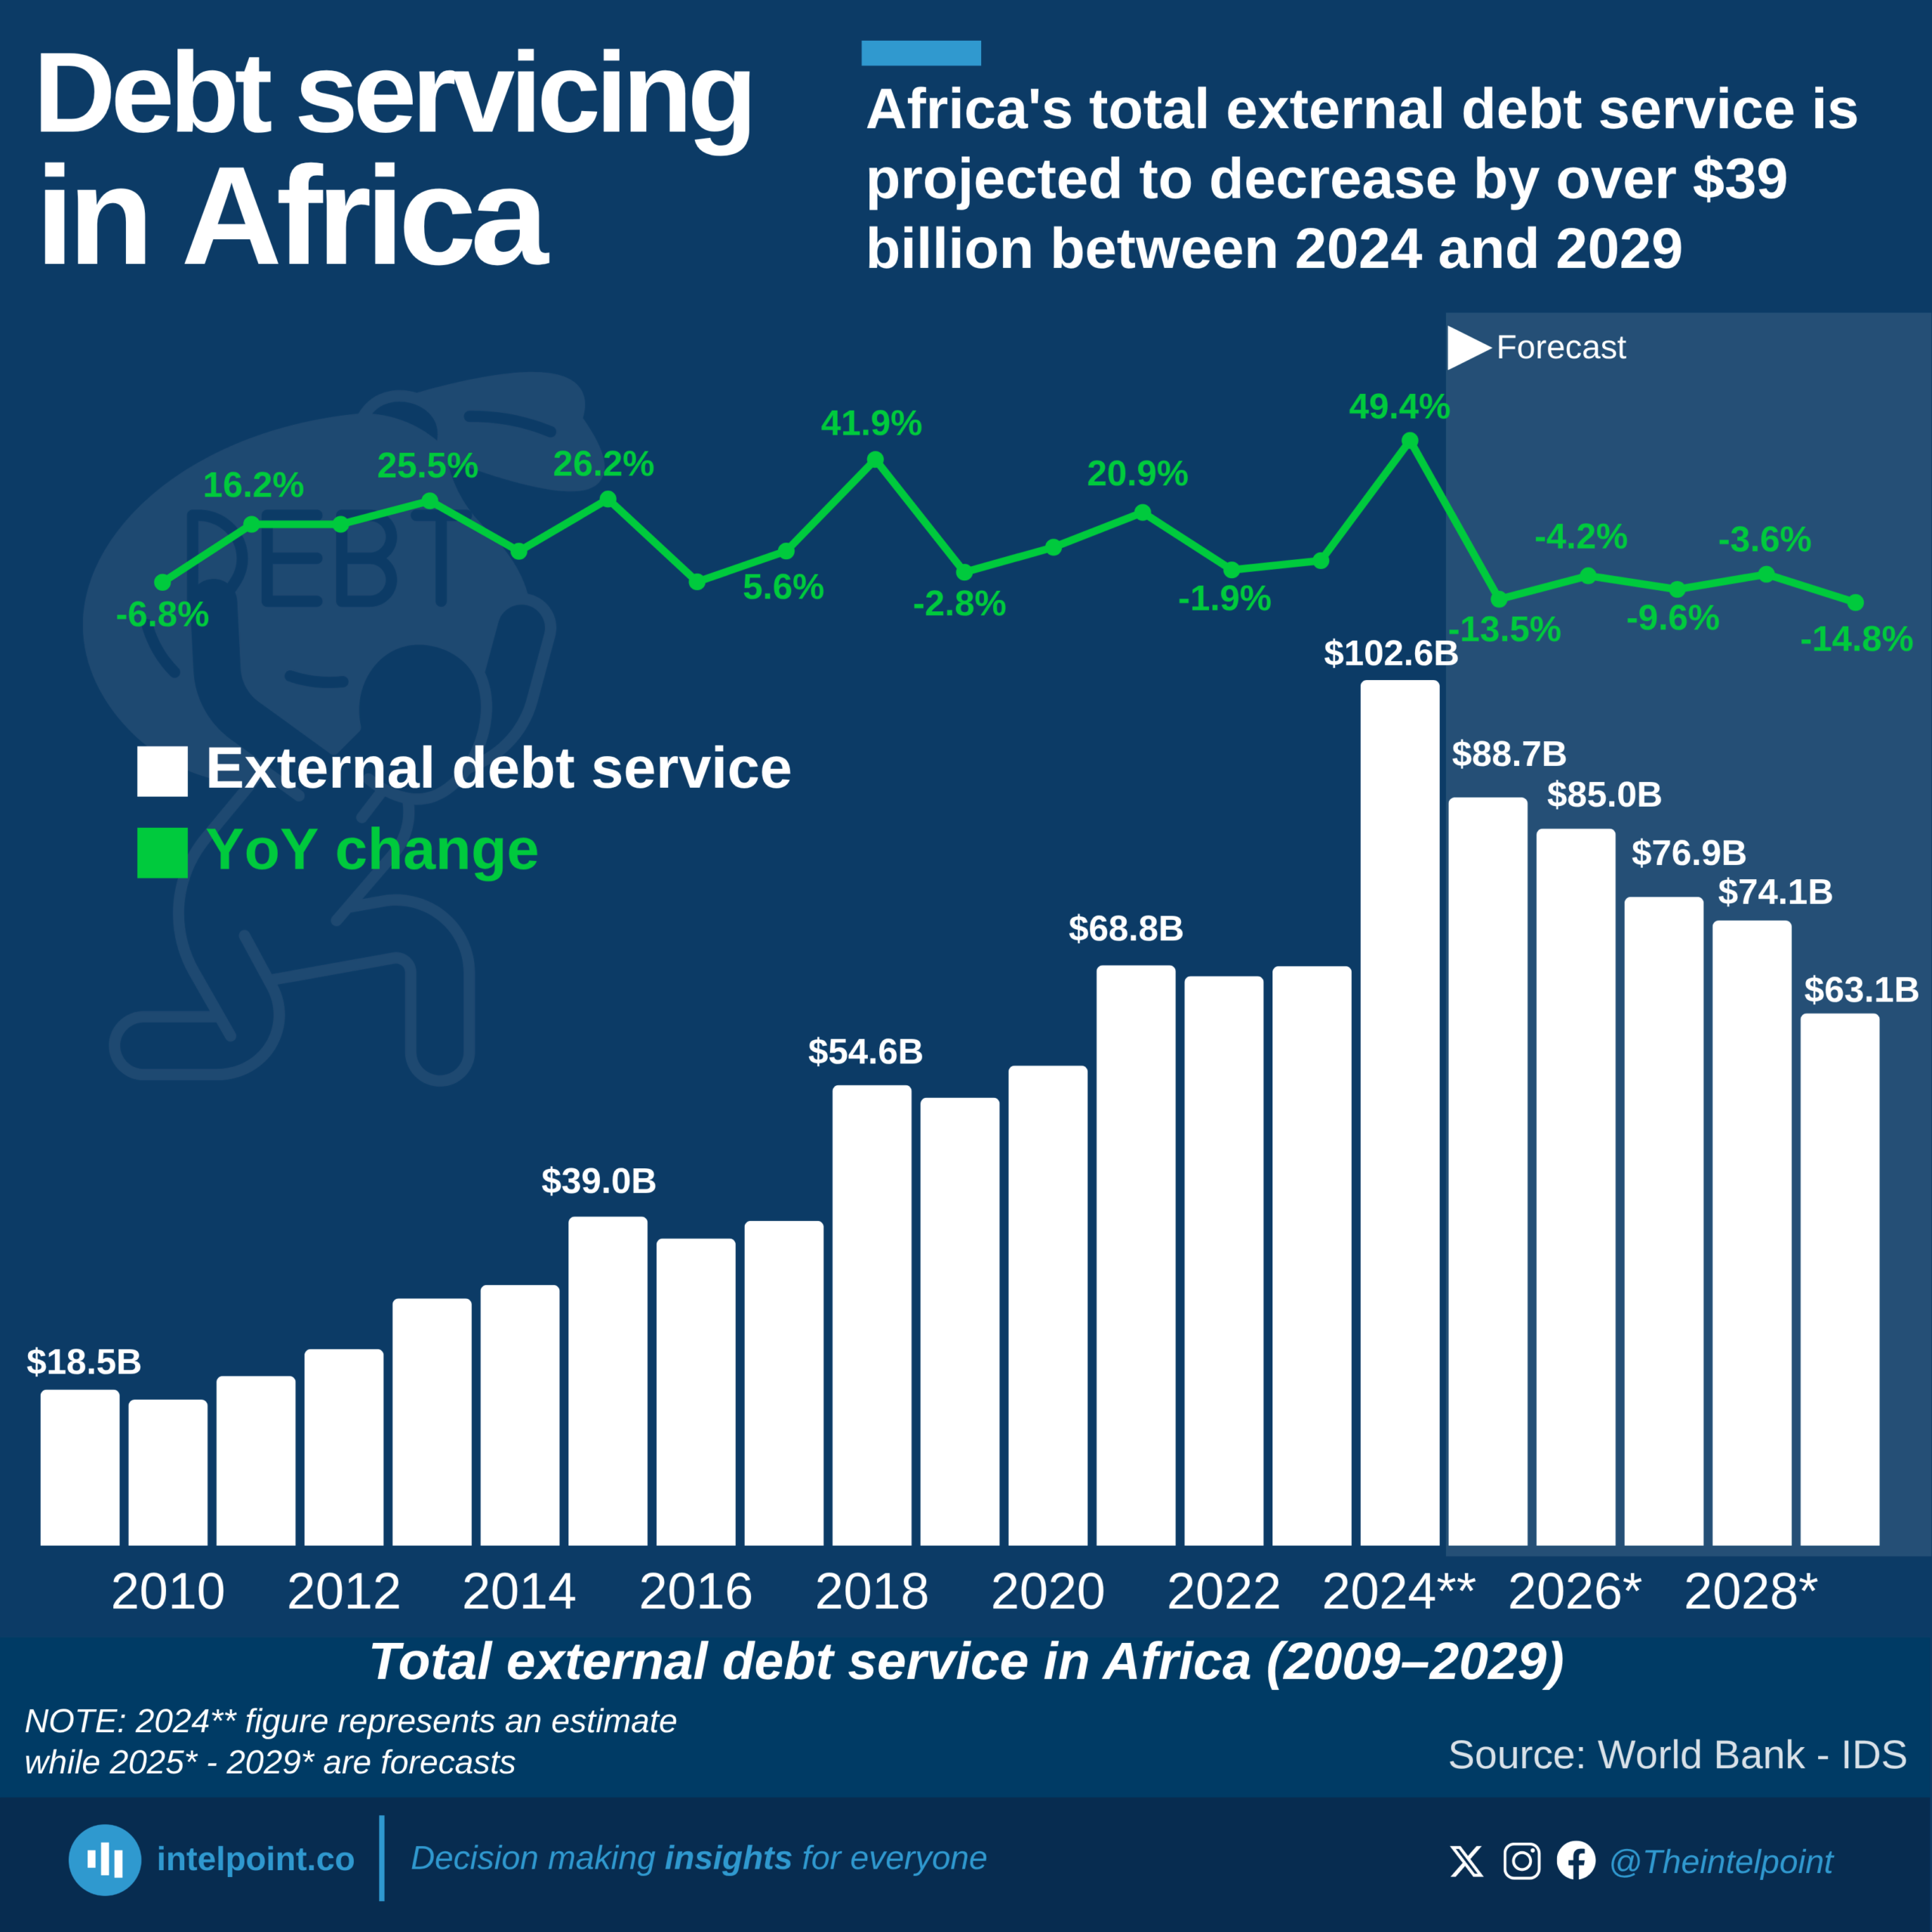
Africa’s external debt service burden peaked at an estimated $102.6 billion in 2024, but the outlook suggests a sharp decline over the next five years. Between 2024 and 2029, the total amount that African countries are expected to spend annually servicing their external debts will fall by more than $39 billion (according to projections of the International Debt Statistics), signalling a shift in the continent’s debt dynamics. After more than a decade of steady growth in debt servicing costs, this marks a potential turning point.

One of the most dramatic changes in the chart is the YoY change in 2025, which shows a steep -13.5% drop, the sharpest single-year decrease over 20 years. While the figures from 2025 to 2029 are forecasts, they reflect changing debt maturity schedules, slowing new borrowing, or possibly even early repayments. For countries that have faced pressure on public finances, a reduced debt service burden could provide much-needed fiscal space for investment in social infrastructure and economic recovery efforts.

The trend also reflects how external debt obligations evolved. From $18.5 billion in 2009, payments steadily climbed to nearly $69 billion by 2021, and remained high through 2022. The spike to $102.6 billion in 2024 represents an extraordinary jump, driven by past borrowing and rising repayment schedules.

Source:

World Bank - IDS

Period:

2009-2029
HTML code to embed chart
Want a bespoke report?
Reach out
Tags
Related Insights

Nigeria is Africa’s fastest country to attain $100bn GDP, reaching the mark in a record 34 years
  • Nigeria is the fastest to reach $100B — 34 years, achieving the milestone in 1994.
  • Ethiopia took the longest — 81 years, reaching the mark in 2022 after decades of gradual expansion.
  • Resource-driven economies reached the threshold faster, including Angola (36 years) and Algeria (43 years).
  • North African economies crossed earlier, with Egypt (1989) and Morocco (2008) benefiting from diversified economic bases.
  • South Africa reached $100B as early as 1988, reflecting its long-standing industrial and financial depth.
  • Ghana is among the slowest climbers (68 years), but its recent 2025 milestone shows the impact of sustained reforms and growth.
  • Speed varies widely (34 to 81 years), showing that growth paths across Africa are shaped by very different economic realities.

10 Nigerian states and the FCT cut their external debt by a combined $227.19 million in H1 2025
  • Ten states and the FCT collectively reduced their external debt by $227.19 million in H1 2025.
  • Lagos, Edo, and Rivers accounted for most of the reductions, making up more than three-quarters of the total.
  • Several smaller states also trimmed their balances, but by relatively modest amounts.
  • These reductions significantly offset the increases recorded by 26 other states, helping keep nationwide net external debt growth low.

26 Nigerian states added a combined $239m to their external debt in H1 2025
  • 26 states increased their external debt by a combined $239 million in H1 2025.
  • Imo, Oyo, Kaduna, Enugu, and Ogun recorded the biggest increases.
  • 11 states, including the FCT, reduced their debt through higher repayments.
  • Lagos, Edo, Rivers, and Bauchi accounted for most of the $227 million in reductions.
  • Total state external debt rose only slightly, from $4.8 billion to $4.812 billion.

Egypt and Nigeria led Africa’s industrial output in 2024, with $145.5bn and $89bn, respectively
  • Egypt led with an estimated $145.5 billion, accounting for about 25% of Africa's total industrial output among its top 15 economies.
  • Nigeria followed with $89 billion, while South Africa, Algeria, and Morocco made up the rest of the top five.
  • The top five economies accounted for more than 70% of Africa’s total industrial value added.
  • Notable mid-tier performers, Ethiopia and DR Congo, reflected rapid industrial investment.
  • Using constant 2015 USD reveals real production strength, not nominal currency shifts.

West Africa has the highest concentration of remittance-dependent nations, with 10 countries in the top 20, led by The Gambia (21.1%)
  • The Gambia leads Africa in remittance-GDP ratio, with remittance accounting for 21.1% of its GDP in 2024.
  • Lesotho (20.9%) and Comoros (18.3%) closely follow as highly remittance-dependent economies.
  • Somalia (17.5%) and Liberia (14.3%) also rely heavily on diaspora inflows to support their economies.
  • Nigeria (11.3%) remains a major player, highlighting its strong global diaspora network.
  • Cabo Verde (12.1%) and Senegal (11.6%) demonstrate that remittances are key drivers of income in smaller economies.
  • In larger economies like Egypt (7.6%) and Morocco (8.1%), remittances also make up a significant share of GDP.

Nigeria’s public debt has soared since 2010, with domestic debt up 2,020% and external debt up 1,000% by mid 2025
  • Nigeria’s domestic debt jumped from ₦3.8 trillion in 2010 to ₦80.55 trillion by mid-2025.
  • Foreign debts increased from $4.27 billion in 2010 to $46.98 billion in 2025, reflecting growing reliance on external financing.
  • Debt accumulation surged notably after 2020, coinciding with pandemic spending, naira depreciation, and higher fiscal deficits.
  • The widening gap between revenue and debt service raises questions about Nigeria’s long-term debt sustainability.

POPULAR TOPICS
SIGN UP TO OUR NEWSLETTER
Get periodic updates about the African startup space, access to our reports, among others.
Subscribe Here
Subscription Form

A product of Techpoint Africa. All rights reserved