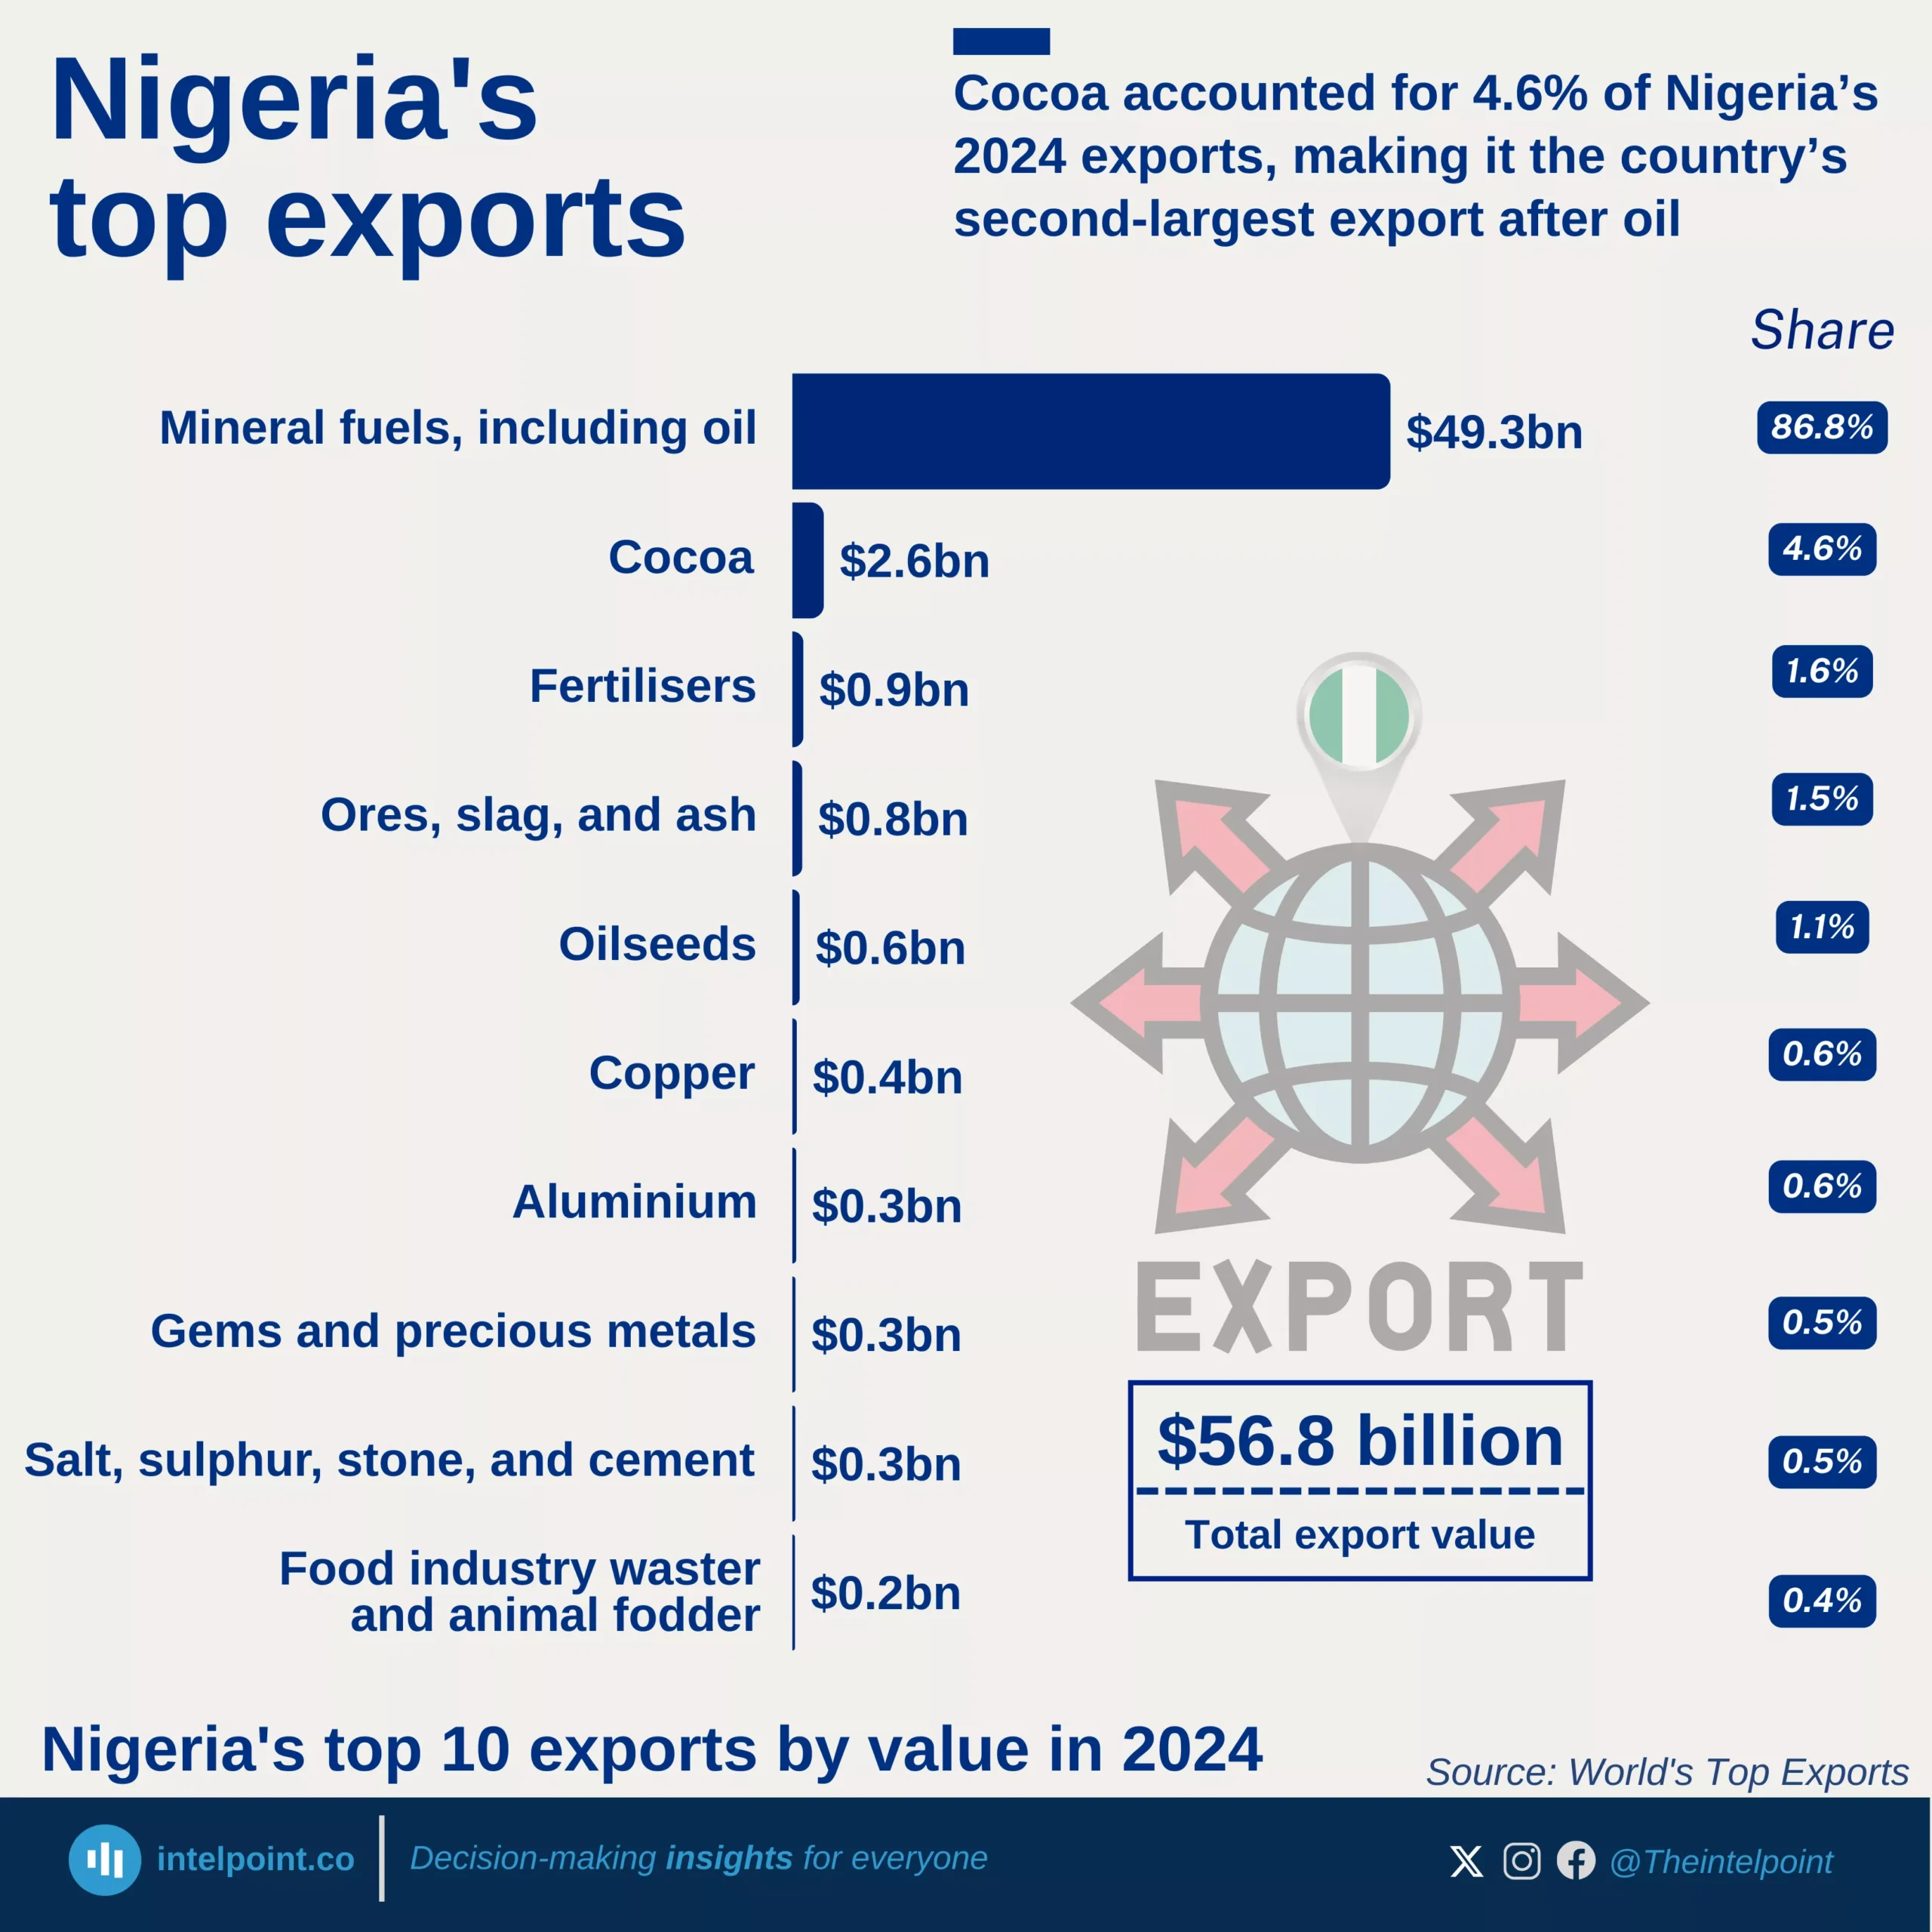
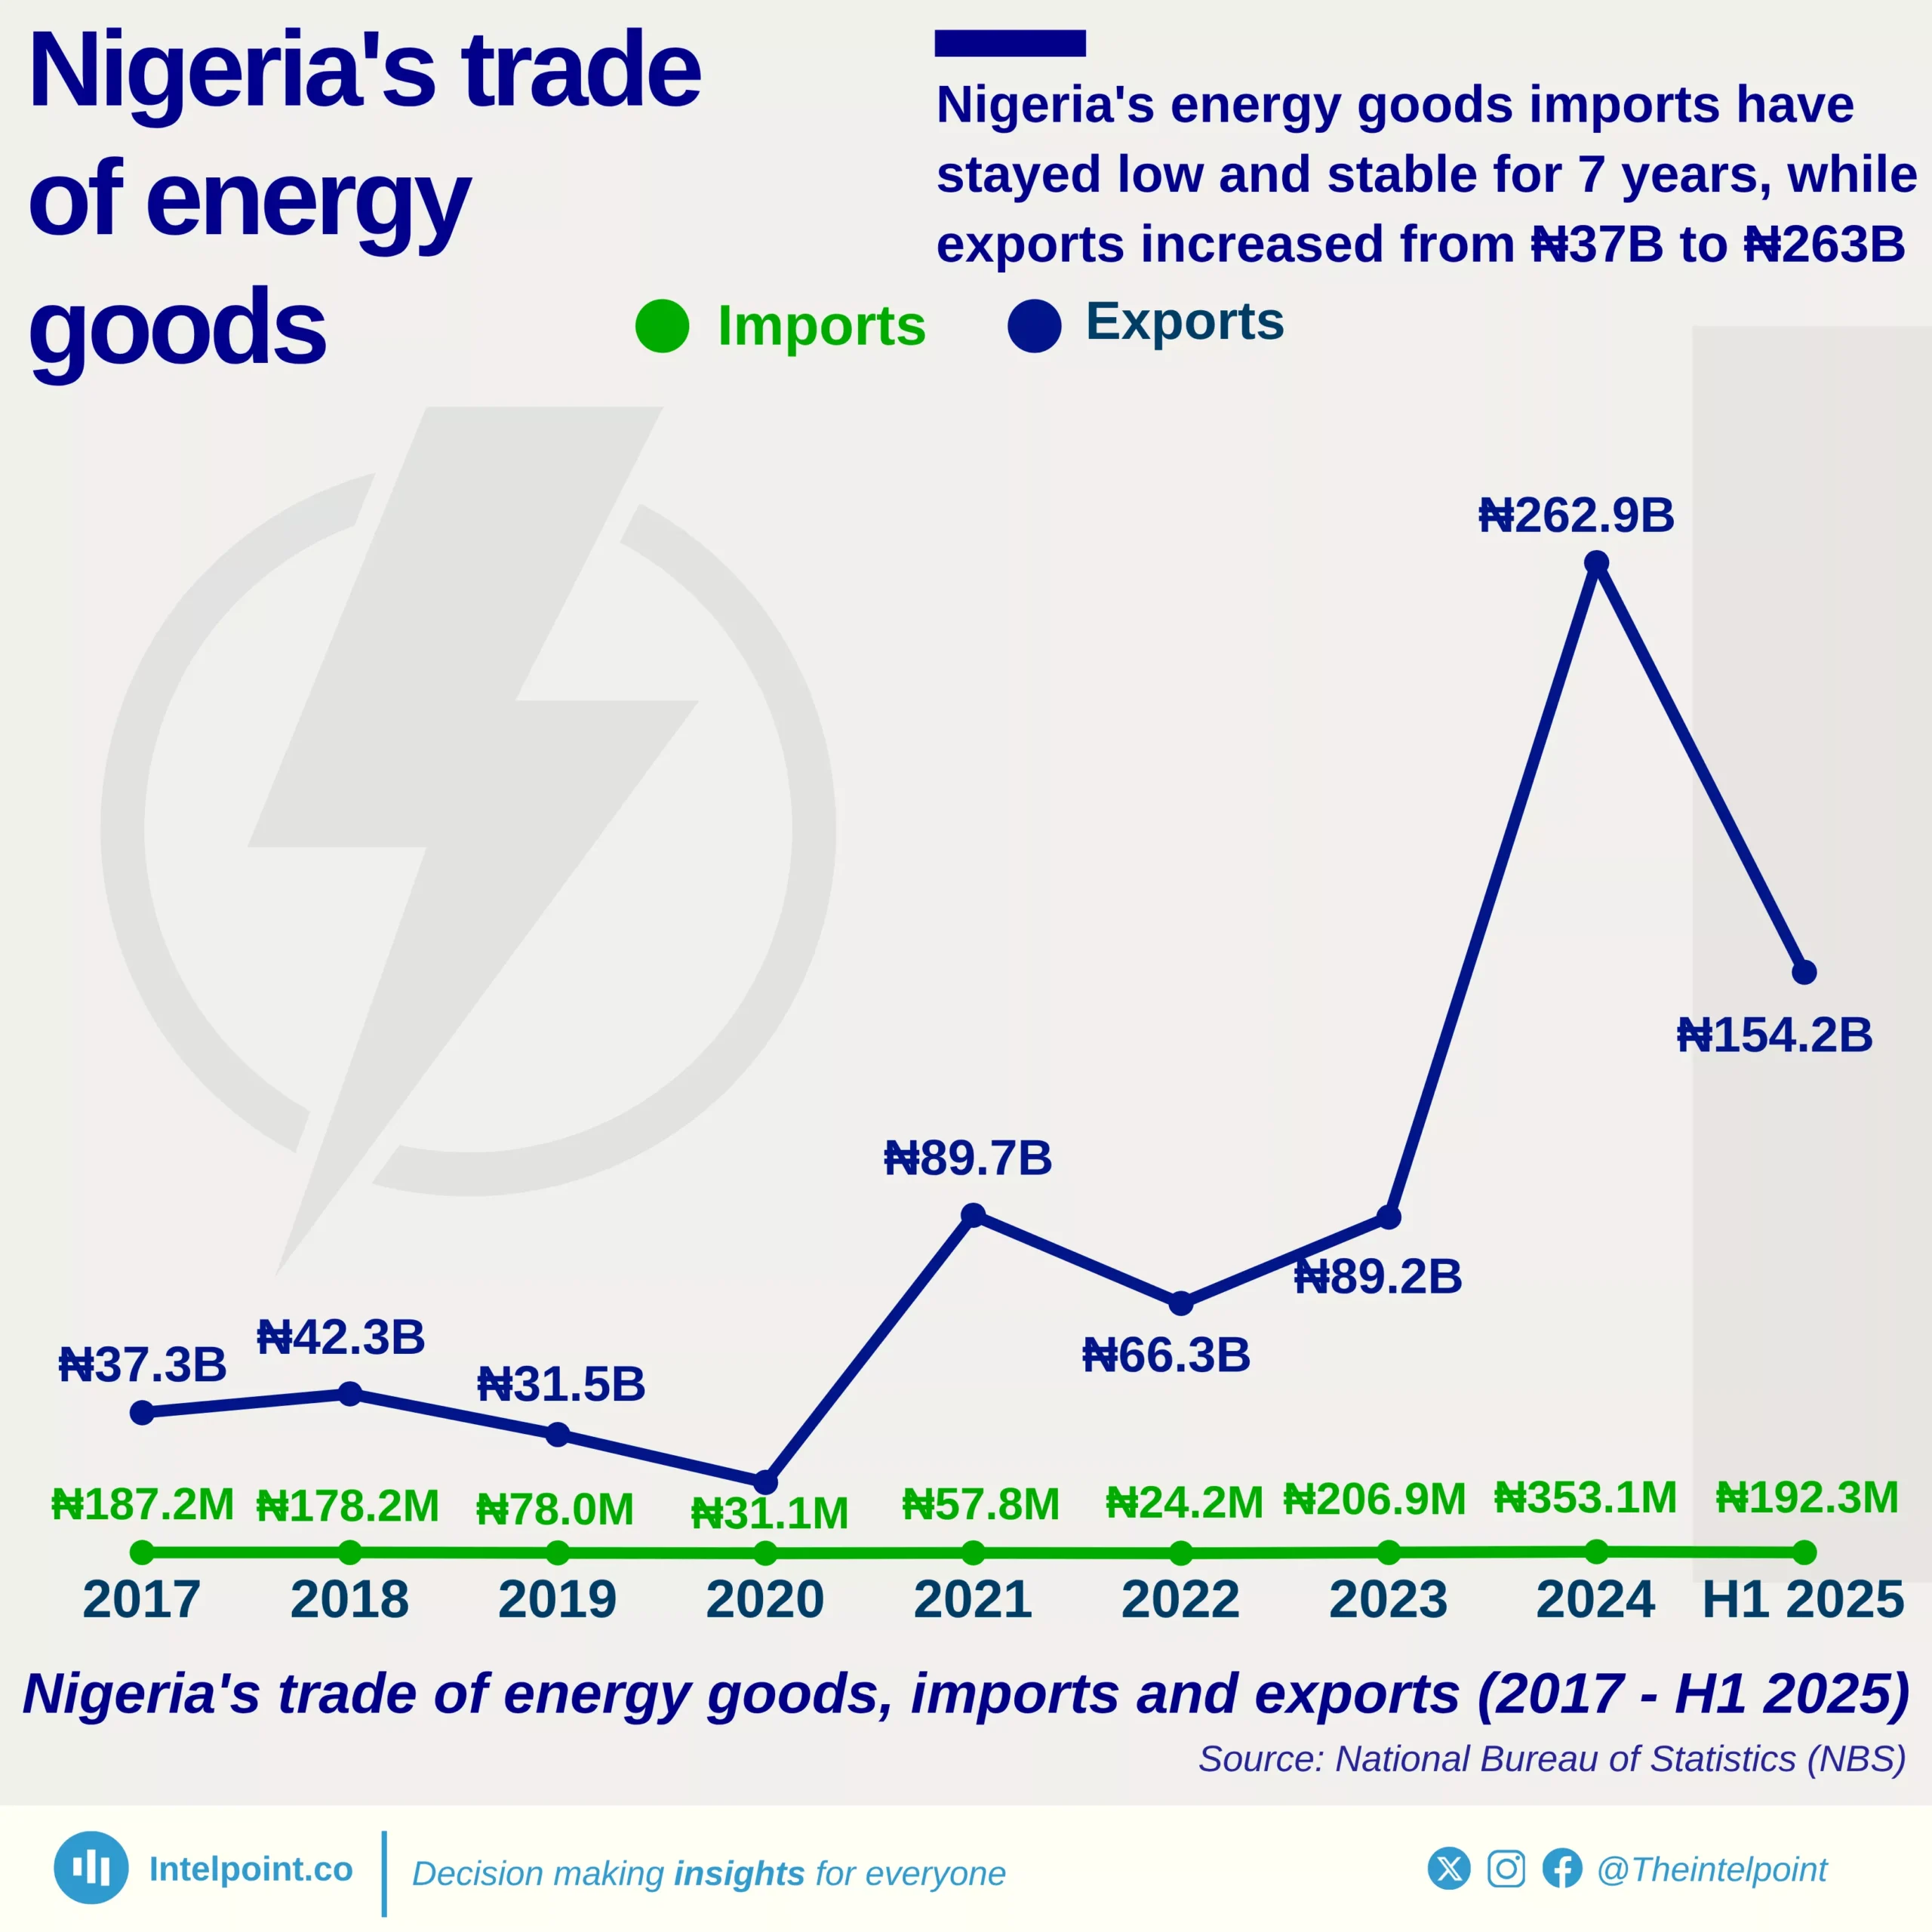
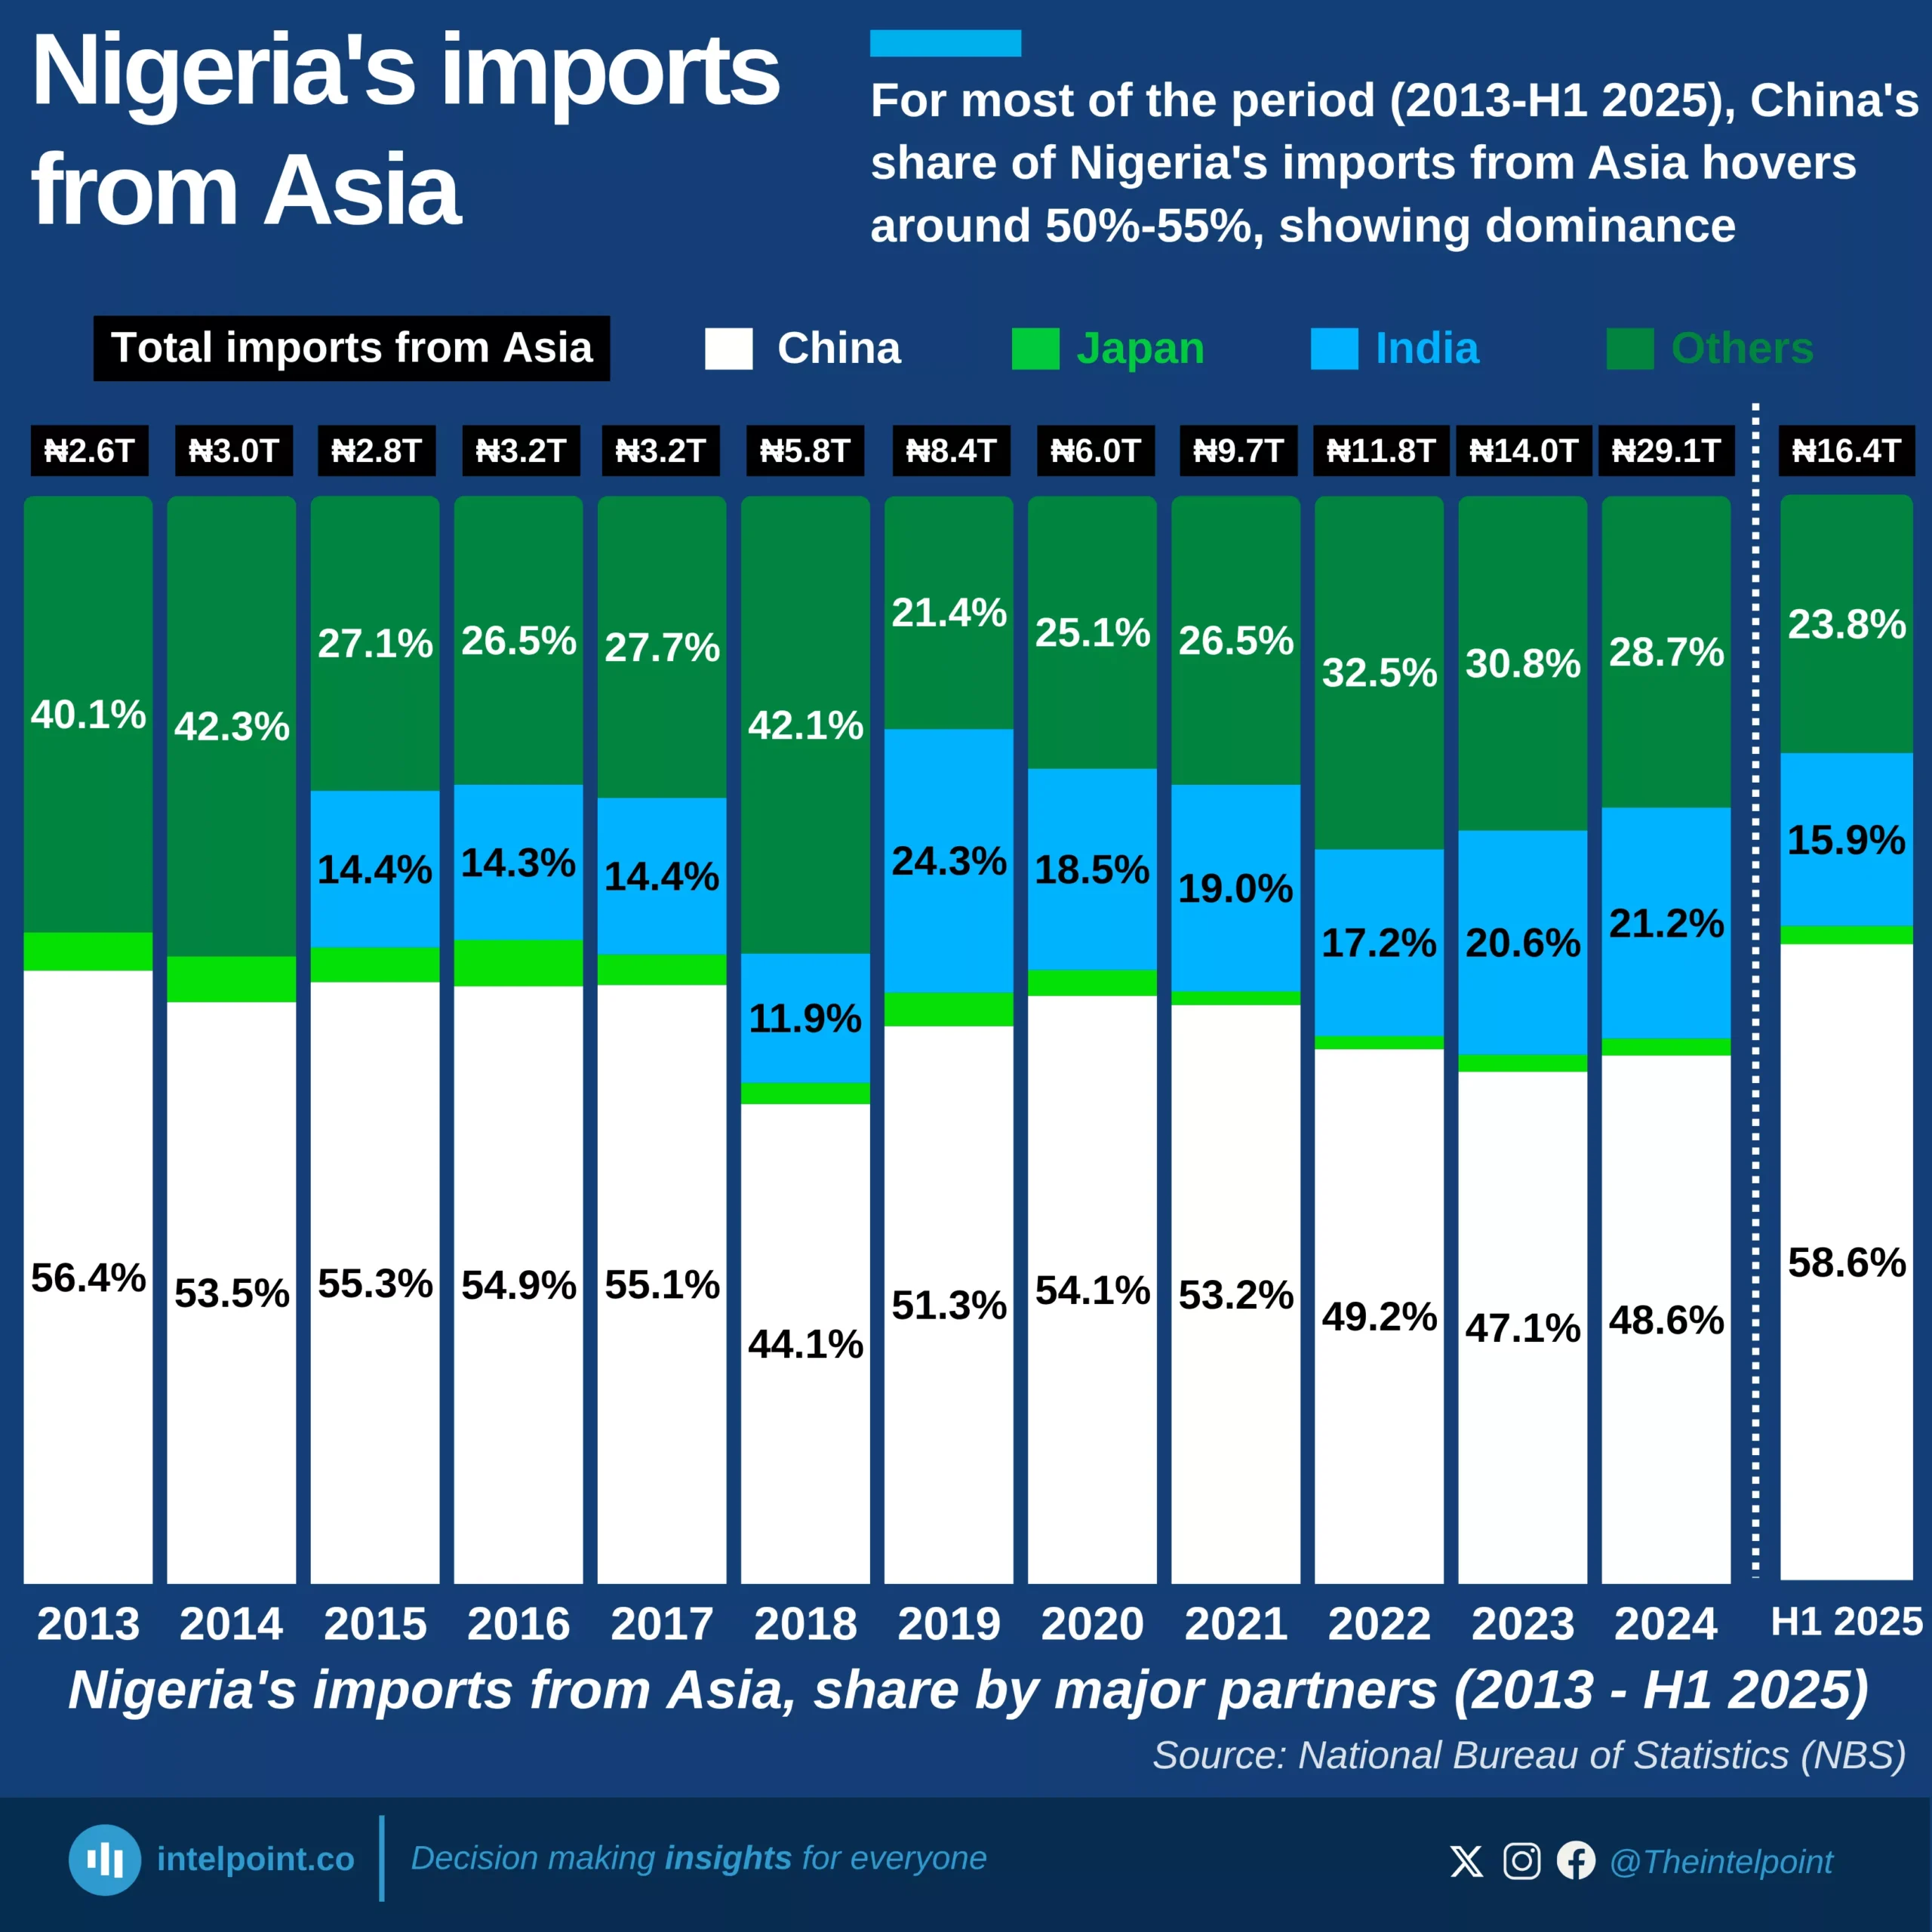
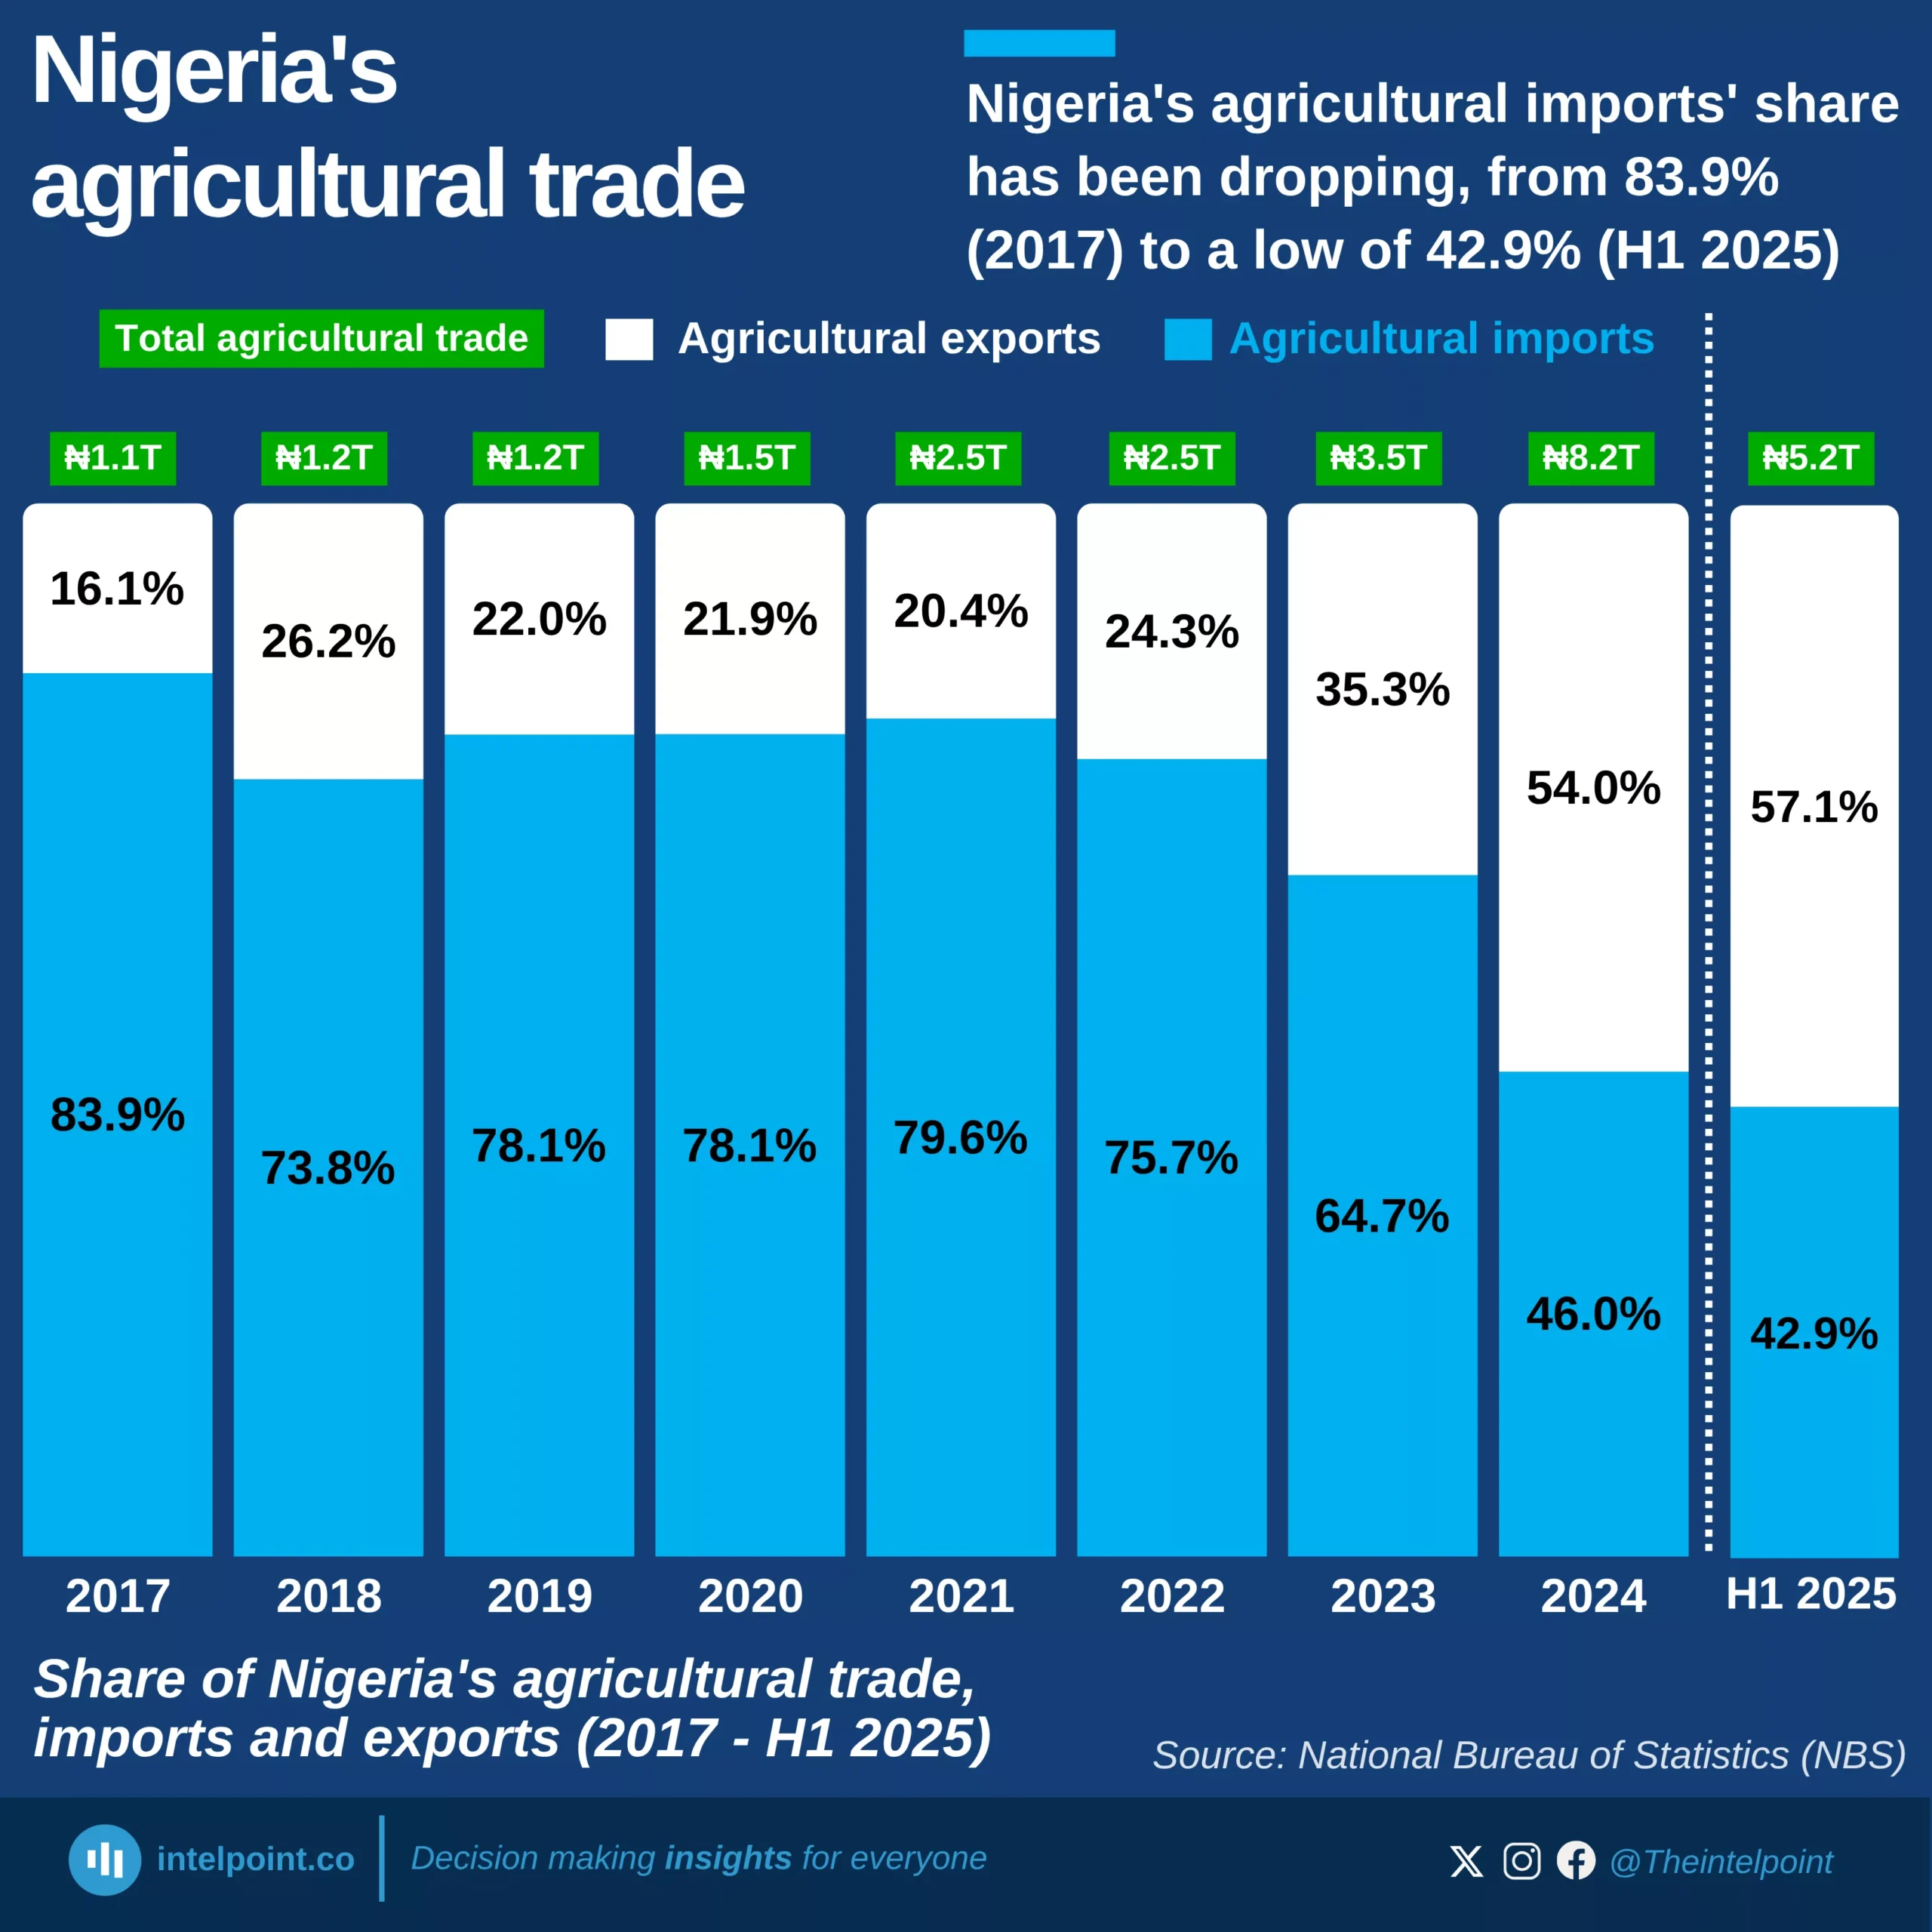
Crude oil leads Nigeria’s global exports with 68.87% share, while refined petroleum products (motor spirit, gas oil) top its imports at over 27%

Key Takeaways:

  • Crude oil remains Nigeria’s largest export, while refined petroleum products lead imports.
  • Natural gas ranks as the second-largest export, contributing 9.71% of the total export value.
  • The top five imported products account for 32.28% of Nigeria’s global imports.
  • The top ten exports represent over 95% of Nigeria’s total export value.

In the fourth quarter of 2024, crude oil and oil obtained from bituminous minerals accounted for ₦13.78 trillion, representing nearly 70% of Nigeria’s global exports. Natural gas followed, adding ₦1.94 trillion or 9.71% to Nigeria’s global exports.

On the import side, refined petroleum products topped the list. Motor spirit (petrol) led with ₦3.3 trillion, while gas oil followed with ₦1.23 trillion. Together, these accounted for over 27% of Nigeria’s global import value.

Though oil dominates the country's export trade landscape, non-oil exports such as cocoa beans, sesame seeds, and natural cocoa butter are emerging as valuable contributors to its export diversification strategy, with individual shares ranging from 0.52% to 4.18%. Meanwhile, Nigeria’s imports reflect a broad range of needs, highlighting the importance of enhancing domestic manufacturing and reducing reliance on foreign goods.
Source:

National Bureau of Statistics

Period:

Q4 2024
HTML code to embed chart
Want a bespoke report?
Reach out
Tags
Related Insights

Netherlands dominated with 18.6% of South African citrus exports in 2023, outpacing other countries
  • The Netherlands led with 18.6% of South Africa’s citrus exports in 2023.
  • The U.S. accounted for 5.8% of South Africa’s citrus exports, a small share compared to Europe and UAE.
  • South African citrus exports to the U.S. in 2023 was valued at $141 million.
  • Other markets, like the UK and UAE, played a larger role in South Africa’s citrus trade.
  • Market diversity may reduce the impact of the trending U.S. tariff on South Africa’s overall citrus export.

Djibouti's inflation peaked at 5.18% in 2022, its highest in a decade
  • Djibouti’s inflation reached a peak in 2022, with 5.18%, the highest in the past decade.
  • The lowest inflation rate occurred in 2015, with a negative value of -0.85%.
  • From 2014 to 2023, Djibouti experienced fluctuating inflation, with increases in 2016, 2019, and 2022.
  • Between 2022 and 2023, inflation decreased from 5.18% to 1.50%.
  • The year 2018 saw the lowest inflation among positive rates, with a modest 0.15%.
  • The overall trend shows periodic inflation spikes, particularly in 2016, 2019, and 2022, while other years maintained relatively stable or lower inflation.

88% of Nigeria's 2024 exports came from crude oil and co., 5.73% from agriculture
Key Takeaways:
  • Petroleum products (crude oil and other oil products) dominated Nigeria's export landscape in 2024, accounting for 88.26% of total export value.
  • Agricultural exports contributed 5.73% to export value, despite Nigeria's significant agricultural potential.
  • The manufacturing sector made up just 2.95% of the total export value.
  • Nigeria’s total export value reached ₦77.44 trillion in 2024 from ₦35.96 trillion in 2023.
  • Non-oil sectors collectively made up less than 12% of export value.

In Q4 2024, more than 98% of exports and 90% of imports were transported through maritime
Key Takeaways:
  • Maritime transport dominated Nigeria’s international trade in Q4 2024, accounting for 98.79% of total exports and 90.15% of total imports.
  • Air transport contributed significantly to imports (9.03%) but played a minimal role in exports (0.64%).
  • Road and other transport modes made negligible contributions to both imports and exports.
  • Total trade across all transport modes reached ₦36.6 trillion, resulting in a positive trade balance.

Over 80% of Nigeria’s imports in 2024 came from manufacturing and oil products
Key takeaways:
  • Manufactured goods accounted for 44.2% of Nigeria’s total imports.
  • Petroleum products (excluding crude oil) made up 38% of the import value.
  • Raw materials represented 11% of the total import value.
  • Agricultural imports contributed 6.2% to the overall import value.
  • The total import value stood at ₦60.59 trillion in 2024, from ₦30.86 trillion in 2023.
  • The energy resources sector made a negligible amount in import value, while no record was made for the crude oil sector.

The United States imported over $5.7 billion in goods from Nigeria in 2024, with mineral fuels and oils accounting for 93%
Key Takeaways:
  • Mineral fuels and oils dominated the US' imports from Nigeria, totalling $5.28 billion.
  • Total US imports from Nigeria reached $5.70 billion in 2024.
  • Non-oil sectors contributed approximately $423 million to the total US imports from Nigeria.
  • US imports from Nigeria cut across 70 distinct product categories.
  • The average value across all import categories was $81.4 million.
  • The top 10 imported goods made up 99.1% of the total imported value.

POPULAR TOPICS
SIGN UP TO OUR NEWSLETTER
Get periodic updates about the African startup space, access to our reports, among others.
Subscribe Here
Subscription Form

A product of Techpoint Africa. All rights reserved