Abuja residents pay ₦880 extra for diesel compared to Kogi​

Key takeaways:

  • Diesel prices in Adamawa skyrocketed by 92.77%, the most significant year-on-year increase nationwide, more than 4x the national average.
  • Many northern states, including Plateau (72.12%), Benue (60.57%), and Kano (54.76%), experienced steep diesel cost increases, intensifying regional cost disparities.
  • States like Gombe (-10%), Edo (-9.68%), and Kogi (-6.29%) bucked the national trend, offering some relief from rising energy costs.
  • The Federal Capital Territory recorded the highest absolute diesel price in the country.
  • Some states, such as Akwa Ibom (+2.17%) and Ebonyi (+2.23%), saw minimal changes.
  • Despite being a commercial hub, Lagos recorded one of the lowest diesel prices at ₦1,222.22, with a relatively small increase of 5.21%.

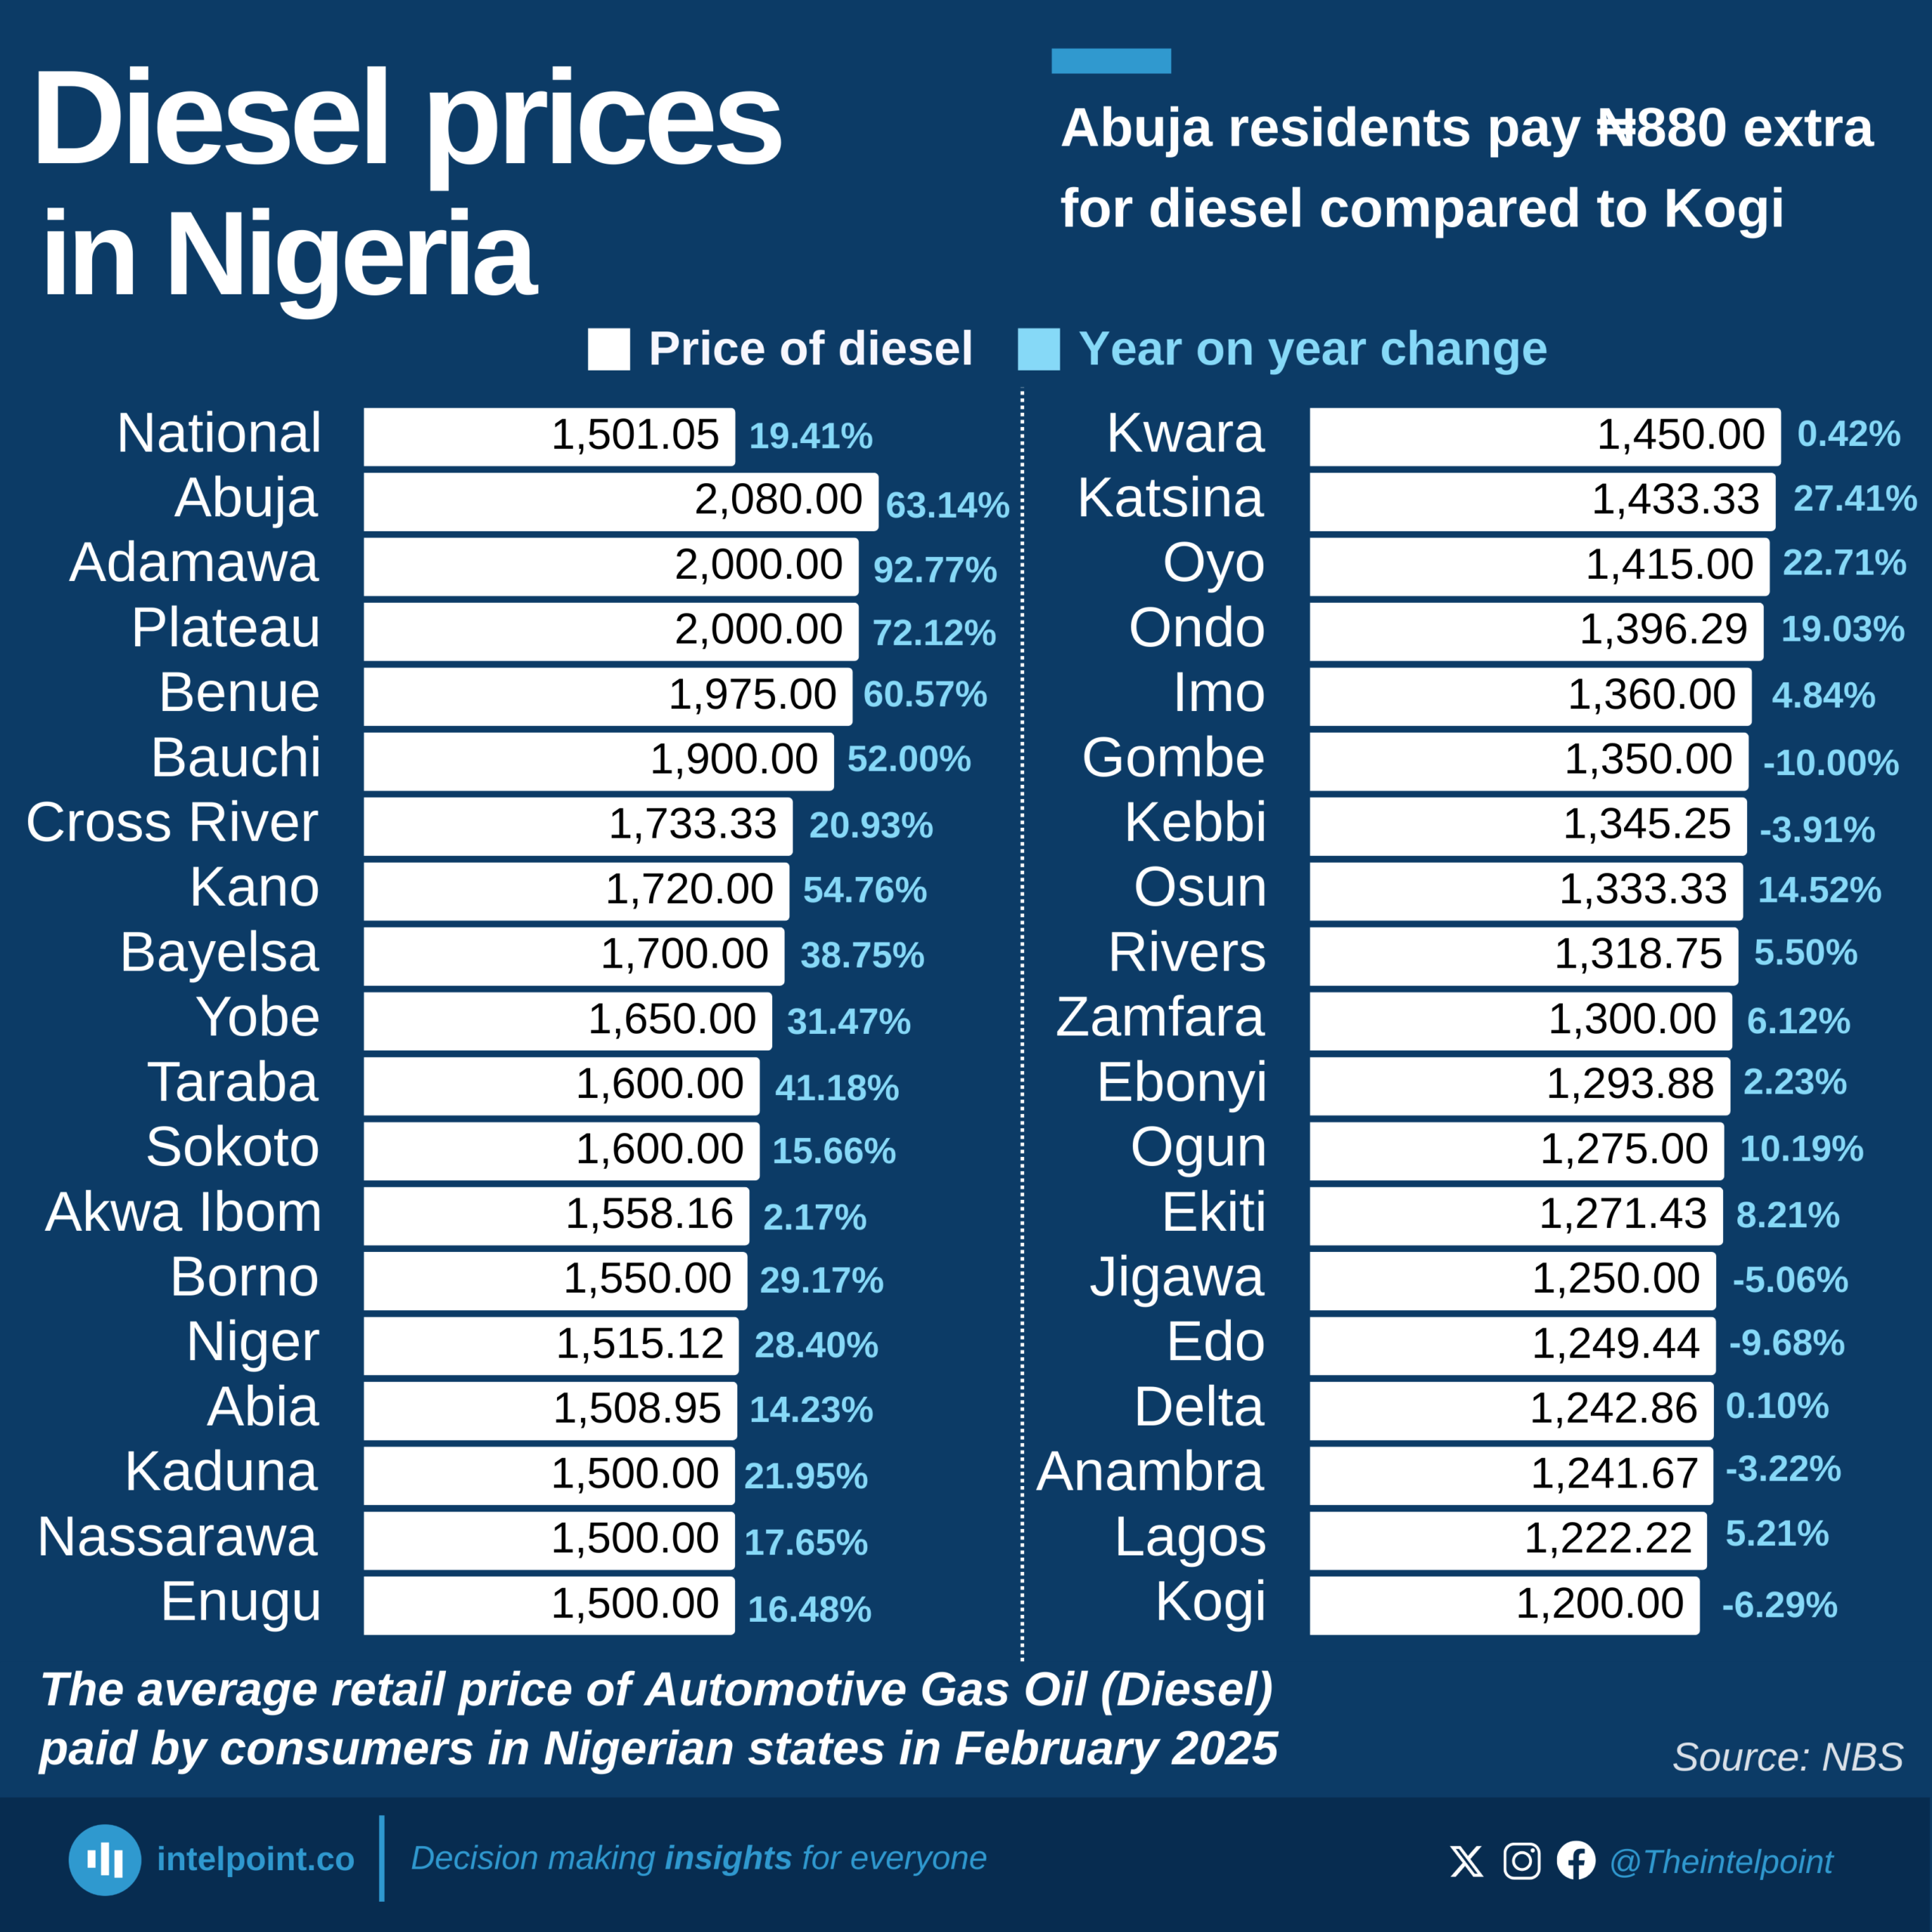
Diesel prices across Nigerian states have shown a range of changes over the past year, with some states seeing sharp increases and others recording declines. Nationally, the average diesel price rose by 19.41% between February 2024 and February 2025, reaching ₦1,501.05 per litre. However, this average masks major state-by-state disparities. States like Adamawa (+92.77%), Plateau (+72.12%), and Benue (+60.57%) saw massive surges, while places like Gombe (-10.00%), Edo (-9.68%), and Kogi (-6.29%) recorded significant drops.

Source:

NBS

Period:

2025
HTML code to embed chart
Want a bespoke report?
Reach out
Tags
Related Insights

South Africa dominates Africa's battery energy storage pipeline, with over three times the capacity of Egypt, the next largest market
  • South Africa dominates with 30 battery storage systems, the largest by far.
  • Egypt is the second-largest market with 7 projects, while Morocco has 4.
  • Nigeria and Senegal have five projects each (operational + pipeline).
  • Several countries, including Ghana, Togo, Angola, Botswana, DR Congo, and Mauritius, each have just one or two projects, indicating an uneven spread across the continent.
  • South Africa also leads in systems under construction (7).
  • Operational projects are still limited continent-wide, with most systems either under construction or in the planning pipeline.

Nigeria’s urban electrification has stalled below 90% for over three decades
  • Urban electricity access has remained between 80% and 89% since 1990, never crossing to 90%.
  • The inability to achieve universal access suggests that infrastructure expansion has struggled to keep pace with rapid urbanisation and population growth.
  • Periodic dips in access, such as in 2010 and 2015, point to challenges in maintaining consistent electricity supply rather than just extending connections.
  • Insufficient generation, outdated grids, and policy inefficiencies have constrained Nigeria’s ability to deliver reliable and universal electricity access even in its urban centres.

Only one in three rural Nigerians have access to electricity after three decades of progress
  • Rural electricity access increased from just 4% in 1990 to about 33% in 2023, showing gradual progress over three decades.
  • The data reveals irregular jumps in certain years—such as 2003, 2011, and 2016—likely tied to temporary electrification programmes or revised data estimates. D
  • espite improvements, nearly two-thirds of rural Nigerians still lack electricity, underscoring a wide disparity in energy access across regions.
  • The slow rate of expansion highlights ongoing issues with investment, grid extension, and maintenance that continue to limit rural electrification efforts.

Nigeria’s renewable energy capacity held steady at 2.1–2.3 GW from 2015 to 2021, then surged from 2022 onward
  • Nigeria’s renewable energy capacity grew from 2.1 GW in 2015 to 3.7 GW in 2024.
  • This represents a 76% increase over the decade.
  • The compound annual growth rate (CAGR) was 5.7% between 2015 and 2024.
  • From 2015 to 2020, capacity was stagnant at around 2.2 GW.
  • The biggest growth year was 2022, with a sharp 34.9% increase.
  • Capacity stagnated in 2023 at 3.1 GW before climbing again in 2024.
  • Nigeria’s renewable growth remains modest compared to its population size and energy demand.

From 2015 to 2024, Morocco's renewable capacity grew from 2.4 GW to 4.0 GW, a 67% increase
  • Morocco’s renewable energy capacity grew from 2.4 GW in 2015 to 4.0 GW in 2024.
  • This represents a 67% increase over the decade.
  • The compound annual growth rate (CAGR) was 5.3% between 2015 and 2024.
  • Capacity was stagnant at 2.4 GW from 2015 to 2017 before growth resumed.
  • The biggest single-year increase happened in 2022, with a 13.7% jump.
  • Capacity additions slowed in 2023 (3.7 GW) and 2024 (4.0 GW).

From 2015 to 2024, South Africa's renewable energy capacity more than tripled, from 3.4 GW to 13.5 GW
  • South Africa’s renewable energy capacity grew from 3.4 GW in 2015 to 13.5 GW in 2024.
  • The country recorded a CAGR of 14.7% over the period.
  • The biggest annual growth was in 2016, when capacity surged by 49.2%.
  • Stagnation occurred in 2021 (0.8% growth) and 2023 (0.0%), reflecting project delays or policy issues.
  • The most recent increase was in 2024, when capacity rose to 13.5 GW, showing renewed momentum.
  • South Africa’s renewable energy capacity is more than three times Nigeria’s 3.7 GW in 2024.

POPULAR TOPICS
SIGN UP TO OUR NEWSLETTER
Get periodic updates about the African startup space, access to our reports, among others.
Subscribe Here
Subscription Form

A product of Techpoint Africa. All rights reserved