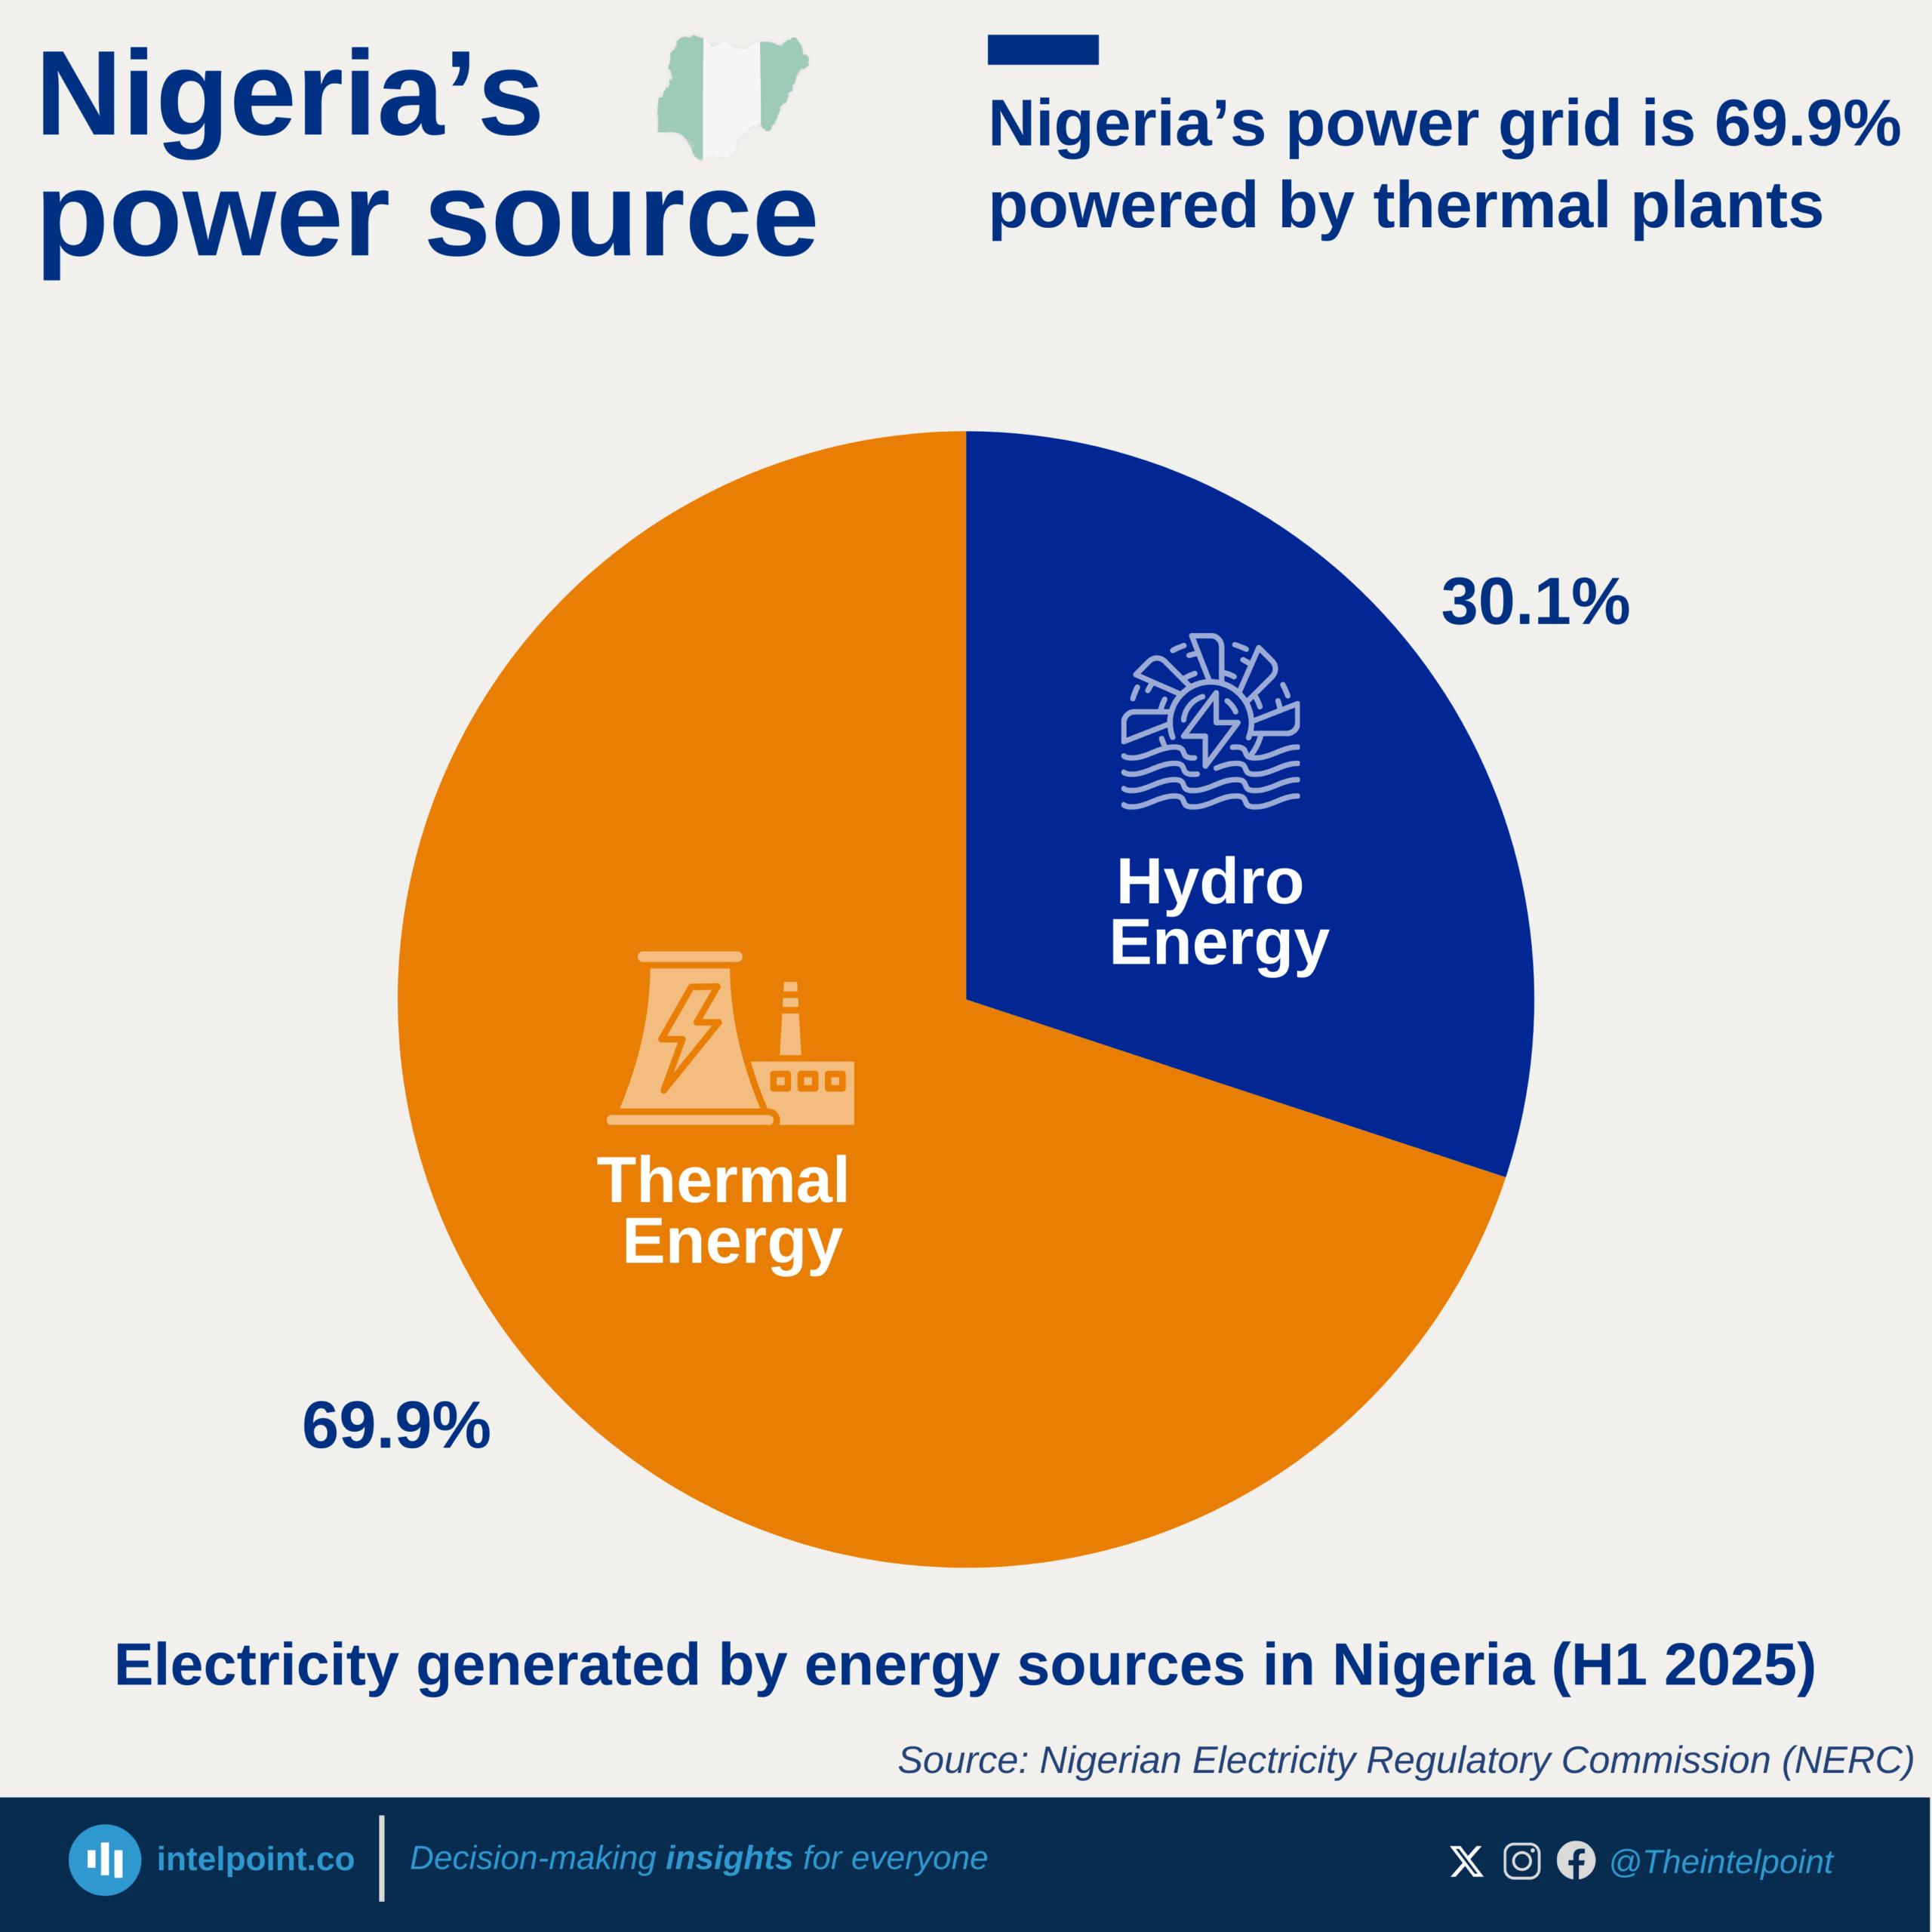
Nigeria’s power grid is 69.9% powered by thermal plants

Key Takeaways

  • Thermal energy dominates Nigeria’s grid, supplying 69.9% of total power.
  • Hydro plants contribute 30.1%, making them the country’s second major source.
  • The heavy reliance on thermal generation shows Nigeria’s grid is still largely fossil-fuel driven.
  • Hydro remains a crucial but secondary source, supporting overall supply stability.

Nigeria’s electricity generation is mainly thermal, accounting for 69.9% of total supply, reflecting the country’s dependence on fossil-fuel-based plants for grid stability. Hydro power contributes 30.1%, providing an important complementary source that supports national generation levels. Together, both sources shape Nigeria’s power mix.
Source:

Nigeria Electricity Regulatory Commission (NERC)

Period:

H1 2025
HTML code to embed chart
Want a bespoke report?
Reach out
Tags
Related Insights

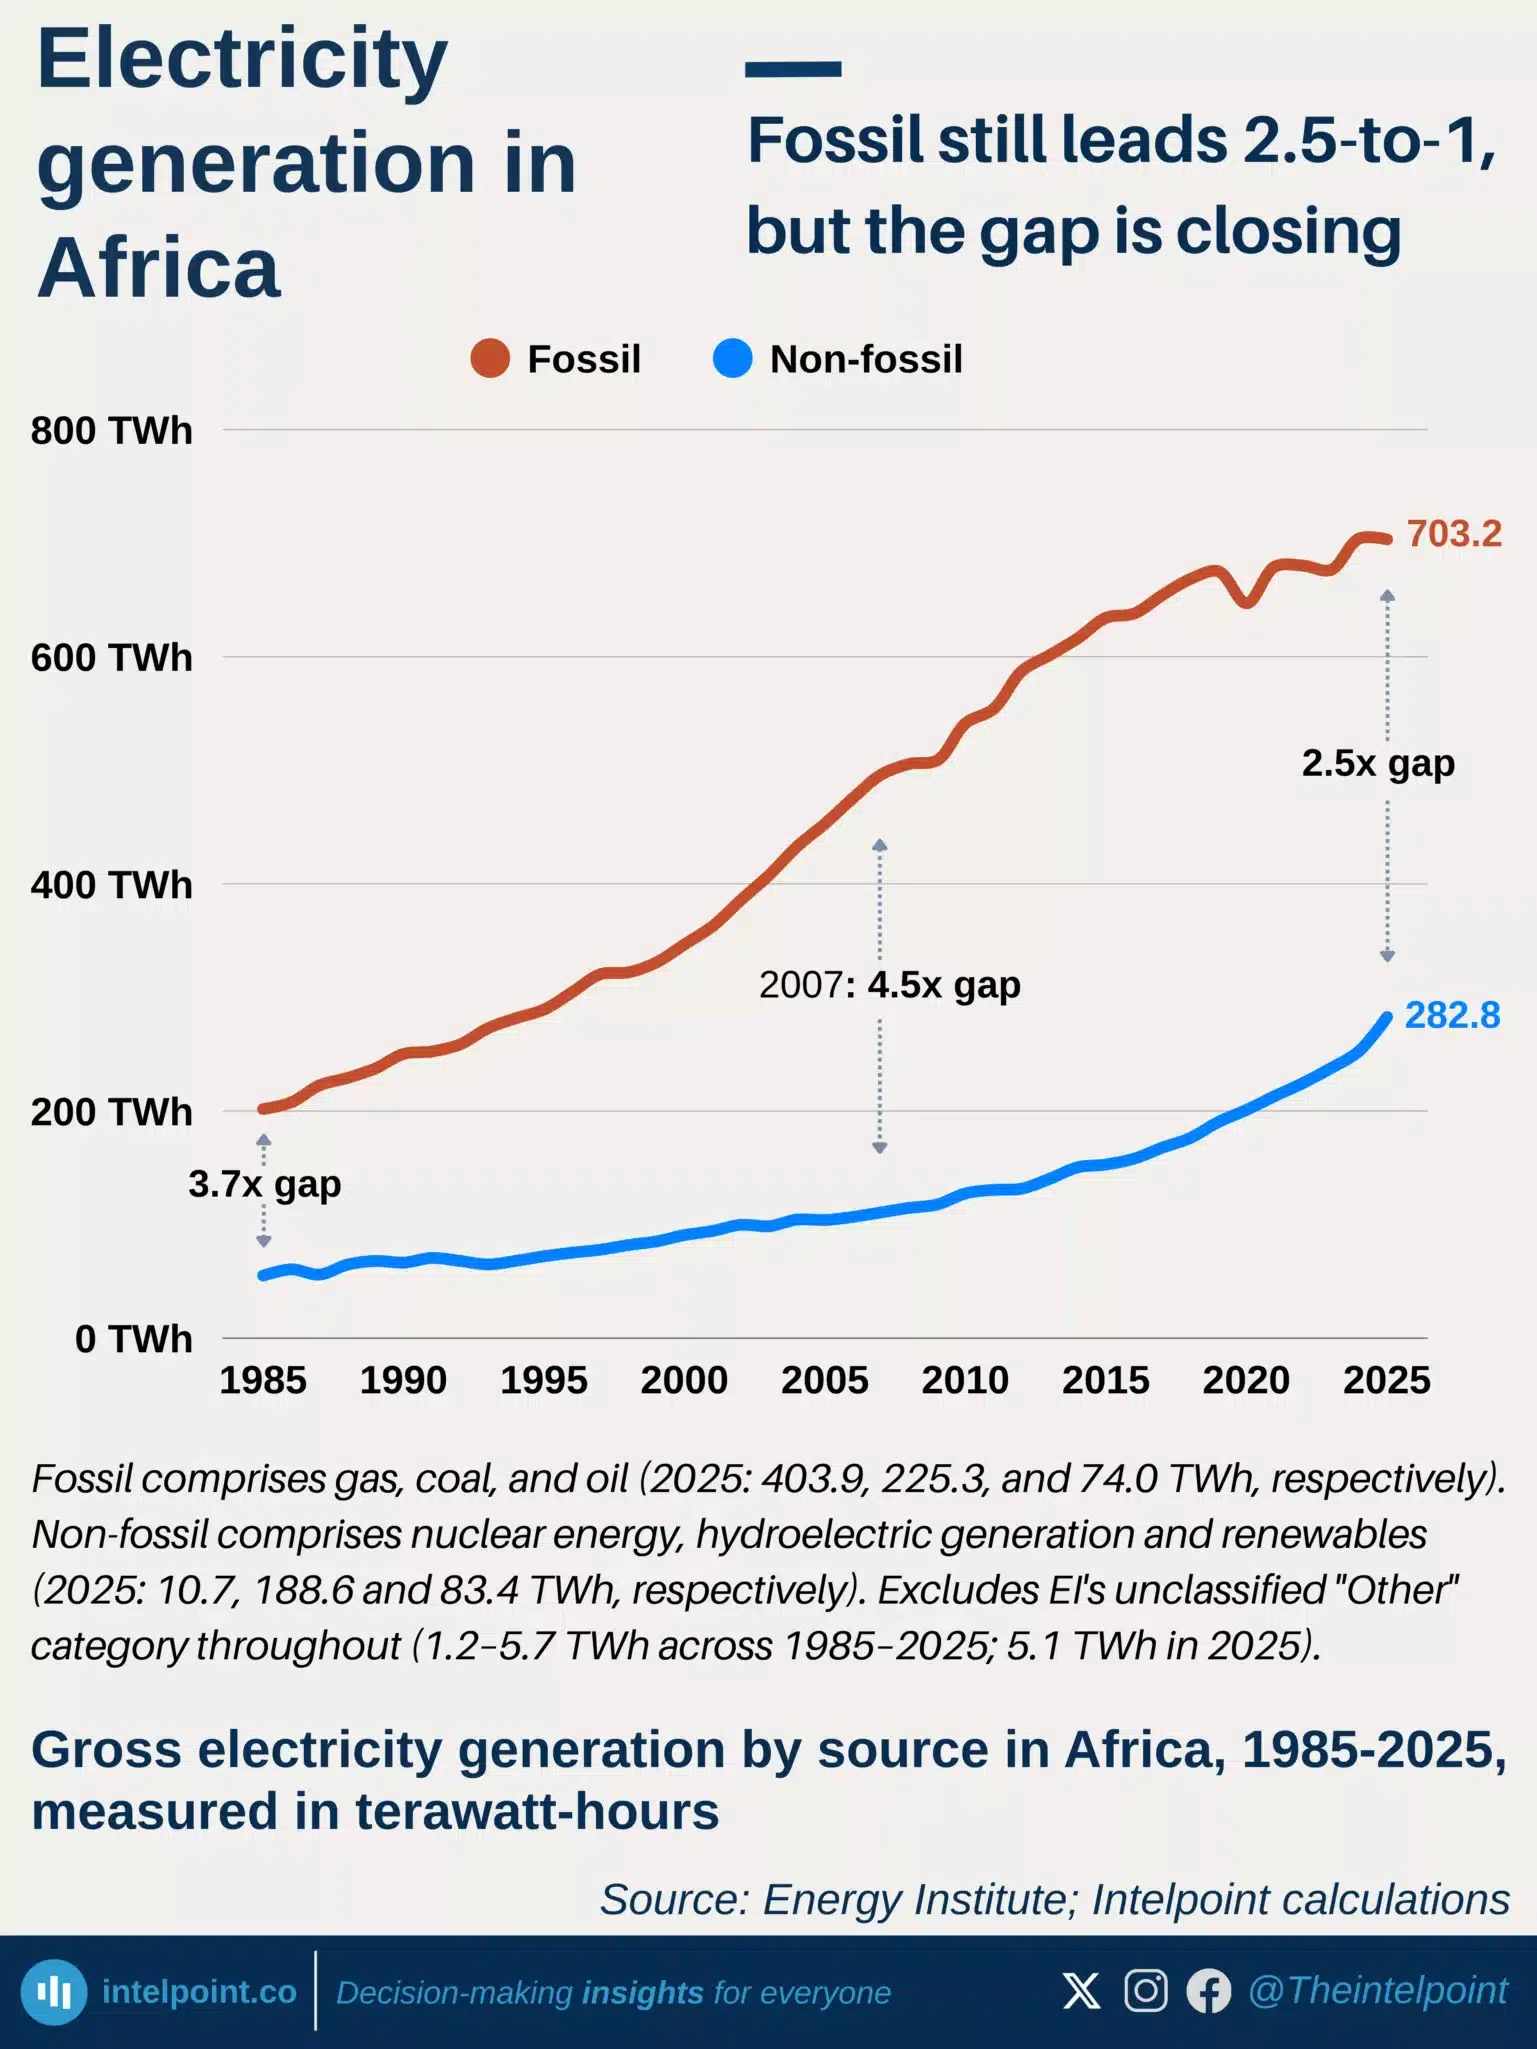
Electricity generation in Africa: fossil still leads 2.5-to-1, but the gap is closing
  • Fossil fuels still generate 2.5x more electricity than non-fossil sources, though the gap has narrowed from a 2007 peak of 4.5x.
  • South Africa and Egypt together account for all of Africa's nuclear power and 59% of its non-hydro renewables.
  • Hydropower, the largest non-fossil source at 188.6 TWh, tells a different geographic story, with 91% generated outside South Africa and Egypt, mainly in Eastern, Middle, and Western Africa.
  • Gas still leads at 403.9 TWh, but its growth slowed to 0.8% in 2025 versus 11.9% growth for non-fossil sources.

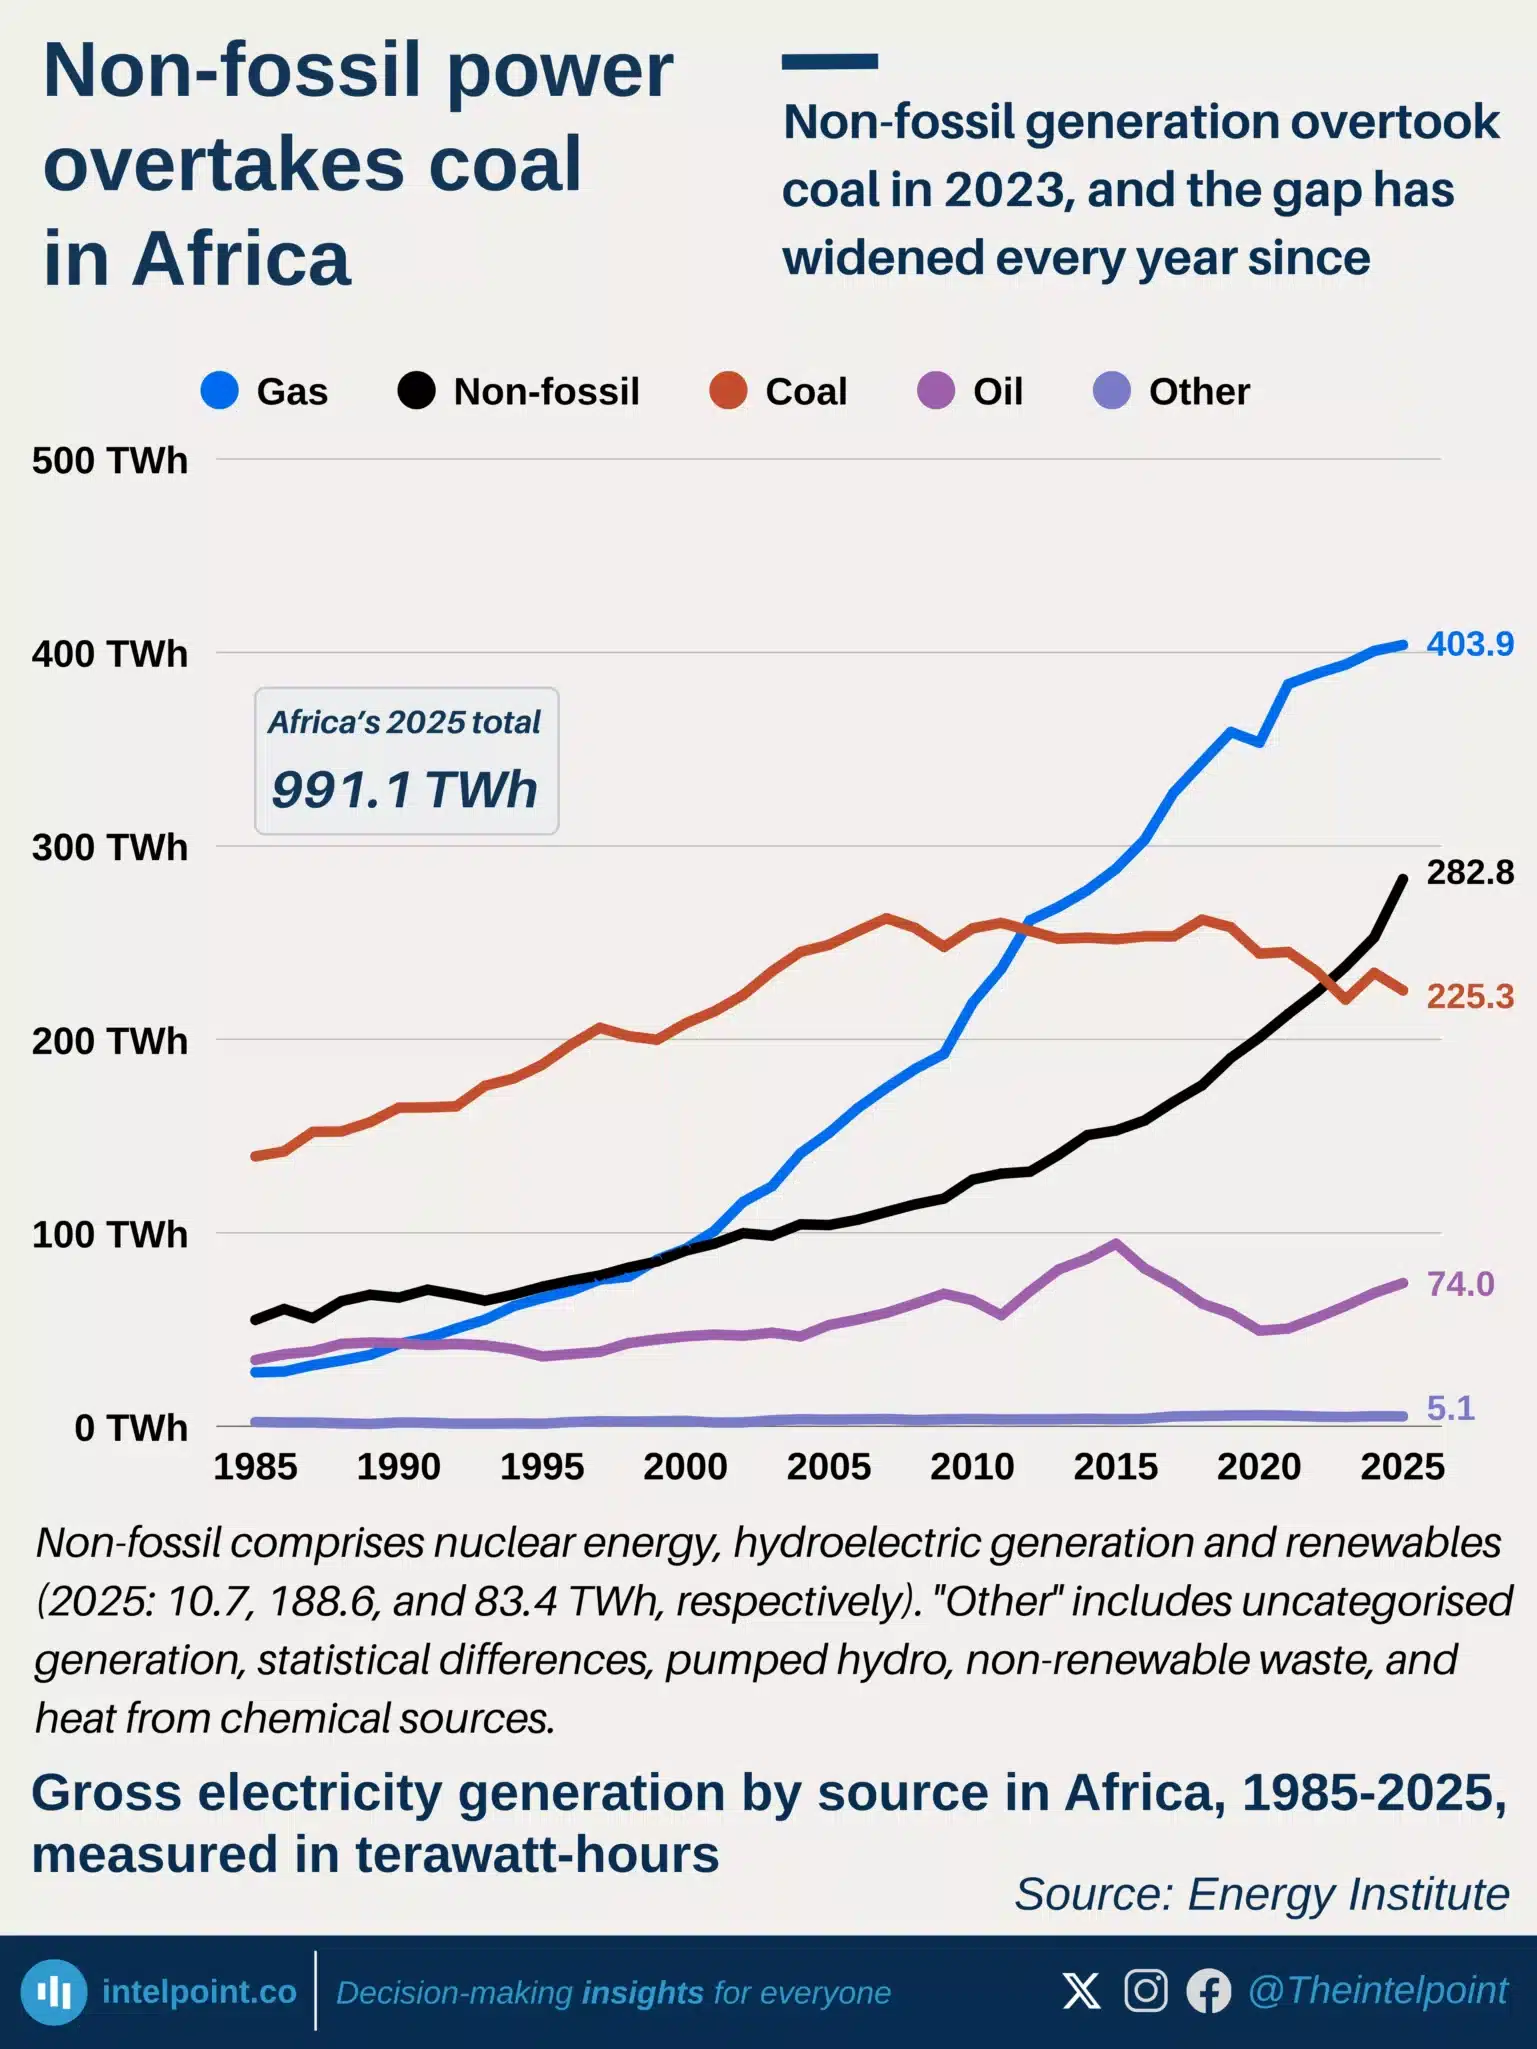
Non-fossil generation overtook coal in 2023, and the gap has widened every year since
  • Non-fossil generation overtook coal in 2023, with the gap reaching 57.5 TWh in 2025.
  • Coal generation fell to 225.3 TWh, below its 262.6 TWh peak in 2007.
  • Hydropower dominates non-fossil generation, producing 188.6 TWh in 2025.
  • Fossil fuels still dominate, generating 703.2 TWh versus 282.8 TWh from non-fossil sources.

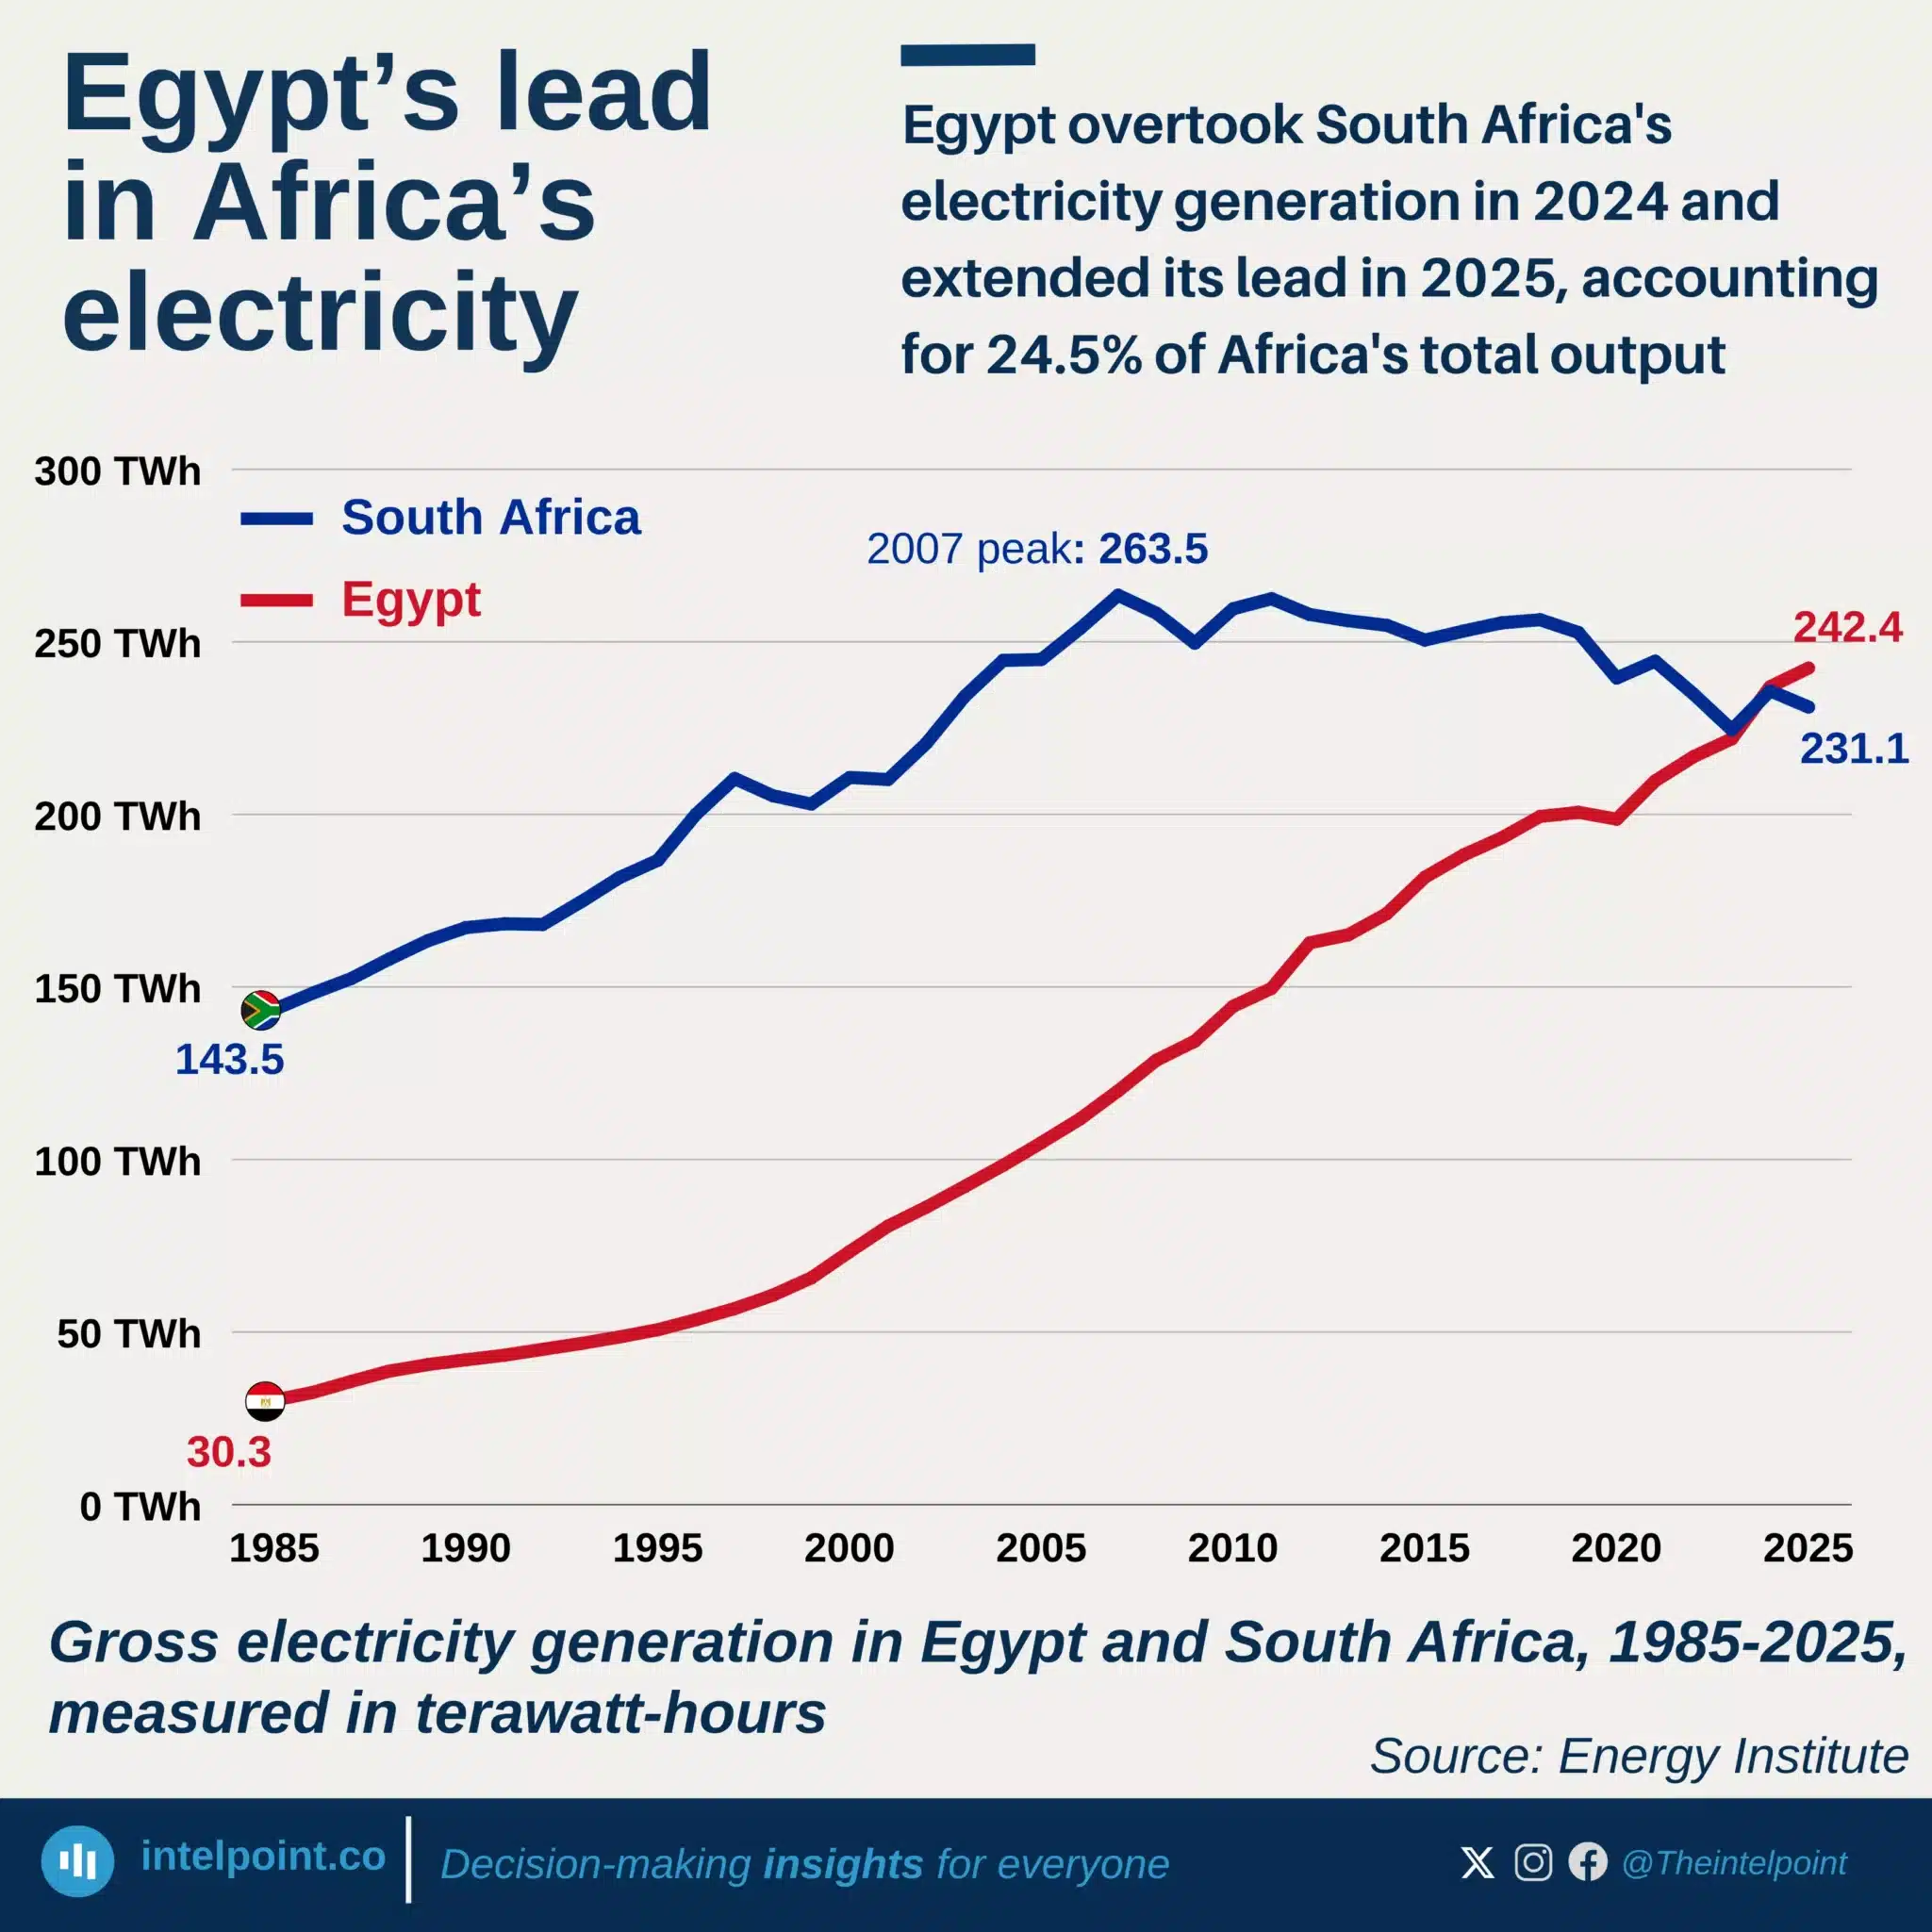
Egypt overtook South Africa's electricity generation in 2024 and extended its lead in 2025
  • Africa’s share of global electricity generation rose only from 2.6% in 1985 to 3.1% in 2025.
  • Africa’s electricity generation increased 283% over the past 40 years.
  • Egypt overtook South Africa as Africa’s largest electricity producer in 2024.
  • Egypt generated 242.4 TWh in 2025, up from 30.3 TWh in 1985.
  • South Africa generated 231.1 TWh in 2025, down from its 263.5 TWh peak in 2007.
  • Egypt and South Africa accounted for 24.5% of Africa’s electricity generation in 2025.

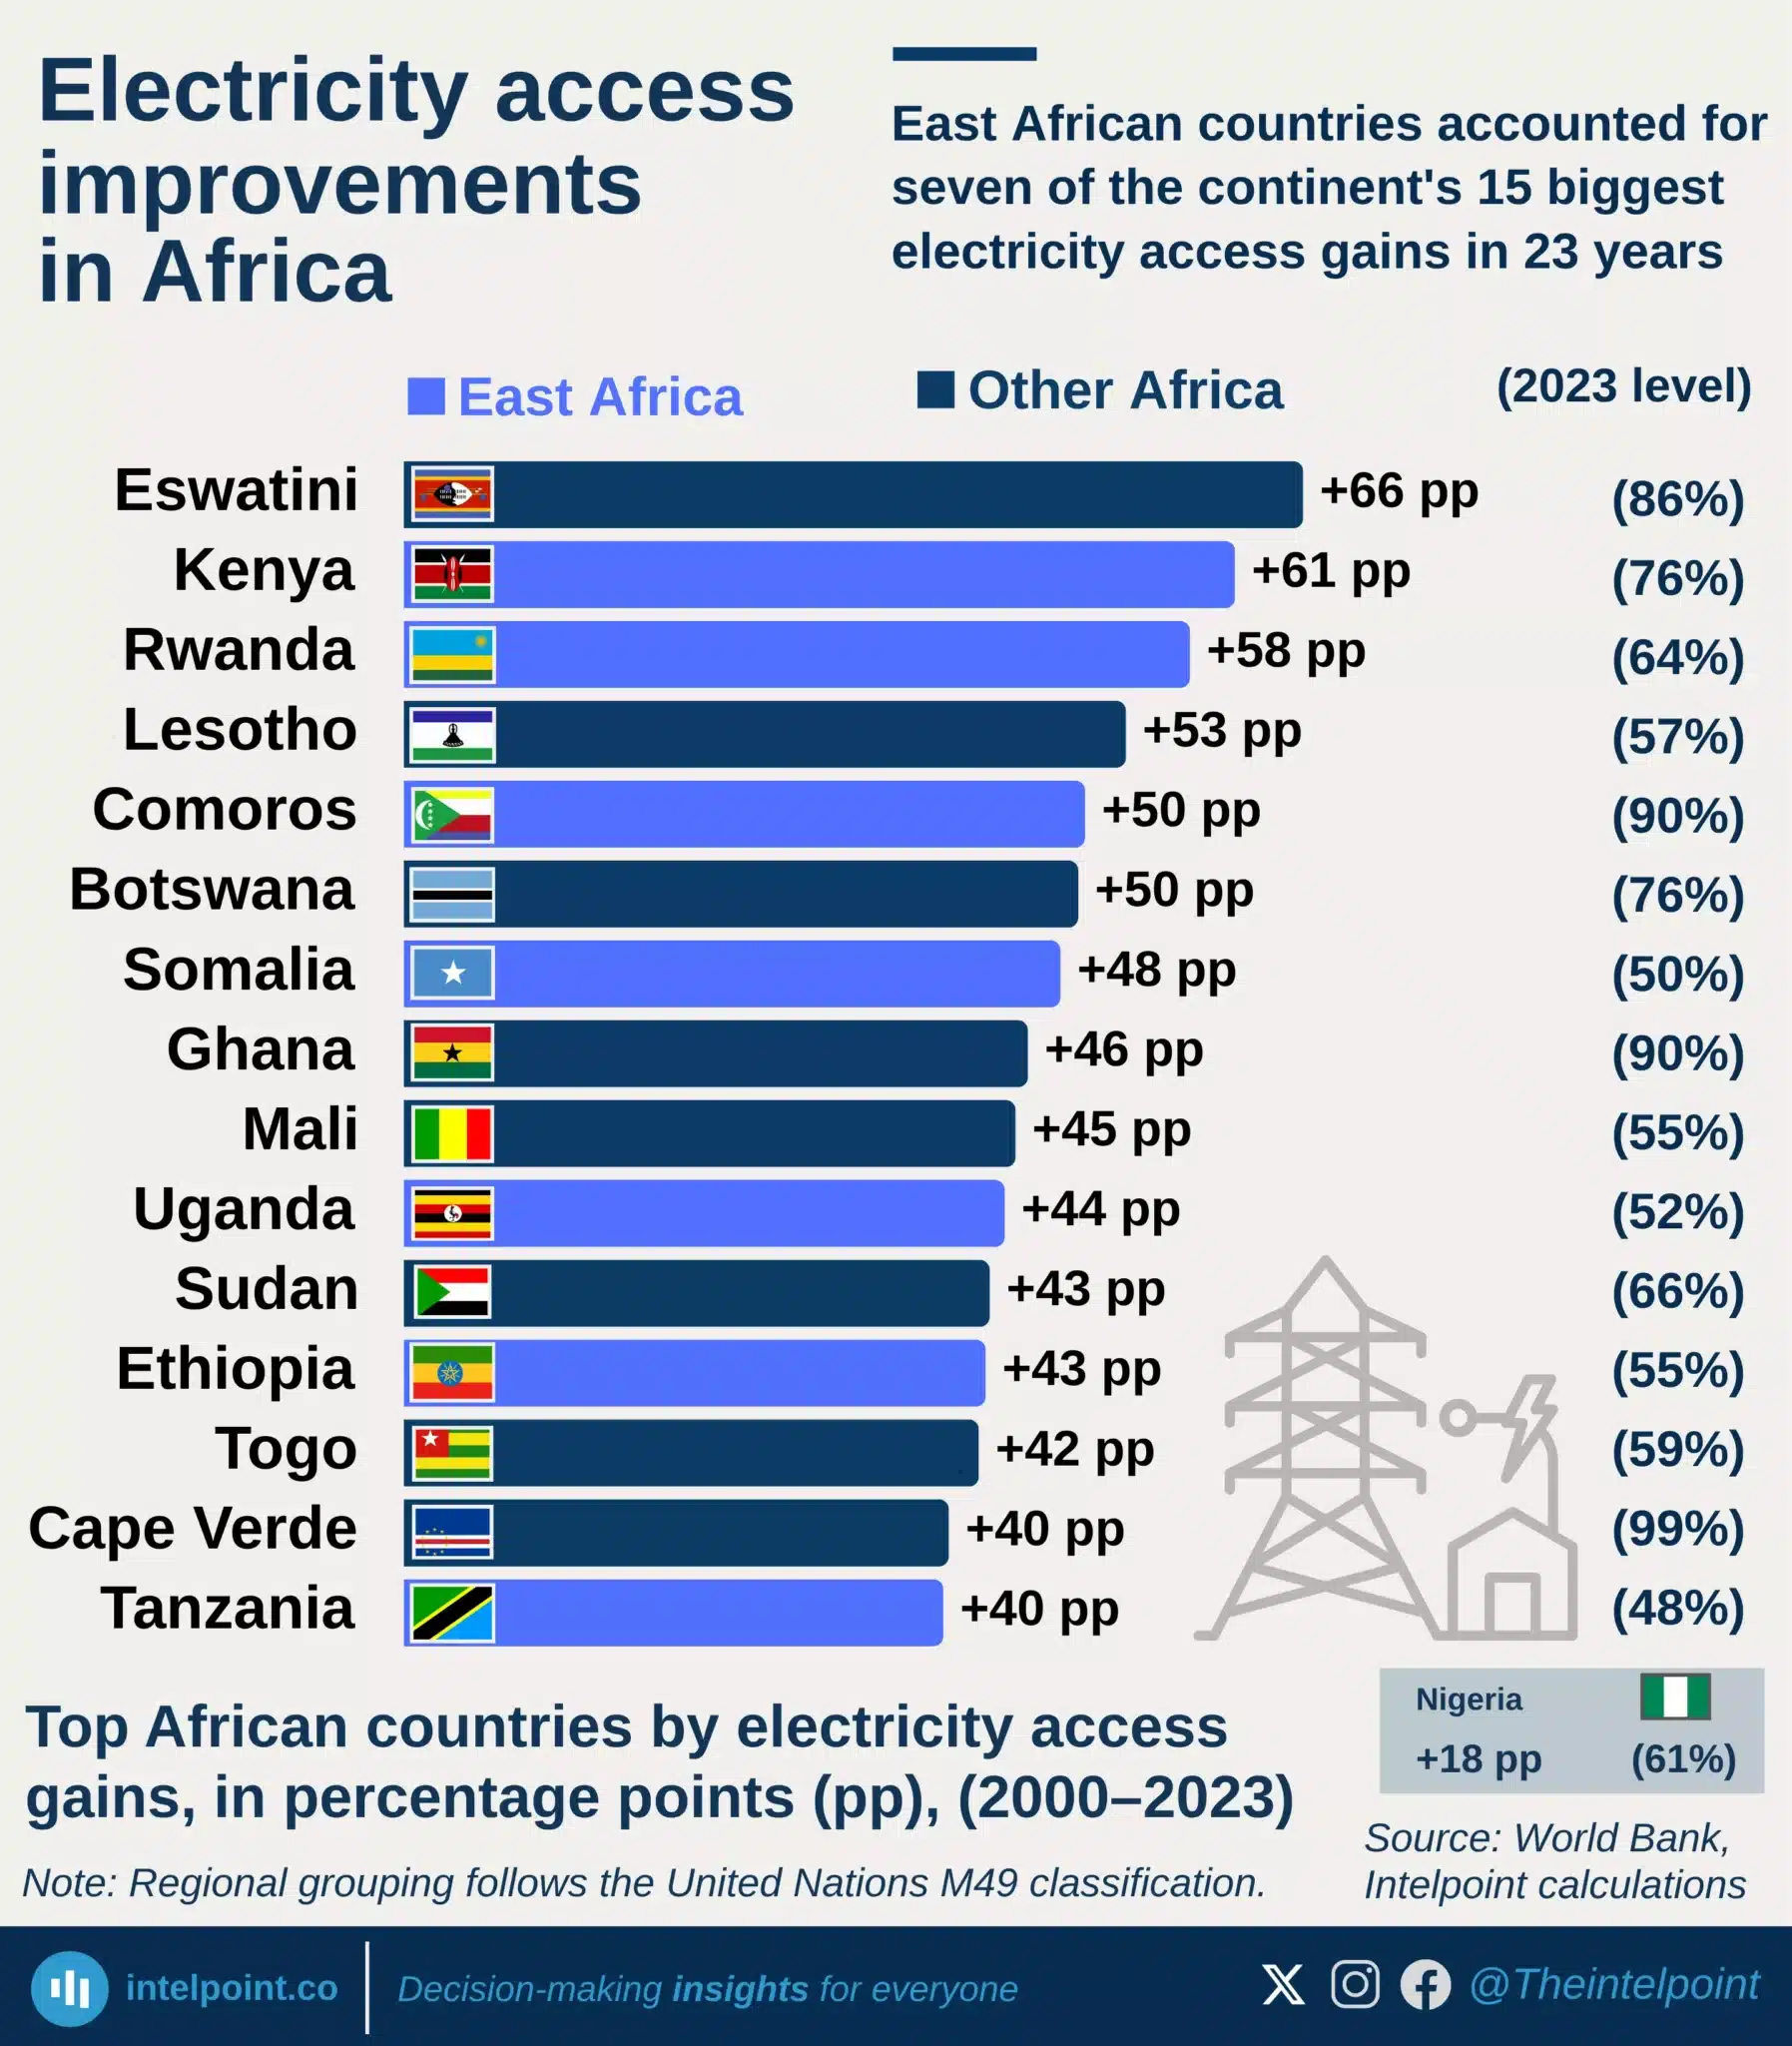
East African countries accounted for seven of the continent's 15 biggest electricity access gains in 23 years
  • Eswatini recorded Africa’s largest electricity access gain, rising by 66 percentage points from 2000 to 2023.
  • Kenya and Rwanda followed with gains of 61 pp and 58 pp, respectively.
  • East African countries accounted for 7 of Africa’s top 15 electricity access improvements.
  • Comoros, Ghana and Cape Verde reached very high access levels by 2023, at 90%, 90% and 99% respectively.
  • Nigeria’s electricity access improved by 18 percentage points, from 43% in 2000 to 61% in 2023.
  • Despite that improvement, Nigeria remained outside Africa’s top 15 gainers over the period.
  • Some countries were absent from the ranking because they had already reached high access levels by 2000.

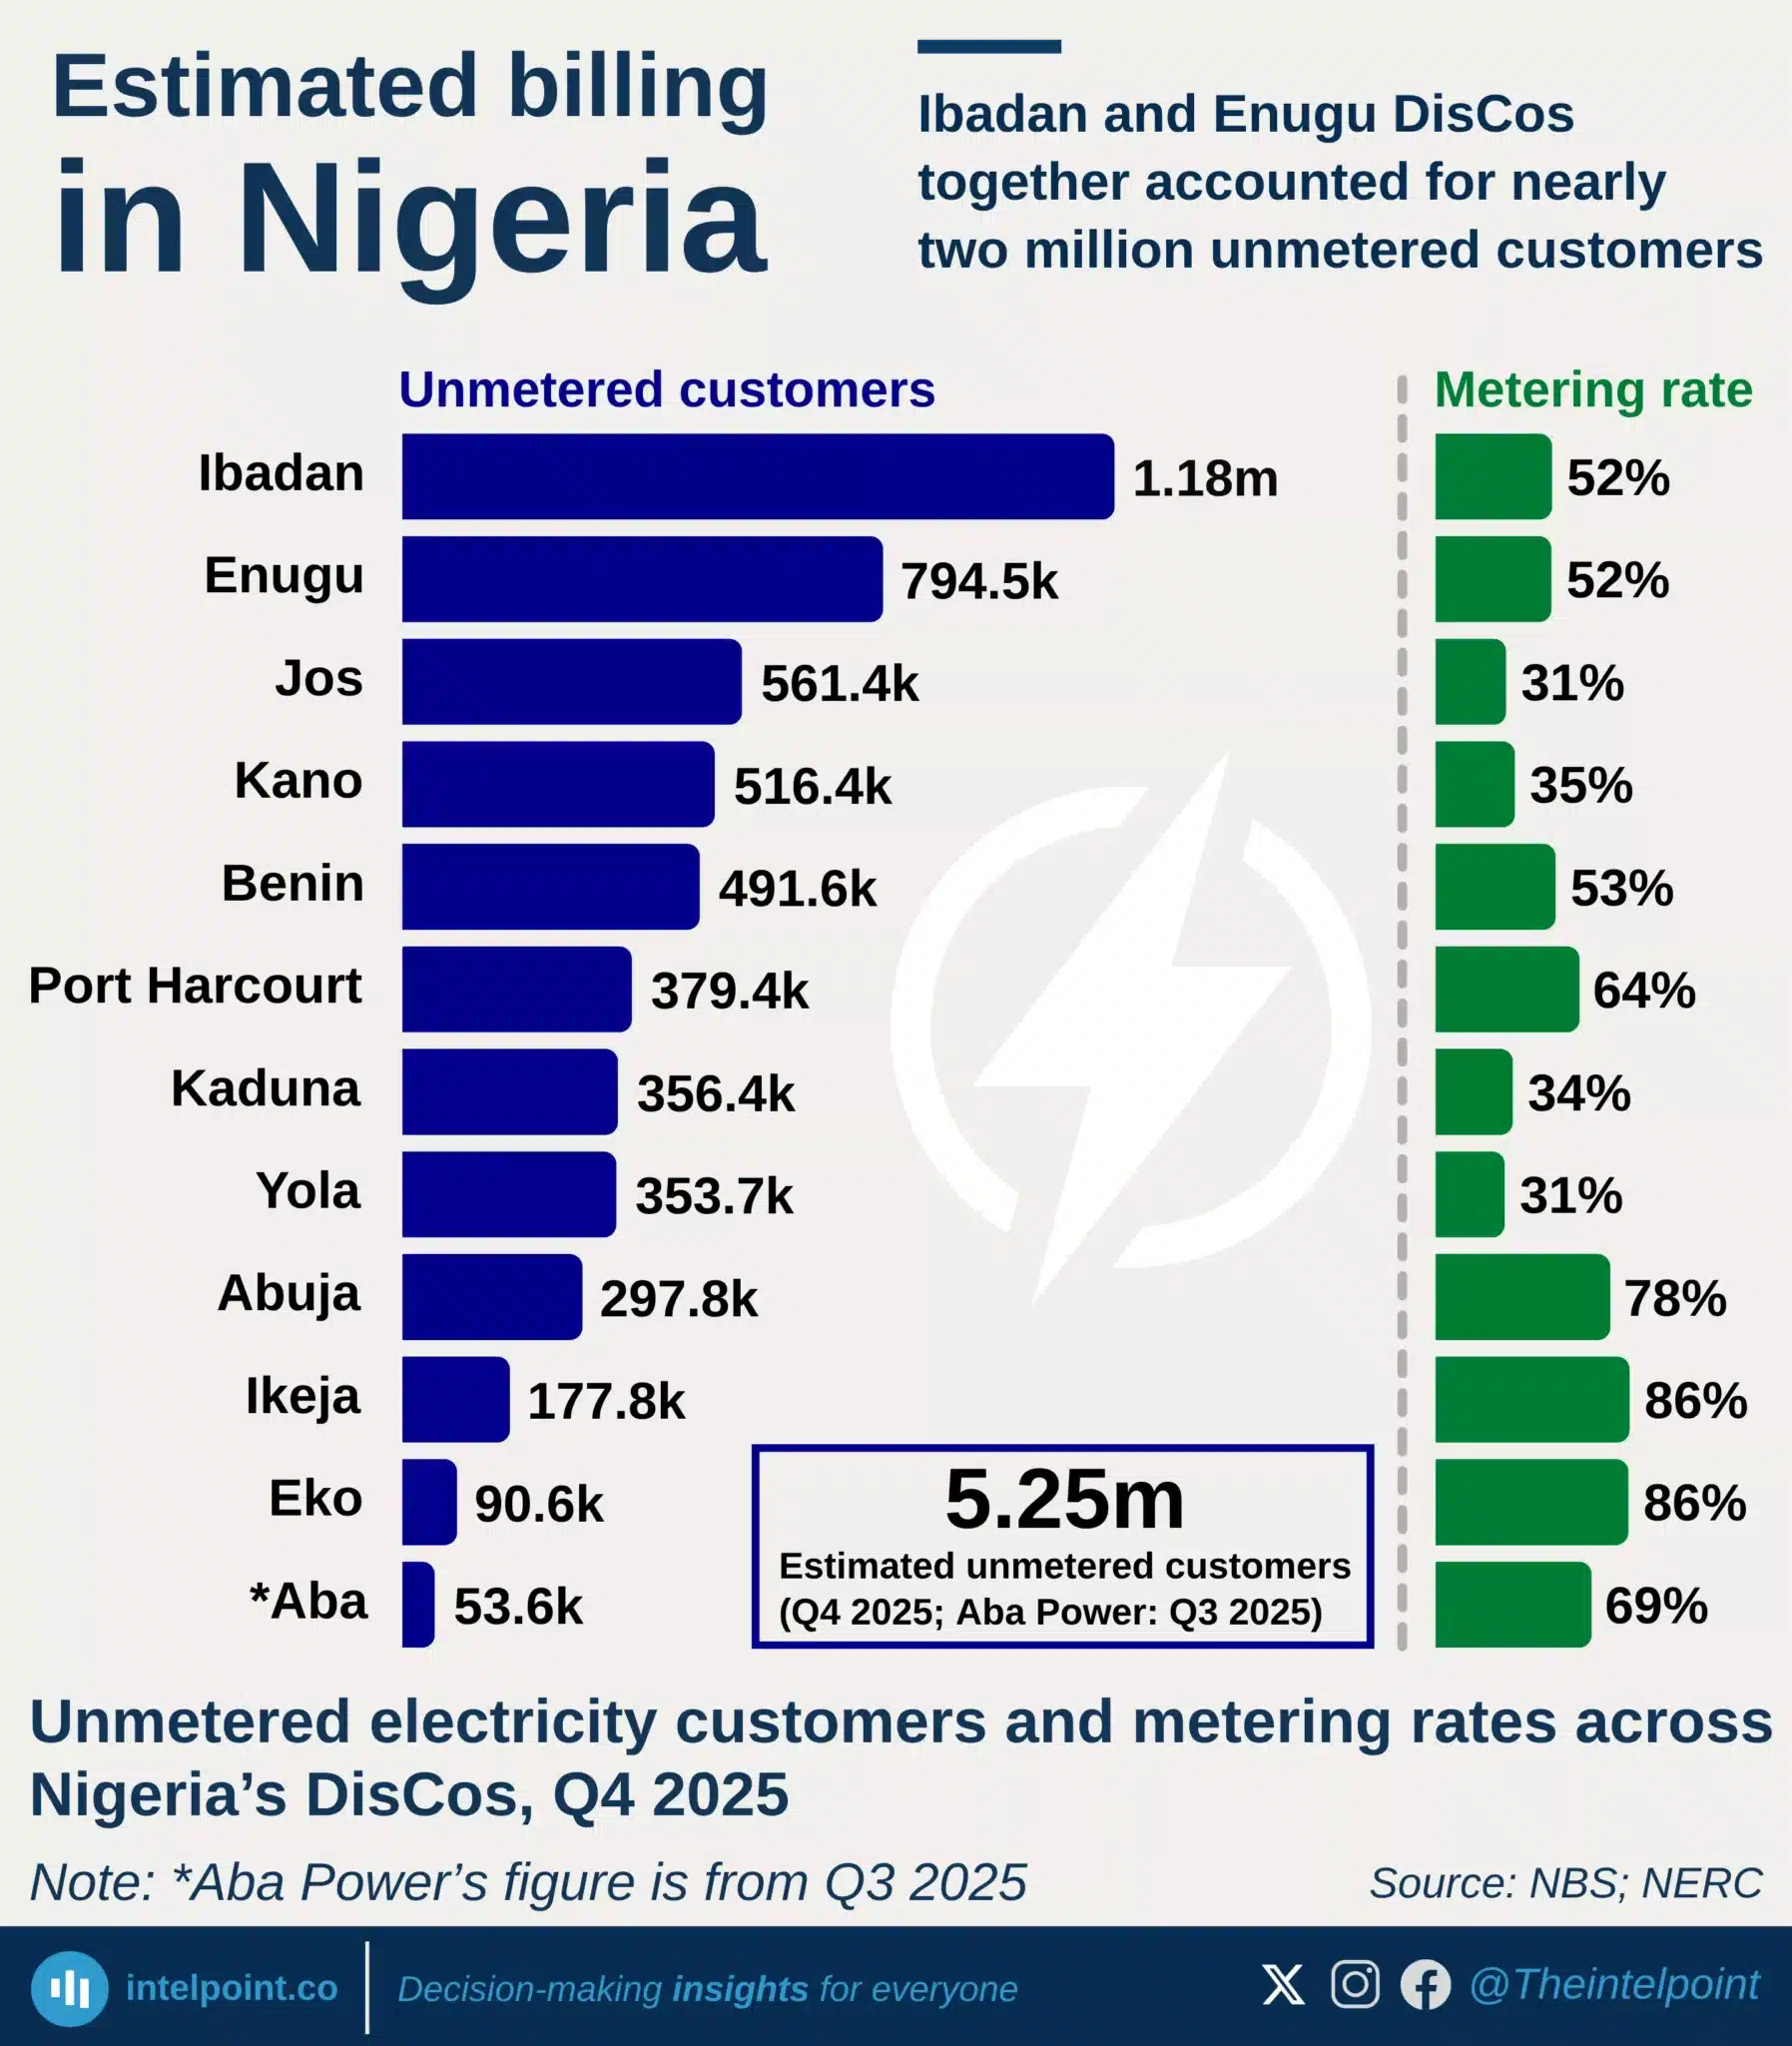
Ibadan and Enugu DisCos together accounted for nearly two million unmetered customers
  • Nigeria still had about 5.25 million unmetered electricity customers across DisCos.
  • The 11 DisCos reported in Q4 2025 had 5.20 million unmetered customers.
  • Nigeria’s reported metering rate stood at 57.3% as of Q4 2025.
  • Ibadan and Enugu had the largest gaps, with nearly two million unmetered customers combined.
  • Ibadan alone had 1.18 million unmetered customers, the highest of any DisCo.
  • Ikeja and Eko had the strongest metering performance, both at about 86%.
  • At the 2025 pace of meter additions, closing the current gap could take close to seven years.

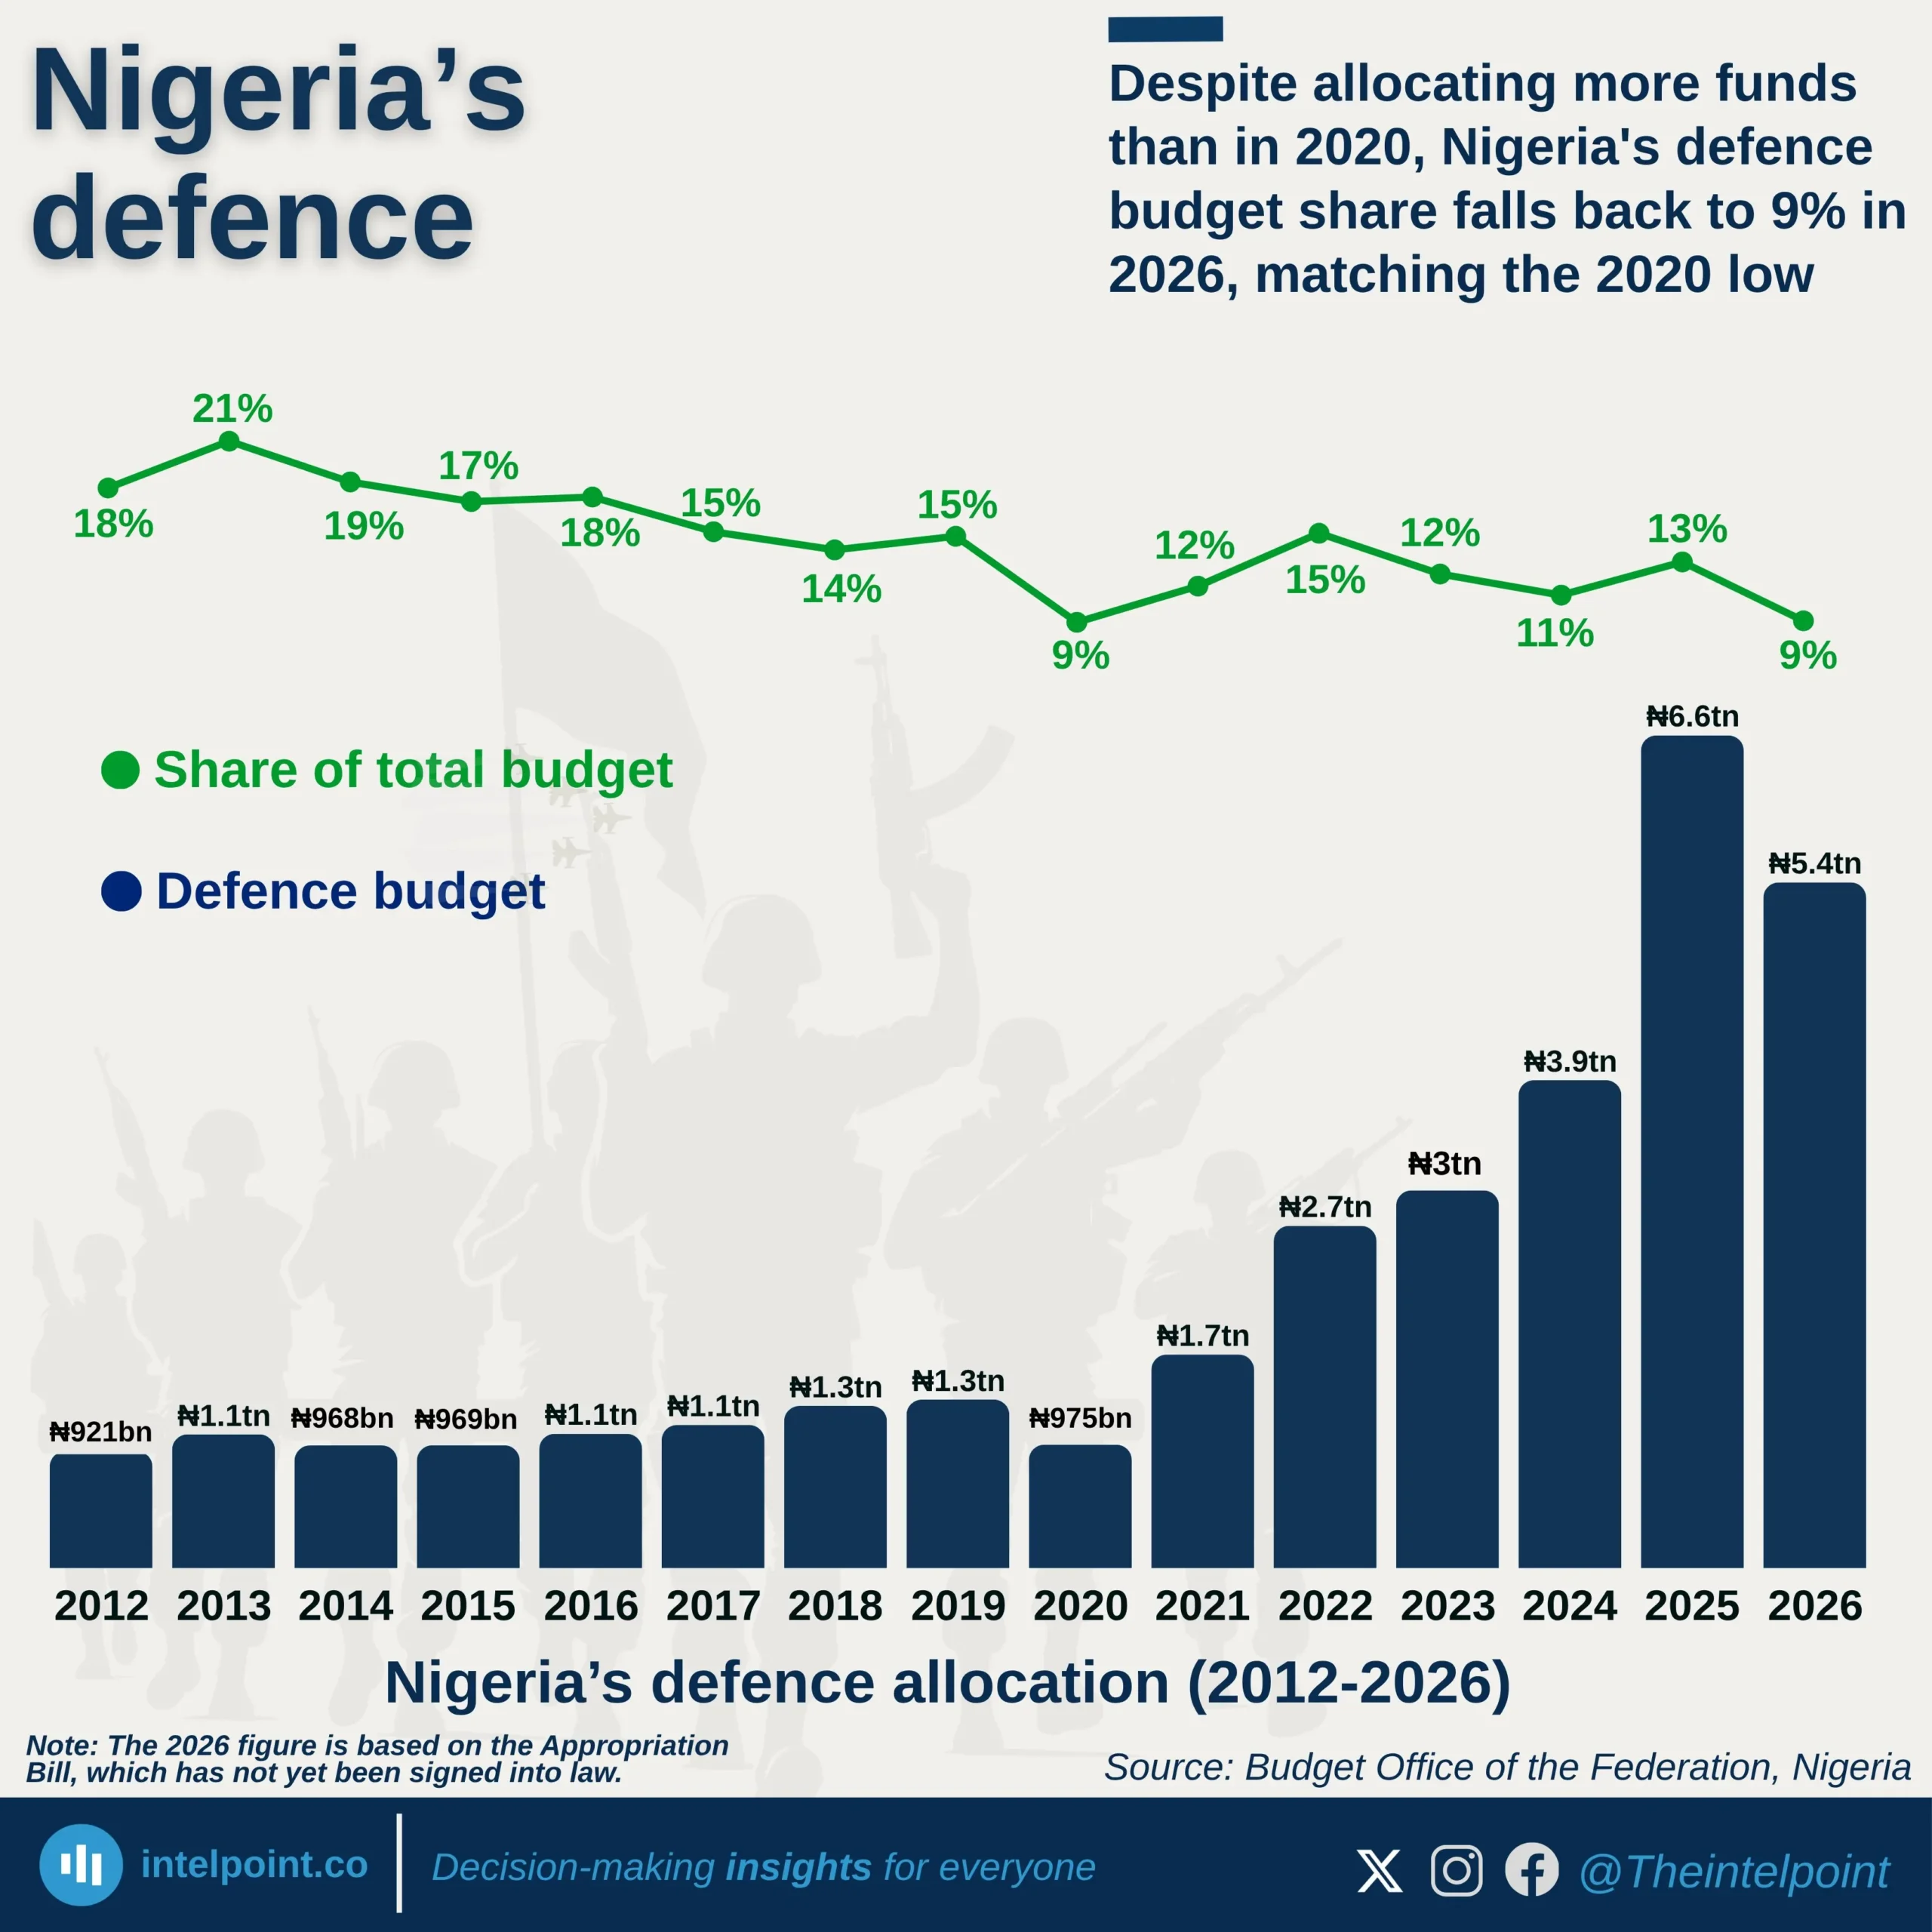
Despite allocating more funds than in 2020, Nigeria's defence budget share falls back to 9% in 2026, matching the 2020 low
  • Nominal spending surged, but inflation and naira depreciation eroded real gains. From ₦921 billion in 2012 to ₦6.57 trillion in 2025, the absolute figure may seem dramatic, but Nigeria's security challenges intensified over the same period.
  • Defence commanded over 21% of the budget in 2013. From 2024 to 2026, that figure has fallen below 14%, with 2026 hitting a historic low of 9.3%.
  • Boko Haram, banditry, and separatist tensions peaked in 2020, resulting in a cut that saw defence's share fall to just 9.2%, the lowest on record at that point.
  • The jump to ₦6.57trn (13.2%) in 2025 marks the sharpest year-on-year absolute increase in the dataset. But 2026 reversed this again, with the rate dropping to 9.3%.

POPULAR TOPICS
SIGN UP TO OUR NEWSLETTER
Get periodic updates about the African startup space, access to our reports, among others.
Subscribe Here
Subscription Form

A product of Techpoint Africa. All rights reserved