Nigeria's FDI hasn't reached $200 million in any quarter Since 2022

Nigeria's FDI has dropped significantly. From an average of $417m per quarter (2013-2015) to less than $100m (Q1 2022 - Q2 2024), it hit its lowest ($29.8m) in Q2 2024.

The trend shows declines since 2013, with key fluctuations and a shift in investment priorities.

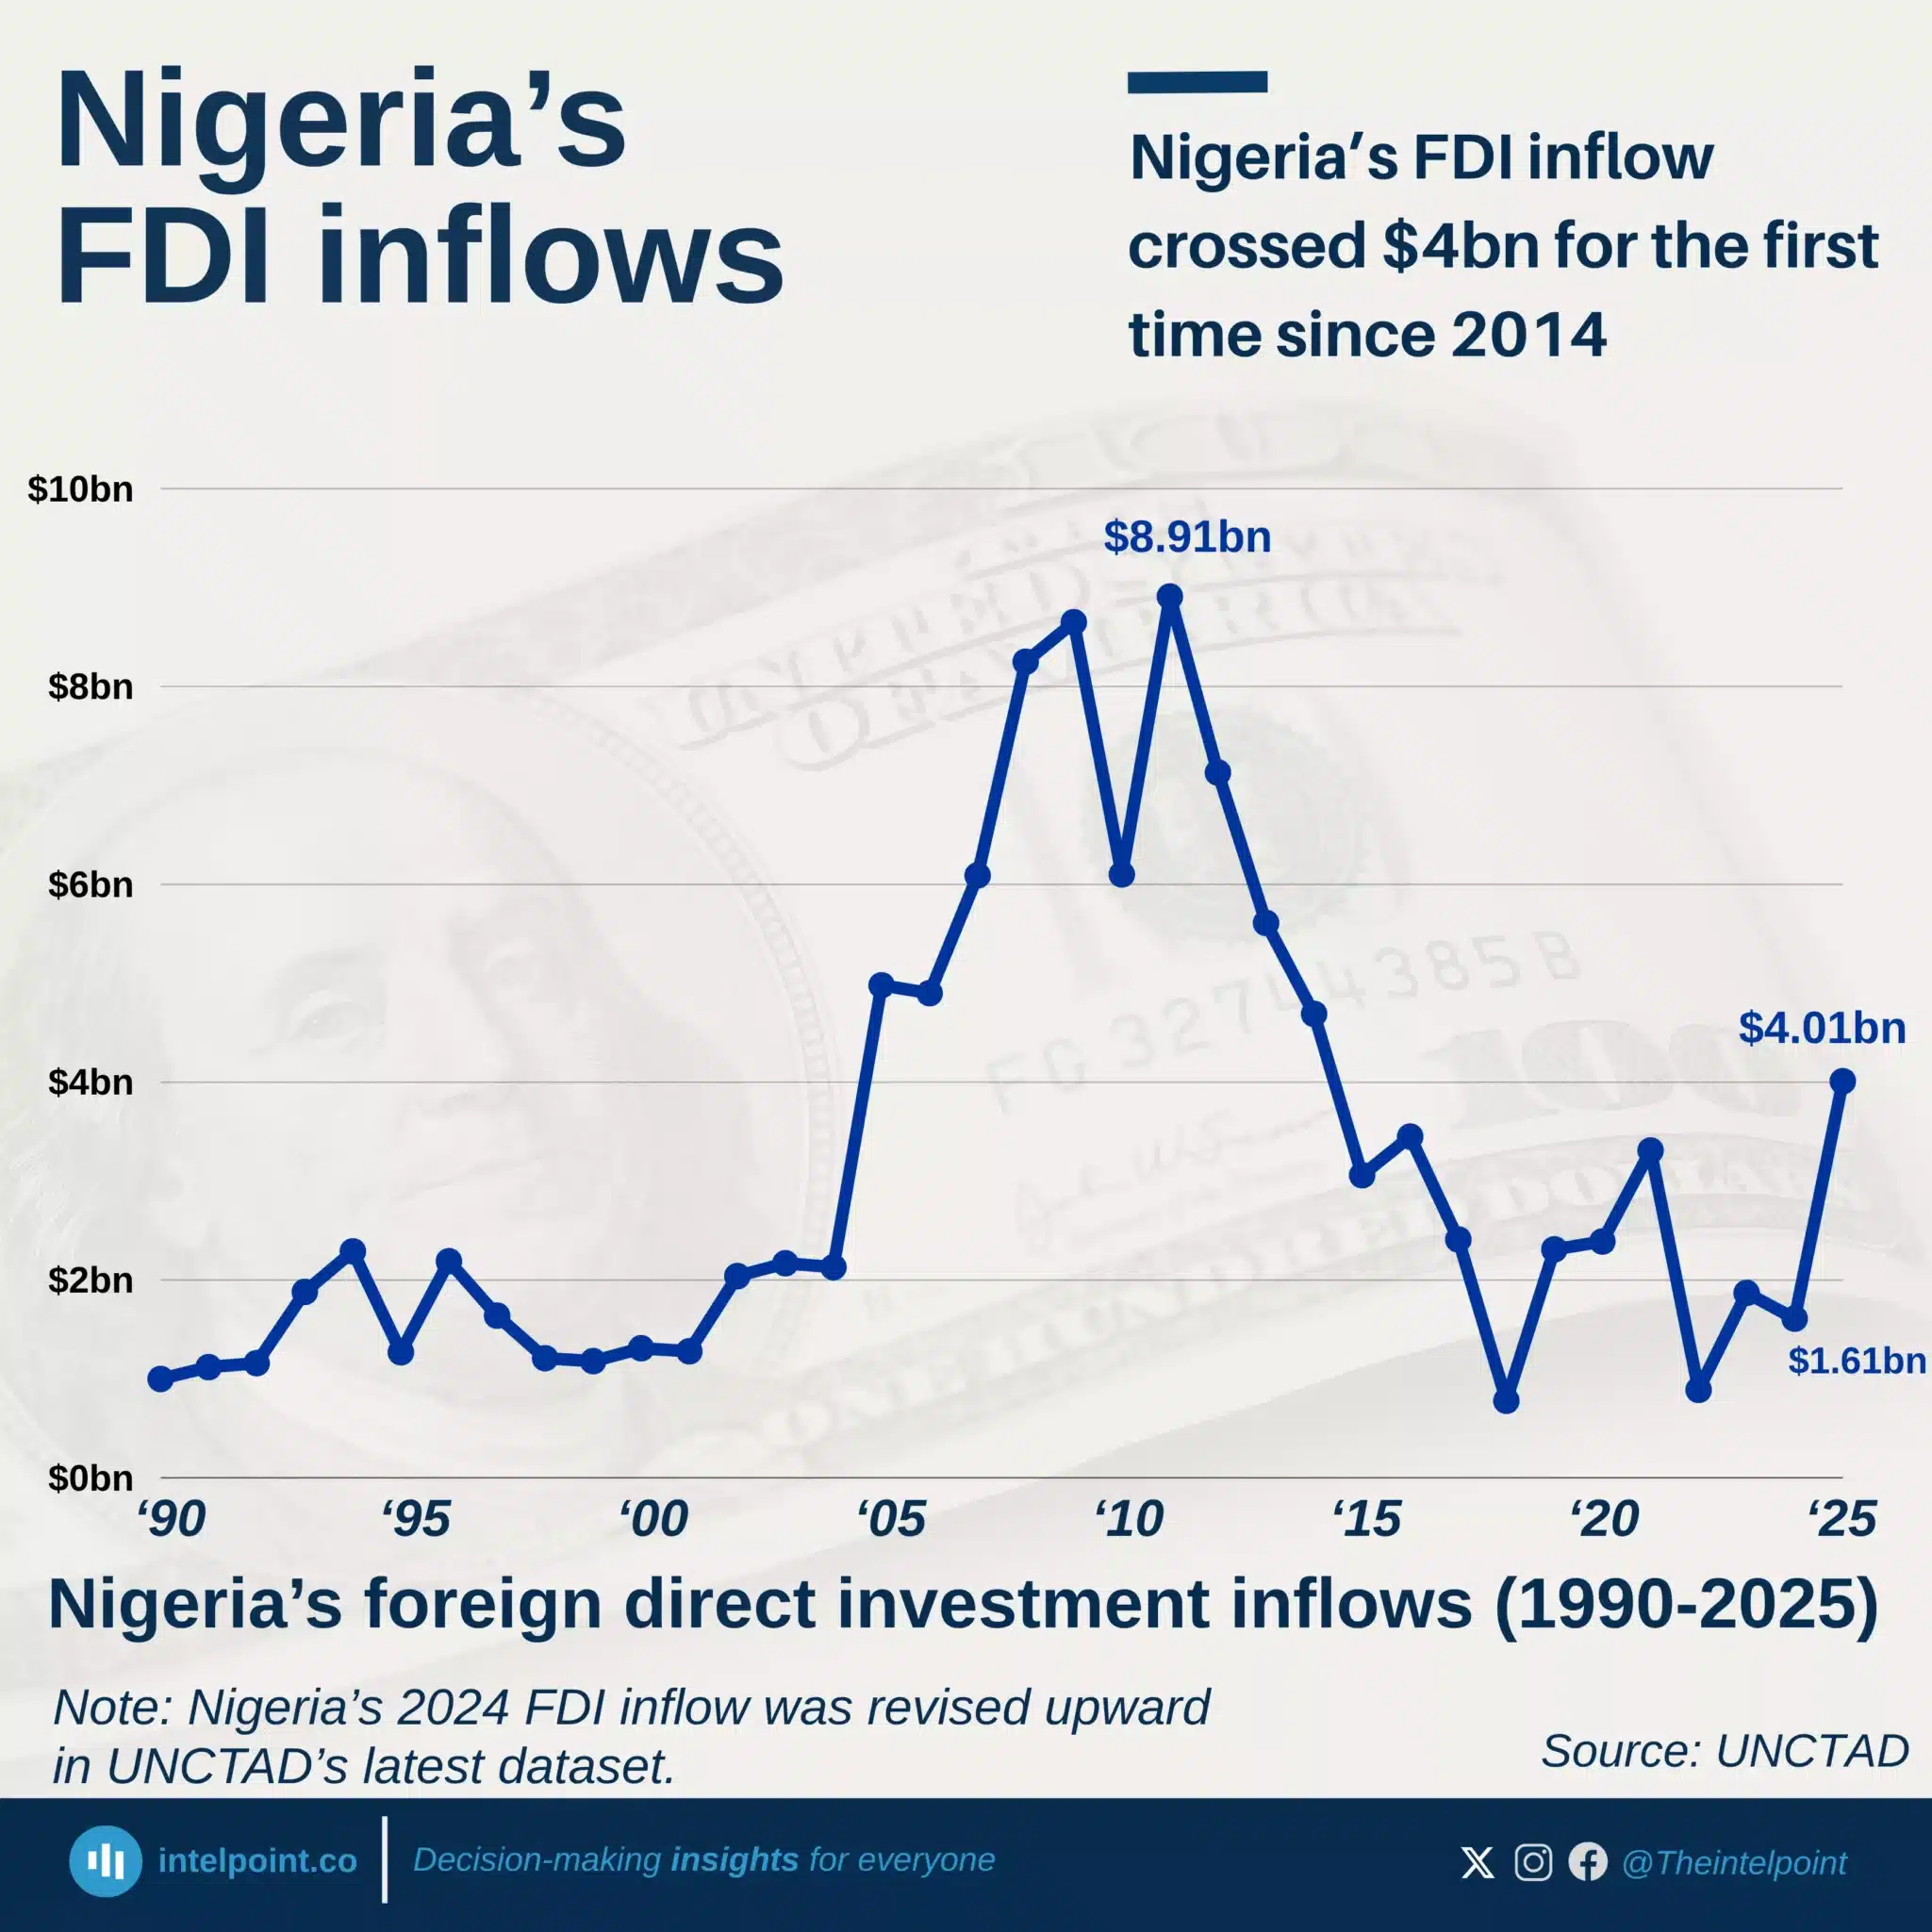
  • 2013-2015: FDI was mostly above $200 million per quarter, peaking at $769 million in Q4 2014.
  • 2016-2021: FDI mostly stayed under $400 million, with a $531 million spike in Q3 2018.
  • 2022-2024: FDI hit new lows, bottoming out at $48 million in Q1 2023 and falling even further to $29.8 million in Q2 2024 — the lowest in 46 quarters.

Source:

National Bureau of Statistics

Period:

Q1 2013-Q2 2024
HTML code to embed chart
Want a bespoke report?
Reach out
Tags
Related Insights

Europe, Asia, and the Americas have attracted a combined 94% of global foreign investment since 1990, leaving Africa and Oceania with just 6%
  • Europe ($12.58 trillion), Asia ($11.88 trillion), and the Americas ($11.49 trillion) are nearly tied after 35 years, each capturing roughly a third of global FDI
  • Asia grew from just $25 billion annually in 1990 to consistently attracting $600-700 billion per year, showing the most stable growth pattern
  • Major crises (2001, 2008-09, 2020, and 2022) caused dramatic swings, with Europe even recording negative flows in 2022
  • Africa and Oceania combined received just 6% of total FDI, remaining far behind despite Africa's recent acceleration to $97 billion in 2024

North Africa was the primary destination for FDI in 2024, attracting 52% of Africa's total FDI inflow
  • Africa attracted $97 billion in total FDI inflows in 2024.
  • North Africa dominated with $51 billion (52%), remaining the continent’s top foreign investment hub.
  • West Africa ranked second with $15 billion (15.3%).
  • East Africa secured $13 billion (13.3%).
  • Central Africa remained the least favoured, with only $8 billion (8.2%) in FDI inflows.

Nigeria’s share of Africa’s FDI collapsed from ~38% in 1994 to barely 1.1% in 2024
  • Nigeria’s FDI share plunged from 35% in 1990 to 1.1% in 2024.
  • Africa’s FDI surged over the same period, leaving Nigeria behind.
  • Q1 2025 inflow was only $126.3 million, showing persistent weakness.
  • Decline mirrors structural hurdles — unstable policies, forex issues, and weak infrastructure.

Nigeria recorded an impressive 822% growth in FDI inflows between 1999 and 2009, before gradually dropping back to $1.1B in 2024
  • FDI inflows in Nigeria peaked at $8.8 billion in 2011, marking the highest point in the Fourth Republic.
  • From 2011 to 2024, FDI inflows dropped, settling at $1.1 billion in 2024.
  • The early Fourth Republic (1999–2011) showed growth in FDI inflows.
  • FDI outflows rose from $0.2 billion in 1999 to $1.5 billion in 2009, reflecting gradual international expansion by Nigerian investors.
  • From 2015 onward, both inflows and outflows showed significant volatility, with no clear recovery trend.

Cape Verde’s FDI averaged over $68M annually over 34 years, with a record $170M in 2008 and a recent 54% drop from 2023 to 2024
  • Cape Verde attracted no foreign direct investment during the early 1990s, signalling limited investor interest at the time.
  • FDI inflows skyrocketed from $130M in 2006 to an all-time high of $170M in 2008, before stabilising above $100M for most of the 2010s.
  • The country experienced large swings, ranging from a high of $150M (2014) to lows of $50M (2020).
  • Despite recovering to $130M in 2023, inflows dropped sharply to $60M in 2024, the weakest figure in over a decade.

Nigeria’s foreign trade
  • Total Trade Volume in Q1 2025 stood at ₦36.02 trillion, with exports totalling ₦20.6 trillion and imports at ₦15.4 trillion, resulting in a surplus of ₦5.17 trillion.
  • Crude oil dominates Nigeria’s export trade, accounting for the largest share of export revenue. -
  • Other petroleum oil products are also a major export item, reflecting the significance of both raw and refined oil-based commodities in Nigeria’s trade portfolio. -
  • On the import side, manufactured goods dominate, showing Nigeria’s continued reliance on foreign machinery, technology, and consumer goods.
  • While Nigeria exports mostly raw and oil-based products, it imports refined, processed, or industrial goods, indicating a structural trade gap and limited local industrial capacity. -
  • Agricultural and raw material goods feature on both sides of trade, but their value is significantly less than petroleum-related trade.

POPULAR TOPICS
SIGN UP TO OUR NEWSLETTER
Get periodic updates about the African startup space, access to our reports, among others.
Subscribe Here
Subscription Form

A product of Techpoint Africa. All rights reserved