Home
Reports
Blog
Insights
About Us
Subscribe
Home
Reports
Blog
Insights
About Us
Export
Top African countries by chocolate export value in 2020
On 2020's World Chocolate Day
, an annual celebration of chocolate, we look at the top 12 African countries with the highest chocolate export value in 2020 -- a combined $421.43m.
Source:
<div style="text-align: center;"><a href="https://intelpoint.co/insights/top-african-countries-by-chocolate-export-value-in-2020/" title="Top African countries by chocolate export value in 2020"><img src="https://intelpoint.co/wp-content/uploads/2024/02/Top-African-countries-by-chocolate-export-value-in-2020.webp" style="width: 80%; height: auto; max-width:960px;-ms-interpolation-mode: bicubic; margin: 0 auto; display: block;" alt="Chart: Top African countries by chocolate export value in 2020"/></a><br><span>Find more insights at <a href="https://intelpoint.co/insights?utm_source=Insight%20Embed&utm_medium=HTML&utm_campaign=Top+African+countries+by+chocolate+export+value+in+2020" target="_blank" style="color: #4f9acc; text-decoration: none;">Intelpoint</a>.</span></div>
Copied to clipboard!
Period:
2020
HTML code to embed chart
Want a bespoke report?
Reach out
Click to copy HTML embed code
<div style="text-align: center;"><a href="https://intelpoint.co/insights/top-african-countries-by-chocolate-export-value-in-2020/" title="Top African countries by chocolate export value in 2020"><img src="https://intelpoint.co/wp-content/uploads/2024/02/Top-African-countries-by-chocolate-export-value-in-2020.webp" style="width: 80%; height: auto; max-width:960px;-ms-interpolation-mode: bicubic; margin: 0 auto; display: block;" alt="Chart: Top African countries by chocolate export value in 2020"/></a><br><span>Find more insights at <a href="https://intelpoint.co/insights?utm_source=Insight%20Embed&utm_medium=HTML&utm_campaign=Top+African+countries+by+chocolate+export+value+in+2020" target="_blank" style="color: #4f9acc; text-decoration: none;">Intelpoint</a>.</span></div>
Copied to clipboard!
Tags
Algeria
Chocolate export
Côte d'Ivoire
Egypt
Eswatini
Ghana
Madagascar
Morocco
Nigeria
Senegal
South Africa
Tunisia
Zambia
Related Insights
South Africa accounted for nearly $1 in every $6 Africa earned from merchandise exports in 2025
Africa’s merchandise exports reached $689.2 billion in 2025.
Exports grew by 9.7%, the fastest rate outside Asia.
Africa accounted for just 2.6% of global merchandise exports.
South Africa led with $116.4 billion, followed by Nigeria and Egypt.
The top 15 economies generated 79.3% of Africa’s exports.
Nigeria's non-oil exports grew faster than oil exports in 2024 and 2025, though oil remained dominant
In 2025, non-oil export growth (36%) was 6x higher than oil (6%).
In 2024, non-oil exports grew by 189% vs oil’s 108%.
Total exports still heavily depend on oil.
Export value rose from ₦36 trillion in 2023 to ₦85.1 trillion in 2025.
Nigeria’s export mix stayed oil-heavy in 2025, with crude oil above 75% in all quarters
Crude oil dominated Nigeria’s exports in all quarters of 2025
Q1 recorded the highest oil dependency at 81.5%.
Non-oil exports peaked in Q2 at 24.2%, representing the strongest diversification point in 2025.
The oil share dropped to its lowest in Q2 (75.8%), but still remained dominant.
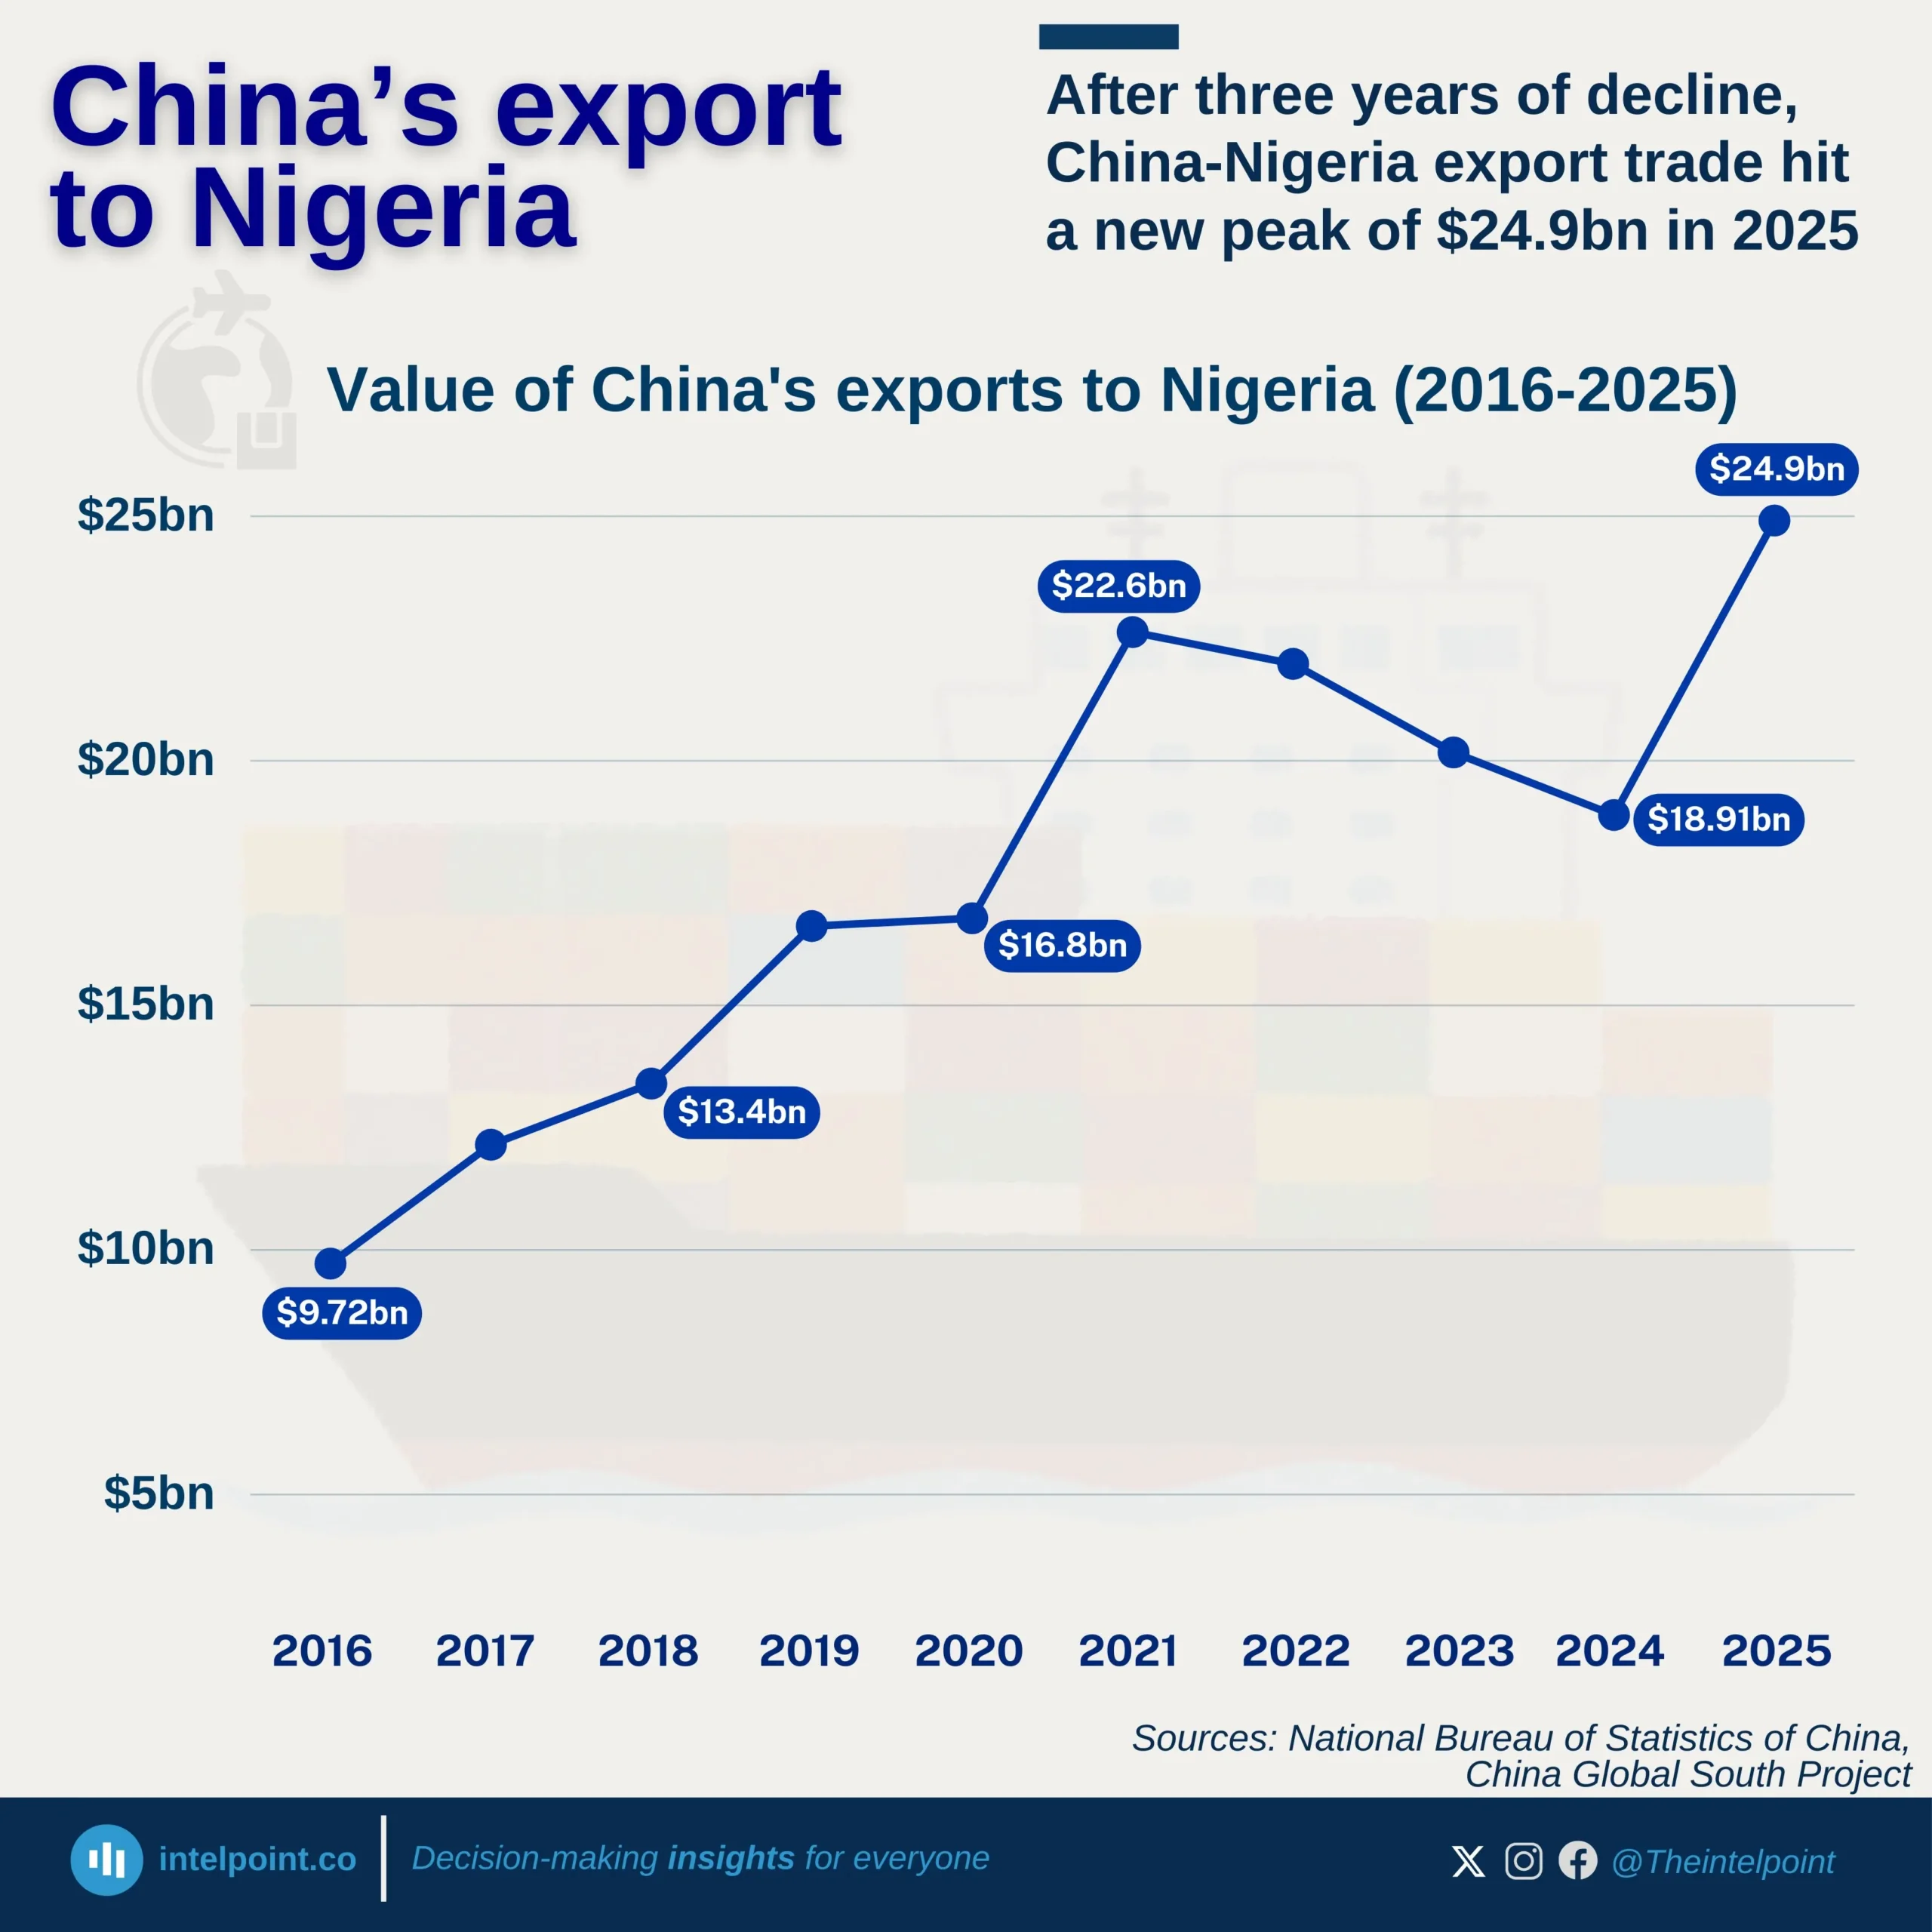
After three years of decline, China-Nigeria export trade hit a new peak of $24.9bn in 2025
Export value more than doubled from $9.72 billion in 2016 to $24.91 billion in 2025.
Trade rose steadily between 2016 and 2019, then surged sharply in 2021.
Exports declined for three consecutive years (2022–2024) after the 2021 peak.
2025 marks the highest export value in the ten-year period.
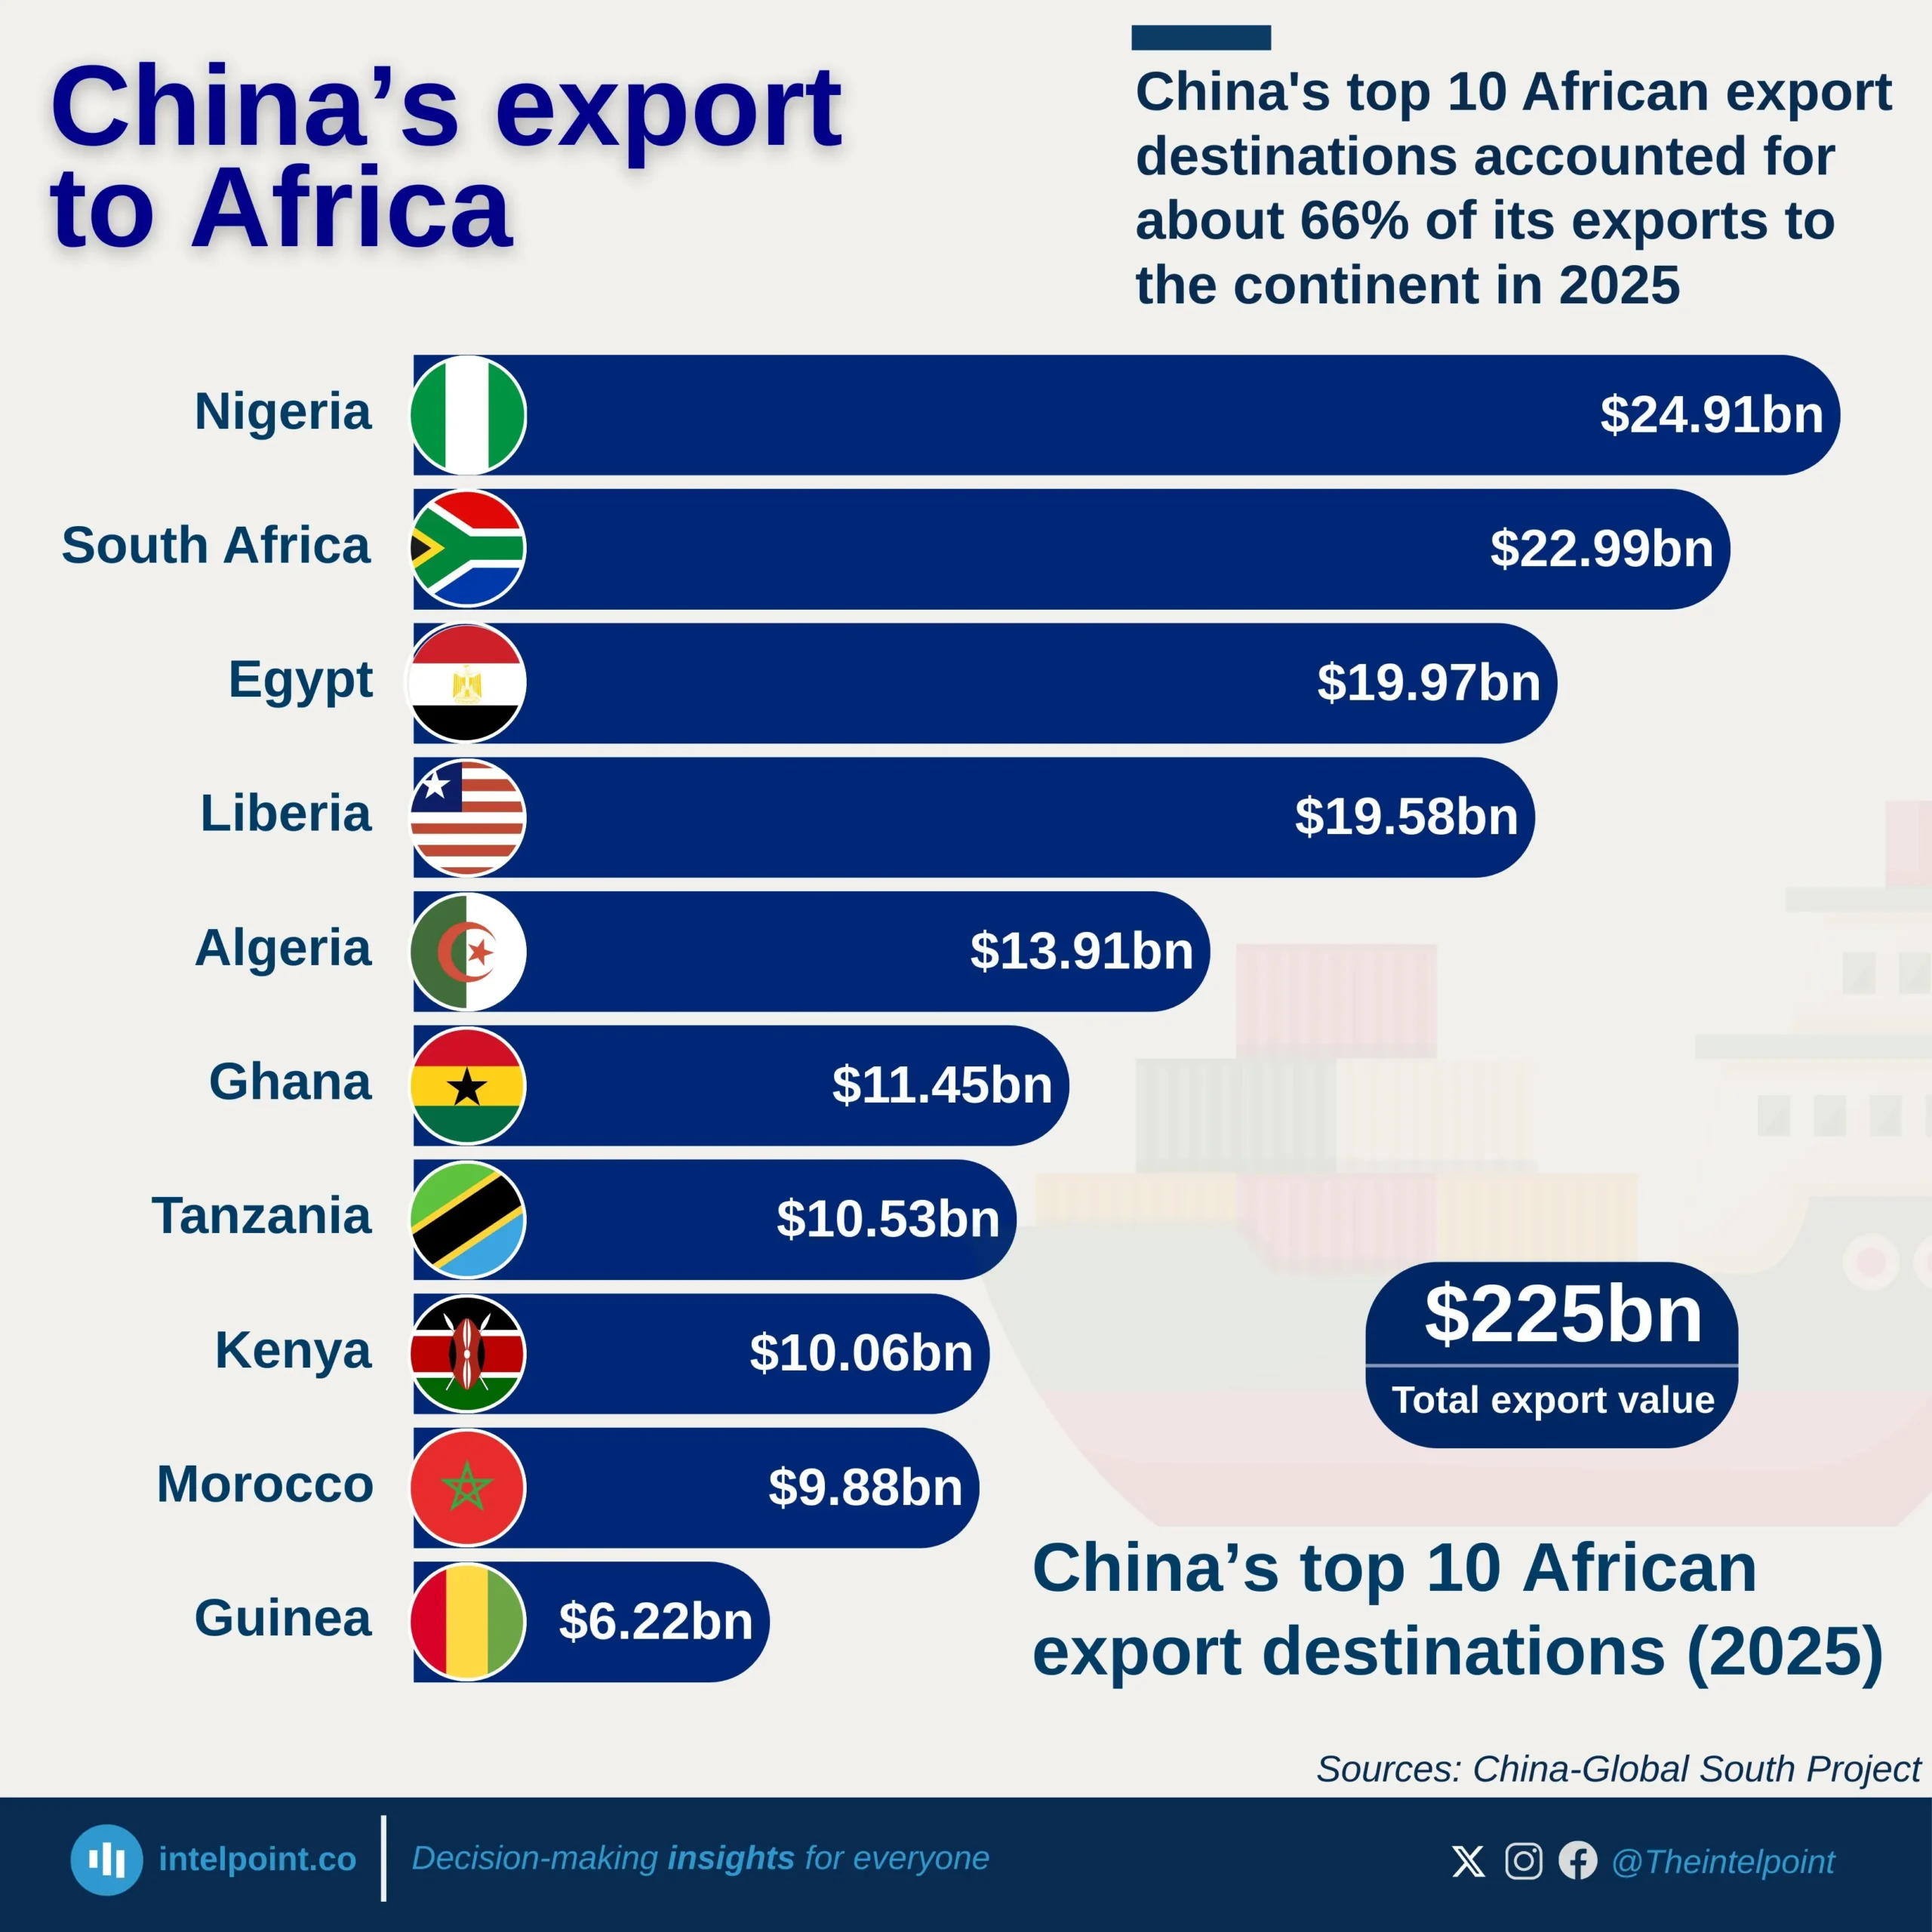
China's top 10 African export destinations take about 66% of its exports to the continent in 2025
Nigeria leads by a clear margin, receiving the highest export value at $24.91bn.
Large, diversified economies dominate the top tier, with
South Africa
and
Egypt
ranking among the biggest destinations.
Resource-linked trade remains significant, with countries like
Liberia
and
Algeria
absorbing substantial export value.
Trade reach is geographically diverse, spanning West, East, and North Africa, including
Ghana
,
Tanzania
,
Kenya
,
Morocco
, and
Guinea
.
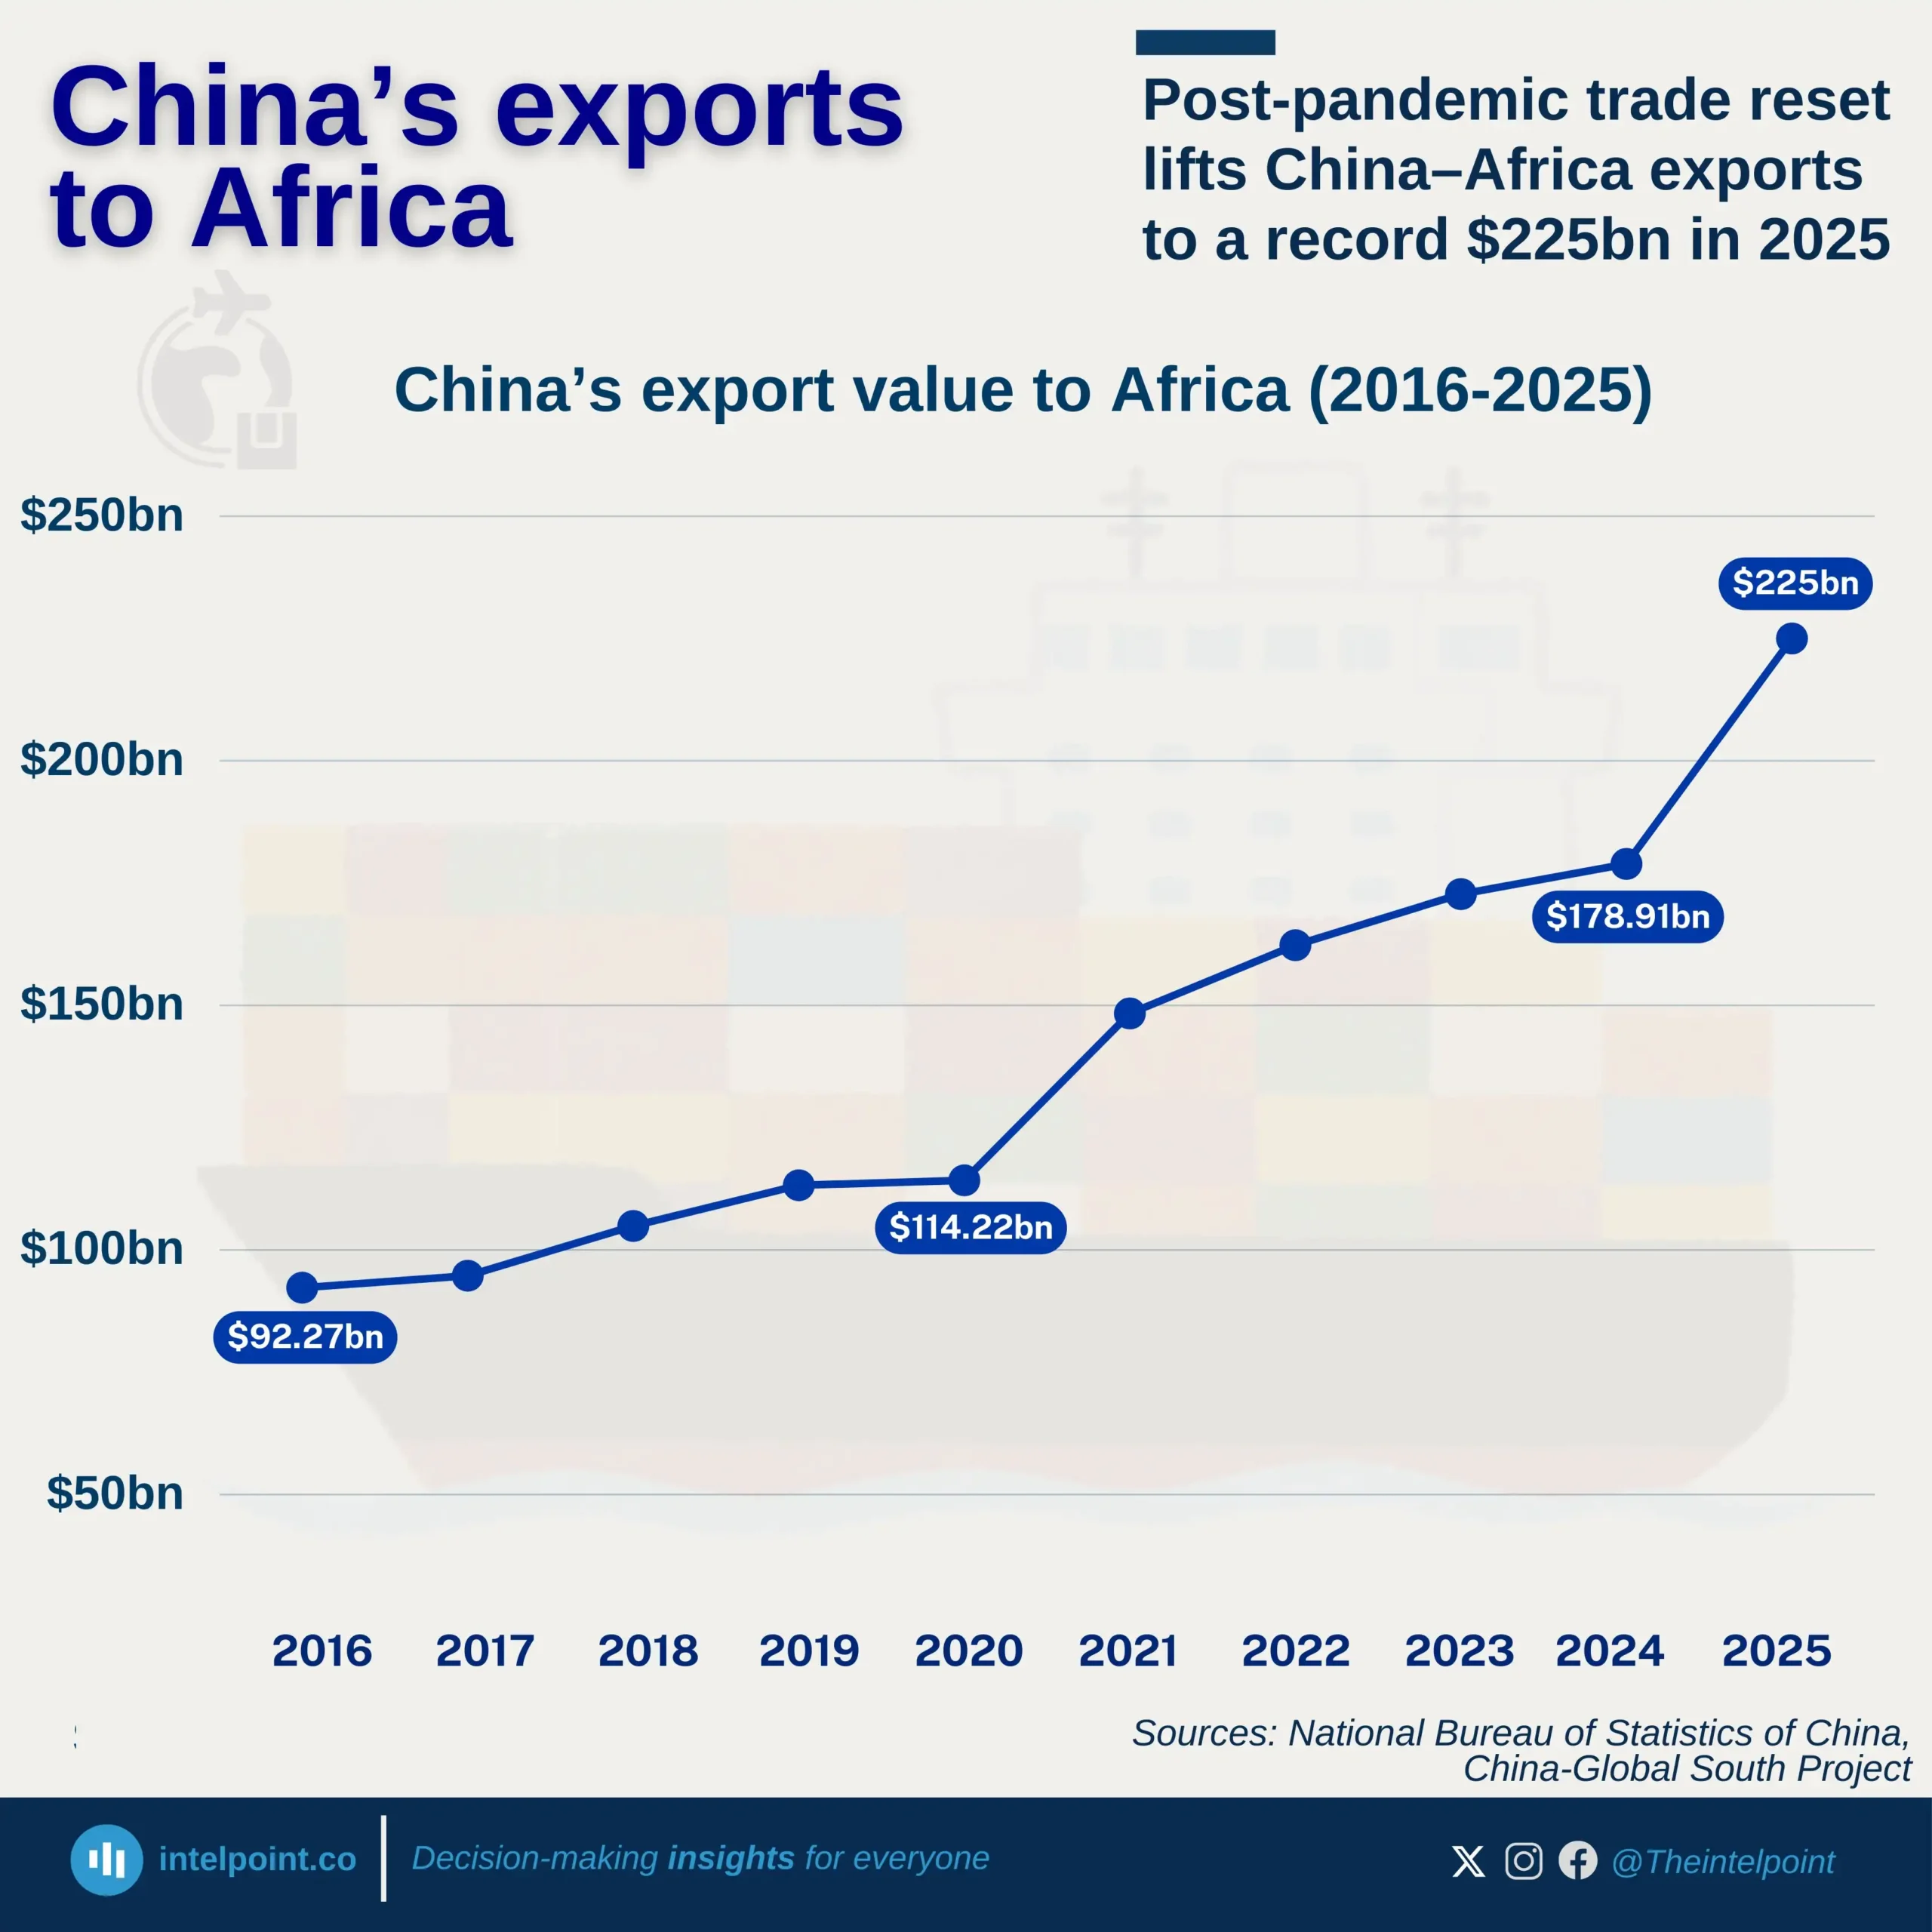
Post-pandemic trade reset lifts China–Africa exports to a record $225bn in 2025
Exports more than doubled in a decade, with trade rising from $92.27 billion in 2016 to $225 billion in 2025, a 144% increase.
The largest single jump occurred between 2020 and 2021, when exports surged by more than $34 billion.
From 2021 to 2024, exports climbed every year, reaching $178.91 billion before the latest surge.
The increase from $178.91 billion in 2024 to $225 billion in 2025 signals a new growth surge after several years of gradual increases.
POPULAR TOPICS
Nigeria
Trade
Debt
Economy
GDP
GET IN TOUCH
+234 813 204 738
hello@intelpoint.co
FIND US ON
SIGN UP TO OUR NEWSLETTER
Get periodic updates about the African startup space, access to our reports, among others.
Subscribe Here
Subscription Form
Subscribe
Sign Up
A product of Techpoint Africa. All rights reserved
Subscribe to our newsletter
Subscription Form
Updates
Sign Up
download
twitter-square
facebook-square
code
instagram